HAL Id: tel-01960951
https://tel.archives-ouvertes.fr/tel-01960951
Submitted on 19 Dec 2018
HAL is a multi-disciplinary open access archive for the deposit and dissemination of sci-entific research documents, whether they are pub-lished or not. The documents may come from teaching and research institutions in France or abroad, or from public or private research centers.
L’archive ouverte pluridisciplinaire HAL, est destinée au dépôt et à la diffusion de documents scientifiques de niveau recherche, publiés ou non, émanant des établissements d’enseignement et de recherche français ou étrangers, des laboratoires publics ou privés.
Analysis of the nonlinear behavior of inserts in sandwich
structures : application to an innovative sizing method
Juan de Dios Rodriguez
To cite this version:
Juan de Dios Rodriguez. Analysis of the nonlinear behavior of inserts in sandwich structures : appli-cation to an innovative sizing method. Mechanics of materials [physics.class-ph]. INSA de Toulouse, 2018. English. �NNT : 2018ISAT0019�. �tel-01960951�
THÈSE
En vue de l’obtention du
DOCTORAT DE L’UNIVERSITÉ DE TOULOUSE
Délivré par l'Institut National des Sciences Appliquées de
Toulouse
Présentée et soutenue par
Juan de Dios RODRÍGUEZ RAMÍREZ
Le 18 octobre 2018
Analyse du comportement non-linéaire d'inserts de
structures sandwichs : application à une méthode de
dimensionnement innovante.
Ecole doctorale : MEGEP - Mécanique, Energétique, Génie civil, Procédés Spécialité : Génie mécanique, mécanique des matériaux
Unité de recherche :
ICA - Institut Clément Ader
Thèse dirigée par
Bruno CASTANIE et Christophe BOUVET
Jury
M. Peter DAVIES, Rapporteur M. Philippe VIDAL, Rapporteur Mme Chiara BISAGNI, Examinateur M. Pascal THEVENET, Examinateur M. Bruno CASTANIÉ, Directeur de thèse M. Christophe BOUVET, Co-directeur de thèse
Acknowledgements
I must thank all the people who surrounded me during these three years and a half. This work would not have been the same without them.
Special mention goes to my thesis advisors, Bruno CASTANIÉ and Christophe BOUVET, who were my examples to follow and who did not hesitate to put me in the right path, many, many times.
Also, to Xavier FOULQUIER Alain BUINOT, Marc CHARTROU, Olivier CHERRIER, Alexander CHARDONEAU et Mickaël DE SAN JOSE without them, this work would have lacked experimental evidence.
To the members of the jury, Peter DAVIES, Philippe VIDAL and Pascal THEVENET, for having kindly accepted to review my work and for their corrections.
To Chiara BISAGNI for accepting being president of the jury despite of his.
Also, to Mathieu DELOUBES, Jean-Paul GIAVARINI, Fatah KHERIS and the SOGECLAIR Aerospace for supporting my work.
To the CONACYT from Mexico for financing my studies, but also to the ICA members and the INSA Toulouse for giving me the opportunity to study in France.
To my friends, wherever you are, without them, this would have been a very short trip. Many thanks to my family for their very special and unconditional support.
Résumé
Mots-clés : Structures Sandwich, Inserts, Nid d'abeille Nomex, E.F. non-linéaire
Introduction
Le dimensionnement des inserts pour les structures sandwich se fait à la lumière de quelques références bibliographiques, telles que le « Insert design handbook » de l'ESA [1], ou le « Military handbook 23A » des États Unis d’Amérique [2], qui recommandent l'usage de méthodes analytiques basées sur le travail de recherche développé par Ericksen en 1953 [3]. Cependant, cette méthode peut mener à des erreurs de la charge admissible d’arrachement d’environ ±20 % [4].
Objectif de la thèse
Le but de cette recherche est d’étudier la rupture des inserts de panneaux sandwich lors des charges d’arrachement.
Puis, il s´agissait de développer une méthode de dimensionnement d’inserts qui soit basée sur la méthode E.F.
Cette méthode devrait fournir des prédictions plus précises que les approches analytiques et au même titre, elle doit être facile et rapide à implanter.
Structure de la thèse.
Cette recherche est divisée en 5 chapitres qui couvrent des aspects différents impliqués dans la conception d’inserts :
Le premier chapitre contient une introduction générale qui montre le contexte technologique et de recherche autour des inserts pour les panneaux sandwich.
Le deuxième chapitre concerne l’état de l’art pour l’étude et l’analyse des structures du nid d’abeille Nomex.
Le troisième chapitre est focalisé sur l'analyse de la rupture en cisaillement du nid d’abeille. Le quatrième chapitre, présente une étude des propriétés mécaniques de mousses
polymériques syntactiques pour inserts.
Enfin, dans le cinquième chapitre, tous les développements des chapitres précédents sont intégrés dans le développement d’un modèle E.F, réduit d’insert qui est utilisé extensivement pour tracer des cartes de type de rupture d’inserts.
State of the art of inserts for sandwich
structures
Les structures de sandwich ne sont utilisées que pour le cadre principal des hélicoptères, quelques avions d’affaires, et pour les structures secondaires d'avions commerciaux [5]. En effet, ces structures sont très sensibles aux charges concentrées, telles que les impacts ou les sollicitations dues à l’assemblage [6], mais aussi parce que leur fabrication n´est pas encore bien maitrisée.
En ce qui concerne l’assemblage de panneaux sandwich au moyen d’inserts, les principaux problèmes sont les microfissures formées par la fatigue et le vieillissement du
potting, mais aussi le manque de compréhension du scénario de rupture après l’arrachement [7].
Selon plusieurs chercheurs, lorsqu’un insert est soumis à l’arrachement, l’évidence expérimentale suggère que la rupture des inserts est principalement occasionnée par l’endommagement de l’âme en cisaillement. En conséquence, la charge admissible de l’insert doit être proportionnelle à la résistance en cisaillement du nid d’abeille [8].
Pour cette raison, les modélisations mathématiques qui servent à calculer la charge admissible des inserts sont basées sur la résistance en cisaillement de l’âme. Et la plupart d’entre eux sont basées sur l’approche proposé par Ericksen en 1953. Cependant, même si ce modèle donne une approximation acceptable de la charge maximale (environ ±20 % d’erreur), le modèle est complexe et n’est pas simple pour l´implantation.
Aussi, étant donné que la rupture du nid d’abeille en cisaillement est directement liée à la rupture des inserts, une très bonne compréhension du comportement non linéaire en cisaillement du nid d’abeille est nécessaire afin de mieux comprendre la rupture des inserts.
Jusqu’à présent, la plupart de recherches sur le nid d’abeille se sont focalisées sur le comportement en compression ; seulement quelques-unes avaient été recensées sur le comportement en cisaillement.
Les modèles analytiques pour estimer la résistance en cisaillement du nid d’abeille se base sur l’hypothèse selon laquelle sa résistance est donnée au moment même où les cellules commencent à flamber [9], [10]. Cependant, ces modèles ne considèrent pas le post flambement élastique des cellules, et en conséquence, leurs estimations restent très éloignées de la réalité. Pour cette raison d’autres approches ont été utilisées par les chercheurs, comme la simulation numérique [11], [12].
Étude sur le comportement du nid d’abeille
en cisaillement.
La première partie de cette recherche est focalisée sur l’étude expérimentale et numérique du nid d’abeille Nomex en cisaillement.
Quatre types d’éprouvettes ont été testées au moment où un système de corrélation d’image 3D enregistrait et mesurait simultanément le flambement des cellules.
De ces expériences, il a été possible de constater que le flambement des cellules est très complexe et que les conditions limites des cellules ont une grande influence sur les modes de flambement. De ce fait, l’évidence expérimentale suggère que les cellules collapsent de façon graduelle et non toutes en même temps.
Aussi, il a été observé que le flambement des cellules se produit même quand les contraintes de cisaillement sont très faibles. Cela indique qu’il n’est pas correct de définir un critère de faille du nid d’abeille en cisaillement basée sur le début du flambement des cellules. De plus, il a été constaté que le flambement des cellules est élastique et réversible jusqu’à un certain point et que les conditions limites de ces dernières sont très importantes pour sa stabilité.
Puis, le même problème s´est présenté sur le plan numérique. Plusieurs modèles ont été développés sur Abaqus pour mieux comprendre le flambement des cellules à l’intérieur du nid d’abeille. Les modèles ont montré une bonne corrélation avec les résultats expérimentaux et il a été possible de décrire les différentes étapes du comportement non linéaire en cisaillement du nid d’abeille. Les conclusions et résultats obtenus ont mené à faire une publication sur ce sujet[13].
Finalement, une approche simplifiée pour considérer le flambement des cellules a été proposée. Cela permet de réduire le temps d’analyse de façon significative, de quelques heures à quelques minutes. Une autre publication sur ce sujet a été faite aussi [14].
Étude de la mousse syntactique pour inserts
de panneaux sandwich
Les propriétés mécaniques de la mousse syntactique utilisée pour les inserts ont été étudiées. Une campagne d´essais expérimentaux a été menée pour étudier les propriétés en traction et compression. Aussi une autre campagne d’essais technologiques a été réalisée pour observer une rupture similaire à celle du potting lors qu’un essai d’arrachement d’insert est fait. Le comportement classique des mousses syntactiques a été observé lorsque les essais de traction et compression ont été réalisés. La mousse devenait souple lorsque la concentration de microsphères augmente, et plus rigide quand il y avait moins de microsphères. Aussi, il a été constaté qu’en traction la rupture de la mousse se produit comme pour les matériaux fragiles. Alors que qu’en compression le matériau a un comportement très similaire à la plasticité parfaite.
Les essais technologiques ont permis d’observer des modes de rupture très similaires à ce qui arrive quand les inserts sont arrachés. La première rupture est la fracture du matériau due à la traction. Et la deuxième, la compression de la mousse quand le fastener n’est pas bien collé avec le potting.
En même temps, il a été possible de tester différentes configurations de spécimens et différentes concentrations des composants de la mousse en simultané au dégraissement des pièces métalliques. Puis, les résultats ont été comparés et plusieurs aspects intéressants ont été remarqués.
Quand la concentration de durcisseur était plus grande que celle recommandée par le fournisseur, la mousse devenait très souple et non fonctionnelle. D’autre part, quand la concentration de micro sphères était proche de 15 % du poids pondéral de la résine, la propriété de collage du potting devenait défectueuse, la même chose se produisait lorsque les pièces métalliques n’étaient pas dégraissées.
D’autre part, on pouvait constater lorsque la quantité de microsphères était inférieure à 11% du poids pondéral, quand les pièces métalliques étaient bien dégraissées et quand les spécimens ont été polymérisés à température ambiante.
Puis, une modélisation numérique du comportement en compression et traction de la mousse est proposée en utilisant un modèle de plasticité parfaite pour la compression, et une approche d’endommagement progressif pour la traction.
Cartes de rupture des inserts basées sur des
essais virtuels
Les méthodes analytiques pour estimer la charge admissible à l’arrachement des inserts comportent en général une erreur d’environ ±20 %. Cette différence peut être attribuée à différentes causes.
La première est le grand nombre de paramètres qui doivent être utilisés pour les équations analytiques, qui s’ils ne sont pas correctement sélectionnés, peuvent conduire à des erreurs importantes.
Deuxièmement, le fait que les inserts soient la plupart du temps installés à la main, peut conduire à avoir des défauts très importants, notamment pour la taille de l’insert et le remplissage des cellules du nid d’abeille.
Pour cette raison, une étude de l’influence des défauts dans les inserts a été menée. Les résultats de cette étude pour classifier les défauts des inserts peuvent se diviser en sept catégories :
La forme du potting de l’insert
Un faible collage entre le potting et le fastener La présence des boules d’air dans le potting. Les bords irréguliers du potting
Un remplissage incomplet des cellules
Des variations dans la concentration de microsphères
Quand la taille du potting est insuffisante pour contenir le fastener.
De ces sept défauts, seulement deux doivent être considérés pour la conception d’inserts car son influence et sa fréquence d’apparition sont importantes. Il s’agit des bords irréguliers du potting et la variation de la taille de l’inserts.
Par la suite, un modèle d’insert virtuel est développé en utilisant les modélisations numériques des différents composants précédents, notamment pour le nid d’abeille et le potting. Aussi, les résultats de l’analyse des défauts d’inserts sont utilisés pour le développement de ce modèle.
Pour valider le modèle numérique d’insert, il est comparé à des essais d’arrachement des inserts testes expérimentalement par Bunyawanichakul lors de sa thèse [15]. Puisque l’influence des défauts est prise en compte, deux modélisations sont faites, la première considérant les pires cas, quand la taille de l’insert est petite, que les bords sont irréguliers et que le potting n’est pas collé au fastener. Et le deuxième, quand il n’y a pas de défauts, le cas d’un insert idéal.
Les résultats montrent que les courbes expérimentales se trouvent dans l’enveloppe crées à partir des simulations numériques du meilleur et pire des cas. Ce qui suggère que le modèle virtuel donne des résultats cohérents et assez précis.
Finalement, ce modèle numérique est utilisé intensivement pour créer des cartes de mode de rupture d’inserts. Plus d´une centaine de simulations et analyses ont été réalisées pour développer ces cartes de rupture qui montrent les charges admissibles avant le premier endommagement de l’insert et le type d’endommagement qui doit se produire selon la taille de l’insert, la résistance du matériau de potting, l’épaisseur des peaux du sandwich et la résistance du nid d’abeille.
Ces types de cartes peuvent être fournis aux ingénieurs pour accélérer le processus de essai/calcul pour le dimensionnement d’inserts.
Index
CHAPTER ONE: GENERAL INTRODUCTION ... 1
1.1 FROM AIRCRAFT TO INSERTS ... 3
1.1.1 The sandwich structure ... 3
1.1.2 Sandwich panels joints; a problem still to be investigated ... 5
1.1.3 Remarks on the insert design methods ... 7
1.1.4 Objectives of the thesis ... 8
1.1.5 Summary of the thesis... 9
CHAPTER TWO: STATE OF THE ART OF INSERTS FOR SANDWICH STRUCTURES ... 11
2.1 INSERTS FOR SANDWICH STRUCTURES ... 13
2.1.1 Types ... 13
2.1.2 Testing standards ... 17
2.1.3 Pull-out experimental testing of inserts ... 18
2.1.4 Strength prediction of inserts by analytical approaches ... 31
2.1.5 Strength prediction of inserts by numerical approaches ... 45
2.1.6 Conclusions of the state of the art of insert analysis ... 52
2.2 SHEAR BUCKLING OF NOMEX® HONEYCOMB CORES ... 55
2.2.1 The honeycomb structure ... 55
2.2.2 Properties of the Nomex® paper ... 57
2.2.3 Shear testing of honeycomb cores ... 59
2.2.4 On the shear behavior of honeycomb cores. ... 61
2.2.5 Conclusions on the honeycomb’s shear buckling ... 65
CHAPTER THREE: EXPERIMENTAL AND NUMERICAL ANALYSIS OF HONEYCOMB CORES ... 67
3.1 INTRODUCTION ... 69
3.1.1 Objectives and proposed methods ... 69
3.2 BENCHMARK OF SPECIMENS FOR SHEAR TESTING OF HONEYCOMB CORES ... 73
3.2.1 Specimens description ... 73
3.2.2 Verdict and test results ... 75
3.2.3 Conclusions ... 79
3.3 SHEAR TESTING OF HONEYCOMB CORES... 81
3.3.1 Specimen fabrication ... 81
3.3.2 Test setup ... 83
3.3.3 Test results ... 84
3.3.4 Analysis of the buckling and postbuckling behavior of the cells ... 86
3.3.5 Conclusions ... 94
3.4 NUMERICAL STUDY OF SHEAR BUCKLING OF HONEYCOMB CELLS ... 99
3.4.1 Properties of the T-722 Nomex® paper ... 99
3.4.2 Study of the shear buckling of the Nomex® honeycomb core ... 100
3.4.3 Conclusions of the numerical analysis of the shear buckling ... 107
3.5 EXPERIMENTAL AND NUMERICAL STUDY OF THE CORE BOUNDARY CONDITIONS FOR INSERTS. ... 111
3.5.1 Numerical study ... 111
3.5.2 Experimental study ... 116
3.5.3 Conclusions on the boundary conditions ... 118
3.6 REDUCED CDM MODELING STRATEGY OF THE NONLINEAR SHEAR BEHAVIOR OF HONEYCOMB CORES ... 121
3.6.1 Analysis of the nonlinear shear stages of the honeycomb ... 121
3.6.2 Decoupled CDM approach for the shear behavior of honeycomb cores ... 124
3.6.3 Validation of the proposed approach ... 128
3.6.4 Conclusions ... 134
CHAPTER FOUR: STUDY OF SYNTHETIC POLYMER FOAMS FOR INSERTS ... 137
4.1 INTRODUCTION ... 139
4.1.1 Potting failure of inserts ... 139
4.1.2 Syntactic polymer foams as insert’s potting material ... 140
4.1.3 Objectives and proposed methods ... 143
4.2 MECHANICAL CHARACTERIZATION OF SPF FOR THE INSERT’S POTTING... 145
4.2.1 Study of the potting under uniaxial tension and compression ... 145
4.2.2 Study of the potting failure in inserts ... 151
4.2.3 Conclusions of the experimental study ... 159
4.3 NUMERICAL STUDY ... 161
4.3.1 Modeling of the potting behavior ... 161
4.3.2 Modeling of the potting pull-out tests ... 165
4.3.3 Results and discussion ... 166
4.4 CONCLUSIONS ... 169
CHAPTER FIVE: VIRTUAL TESTING OF INSERTS AND FAILURE MODE MAPS ... 171
5.1 INTRODUCTION ... 173
5.1.1 Insert sizing through the analytical methods ... 173
5.1.2 Insert sizing through F.E. modeling ... 175
5.1.3 Proposed methods ... 176
5.2 STUDY OF DEFECTS IN INSERTS ... 179
5.2.1 Analysis of the different defects of inserts ... 180
5.2.2 Evaluation of the criticality of defects in inserts ... 184
5.2.3 Analysis of variations of the potting radius ... 187
5.2.4 Conclusions about the defects in inserts ... 193
5.3 DEVELOPMENT OF THE INSERT F.E. MODEL ... 195
5.3.1 Description of the insert’s experimental reference ... 195
5.3.2 Insert F.E. model features ... 206
5.3.3 Implementation of the behavior laws ... 208
5.3.4 Parametrization of the F.E. with Abaqus scripting ... 221
5.3.5 Conclusion about the F.E. modeling of inserts ... 223
5.4 DEVELOPMENT OF THE FAILURE MODE MAPS ... 225
5.4.1 Exploration of the influence of the principal design variables ... 225
5.4.2 Sweep of the real potting radius: from 9.5 to 23.5 mm ... 228
5.4.3 Swept of the potting properties ... 228
5.4.4 Sweep of the skin thickness ... 229
5.4.5 Failure mode maps ... 230
5.4.6 Insert mass optimization ... 235
5.4.7 Loss of linearity criteria (LLC) vs first failure criterion (FFC) ... 237
5.5 CONCLUSIONS ... 239
GENERAL CONCLUSIONS AND PERSPECTIVES ... 241
REFERENCES ... 247
List of figures
FIG. 1: STRUCTURAL USAGE OF COMPOSITES IN THE BOEING 787.[4], [5]. ... 3
FIG. 2: GENERAL DESCRIPTION OF A SANDWICH STRUCTURE. ... 4
FIG. 3: THE STARSHIP AND THE RAYTHEON PREMIERE I. ... 4
FIG. 4: RADAR ABSORBING SANDWICH PANELS WERE USED TO BUILD ZUMWALT-CLASS DESTROYER [13]. ... 5
FIG. 5: USE OF SANDWICH PANELS ON THE BOEING 767 [14] ... 6
FIG. 6: DIFFERENT TECHNIQUES TO JOIN PANELS: DIRECTLY BONDING THEM, ADDING REINFORCEMENTS OR DENSIFYING CORNERS OF THE CORE TO INCREASE ITS MECHANICAL PROPERTIES. [11] ... 6
FIG. 7: HIGH LOAD INSERT ON THE LANDING GEAR DOOR OF THE AIRBUS A330 ... 7
FIG. 8: THESIS WORK PRESENTATION ... 9
FIG. 9: SEVERAL TYPES OF SANDWICH JOINTS [27]. ... 13
FIG. 10: COMPARISON OF THE SHUR-LOK FASTENER APPLICATIONS [35]. ... 14
FIG. 11: A) FORCE DISTRIBUTION OF A SCREW B) MECHANICAL FASTENER BEFORE INSTALLATION C) INSTALLED MECHANICAL FASTENER [6], [19], [36]. ... 15
FIG. 12: PARTIAL INSERT INSTALLATION PROCEDURE [32]. ... 15
FIG. 13: CUT OF A) A FULL POTTING INSERT, THE POTTING IS BONDED TO BOTH SKINS B) PARTIAL INSERT, BONDED TO ONLY ONE SKIN [20]. ... 16
FIG. 14: THROUGH THE THICKNESS INSERTS; A) HIGH LOAD CARRYING CAPABILITY INSERT TYPE AIRBUS [19] B) WITH FASTENER [20]. ... 16
FIG. 15: TEST STANDARDS OF A) SHEAR TESTING, B) PULL-OUT TEST, C) TORQUE TEST, [27], [39]. ... 18
FIG. 16: DAMAGE IDENTIFICATION [19]. ... 19
FIG. 17: EUROCOPTER INSERTS TYPE 1, 2 AND 3, [19]. ... 20
FIG. 18: PULL-OUT TEST OF A FULL POTTING INSERT [42]. ... 21
FIG. 19: PULL-OUT TEST SPECIMENS CUT IN HALF, SEVERAL FAILURE MODES WERE DETECTED [42]. ... 21
FIG. 20: INSERT DESCRIPTION AND FAILURE LOADS OF THE TESTS MADE BY SONG [33]. ... 22
FIG. 21: LOAD VS DISPLACEMENT CURVE AND SPECIMEN DESCRIPTION [26]. ... 22
FIG. 22: PULL-OUT FORCE VARIATION OF SEVERAL TESTS [20]. ... 22
FIG. 23: DAMAGE OF A PARTIAL INSERT IN A SHEAR TEST [32]. ... 23
FIG. 24: DETACHING OF THE FASTENER OF A SANDWICH PANEL INSERT, THIS MAY SUGGEST THAT THE POTTING WAS THE FIRST ELEMENT TO FAIL [32]. ... 23
FIG. 25: DAMAGE OF A PARTIAL INSERT IN A PULL-OUT TEST [27]. ... 24
FIG. 26: TESTING OF INSERTS OF DIFFERENT CHARACTERISTICS [21]. ... 24
FIG. 27: PULL-OUT TESTS OF INSERTS IN SANDWICH PANELS WITH ALUMINUM HONEYCOMB CORE [37]. ... 25
FIG. 28: PULL-OUT TEST PRESENTED BY BIANCHI [34]. ... 26
FIG. 29: POST IMPACT BEHAVIOR OF INSERTS PRESENTED BY MEZEIX [43]. ... 26
FIG. 30: PARAMETERS OF THE SANDWICH PANEL FOR THE MODEL OF ERICKSEN... 31
FIG. 31: SHEAR STRESS DISTRIBUTION OF THE CORE ACCORDING TO [3] AND T VALUES TO CALCULATE THE MAXIMAL SHEAR STRESS USING EQ. 4. ... 33
FIG. 32: K3 COEFFICIENT REPRESENTING THE SHEAR STRESS DISTRIBUTION IN THE CORE [44]... 34
FIG. 33: STRESS AND STRAIN OF THE SKINS GIVEN BY THE THOMSEN MODEL [46]. ... 35
FIG. 34: SIMPLIFICATION OF THE INSERT BY USING THE DIRECT APPROACH BY SIMPLE SHEAR [19]. ... 36
FIG. 35: APPROACH DESCRIPTION AND SHEAR STRESS DISTRIBUTION IN FUNCTION OF THE RADIUS AND SANDWICH PARAMETERS [2], [19]. ... 38
FIG. 36: ABACUS PROVIDED FOR THE SIZING OF INSERTS, THIS USES THE INSERT GEOMETRICAL AND MECHANICAL PARAMETERS TO CALCULATE THE K3 COEFFICIENT [2]. ... 40
FIG. 37: MINIMAL AND AVERAGE 𝑃𝑠𝑠 IN FUNCTION OF THE CORE HEIGTH AND THE THICKNESS OF THE SKINS [29]. ... 41
FIG. 38: FAILURE MODE VS CORE HEIGHT [1]. ... 42
FIG. 39: DISTRIBUTION OF THE SHEAR STRESS NEAR THE INSERT [29]. ... 42
FIG. 41: REDUCED MODEL OF A PARTIAL INSERT [27]. ... 47
FIG. 42: A) TRANSVERSE SHEAR STRESS FOR THREE DIFFERENT POTTING HEIGHTS (MPA) IN A PULL-OUT TEST, B) SHEAR STRESS DISTRIBUTION THROUGH THE THICKNESS OF THE CORE AT A RADIUS OF 10.5 MM [20]. ... 47
FIG. 43: VIRTUAL TESTING OF INSERTS [21]. ... 48
FIG. 44: BUCKLING SIMULATION OF THE CORE OF AN INSERT BY ROY [26]. ... 49
FIG. 45: VARIATION OF THE POTTING GEOMETRIES FOR THE SAME PERFORATION RADIUS [25]. ... 50
FIG. 46: COMPARISON OF THE ANALYTICAL MODEL VS THE F.E. CALCULATION OF THE SHEAR STRESS IN THE CORE [25]. ... 50
FIG. 47: MODEL PARAMETERS AND DESCRIPTION [24]. ... 51
FIG. 48: SENSITIVITY OF THE DIFFERENT PARAMETERS ACCORDINGLY TO [24]. ... 51
FIG. 49: SENSITIVITY OF THE DIFFERENT PARAMETERS ACCORDINGLY TO THE ESA INSERT DESIGN HANDBOOK [1]. ... 52
FIG. 50: MANUFACTURING PROCESS OF NOMEX® HONEYCOMBS [53]. ... 55
FIG. 51: REGULAR GEOMETRIC FIGURES THAT ALLOWS FOR TESSELLATION. ... 56
FIG. 52: COMMON DEFECTS OF THE NOMEX® HONEYCOMB CELLS [57]. ... 57
FIG. 53: LOAD VS STRAIN CURVES IN THE FIBER AND TRANSVERSE DIRECTION OF THE NOMEX® PAPER [59]. ... 58
FIG. 54: TENSILE TESTS ON A) THE NOMEX® PAPER T-410 ALONE, B) THE NOMEX® PAPER WITH A THICK PHENOLIC COATING (BECOMES BRITTLE) [52]. ... 58
FIG. 55: TENSILE TESTS ON A COATED NOMEX® PAPER BY FISCHER [60]. ... 59
FIG. 56: THE NOMEX® HONEYCOMB STRUCTURE UNDER THE MICROSCOPE, THE PHENOLIC RESIN LAYER IS VISIBLE [62]. ... 59
FIG. 57: DIFFERENT SHEAR TESTING SPECIMENS FOR HONEYCOMB CORES: A) DOUBLE BLOCK, B) THREE-POINT BENDING, C) SINGLE BLOCK, D) FOUR-POINT BENDING TESTS, E) DOUBLE-DOUBLE BLOCK [63], [64], [66]. ... 60
FIG. 58: SHEAR TESTING OF HONEYCOMB CORES; EXPERIMENTAL VS NUMERICAL SCENARIOS [62]. ... 62
FIG. 59: MODELING OF A THREE POINT BENDING [74]. ... 62
FIG. 60: VIRTUAL SHEAR TESTING OF HONEYCOMB CORES [53]. ... 63
FIG. 61:IMPACT MODELING OF A NOMEX® HONEYCOMB SANDWICH PANEL; NUMERICAL VS EXPERIMENTAL RESULTS [75]. ... 64
FIG. 62: MODELING OF THE IMPACT ON AN ALUMINUM SANDWICH PANEL, EXPERIMENTAL VS NUMERICAL RESULTS [77]. ... 64
FIG. 63: IDENTIFICATION OF THE EFFECTIVE DAMAGE OF THE HONEYCOMB CORE. ... 70
FIG. 64: COMPARISON OF THE BUCKLING PATTERN OF TWO NOMEX® HONEYCOMB CORES SUBJECTED TO SHEAR LOADS: (A) AN INSERT SPECIMEN AFTER A PULL-OUT TEST WHERE THE CELLS HAVE PLASTICIZED (EXTRACT FROM [19]), VERSUS (B) A SINGLE RAIL SHEAR TEST (REPRODUCED FROM SEEMANN [53]). .... 71
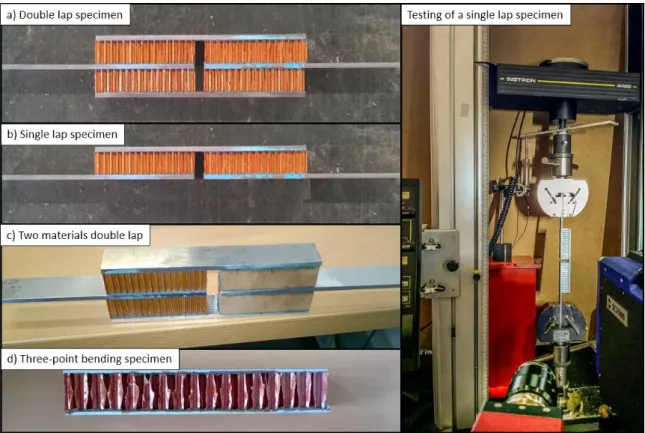
FIG. 65: SPECIMENS FABRICATED FOR THE BENCHMARK STUDY AND TESTING OF A SINGLE RAIL SPECIMEN. ... 73
FIG. 66: CHARACTERISTICS OF THE MODIFIED DOUBLE LAP SPECIMEN. ... 75
FIG. 67: REPRESENTATIVE CURVES OF THE AVERAGE SHEAR STRESS VS GAMMA FOR THE DIFFERENT TYPE OF SPECIMENS. ... 76
FIG. 68: DISPLACEMENT FIELD MEASURED IN THE OUT-OF-PLANE DIRECTION OF THE SANDWICH BEAM. ... 76
FIG. 69: DISPLACEMENT FIELD MEASURED IN THE OUT-OF-PLANE DIRECTION THE DOUBLE LAP SPECIMEN. .... 77
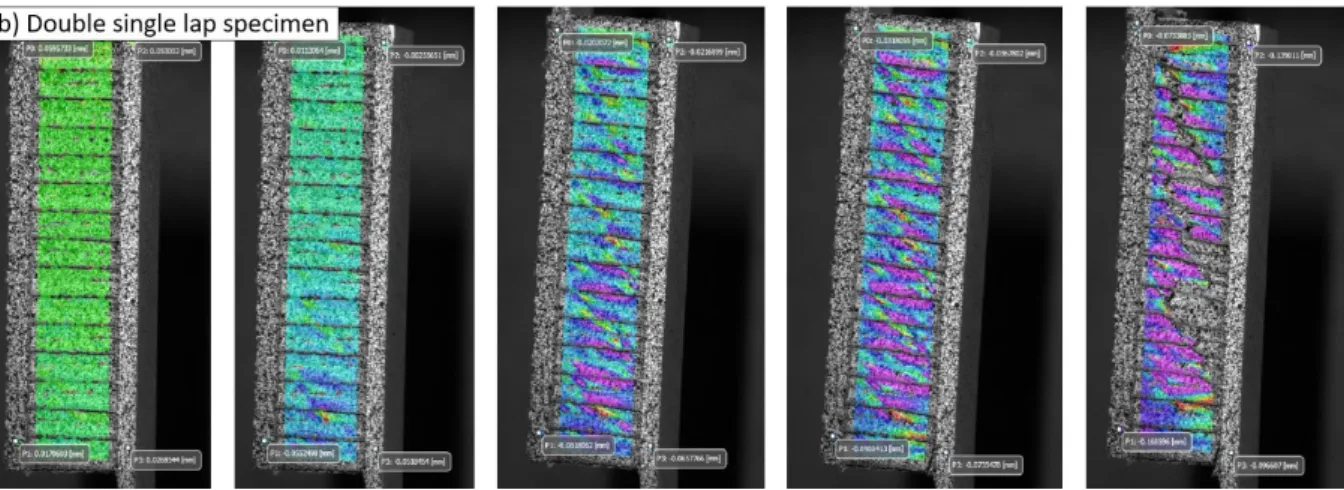
FIG. 70: DISPLACEMENT FIELD MEASURED IN THE OUT-OF-PLANE DIRECTION OF THE DOUBLE SINGLE LAP SPECIMEN. ... 78
FIG. 71: COMPARISON OF THE SHEAR CURVES OF THE NORMAL AND MODIFIED DOUBLE LAP SPECIMENS. ... 79
FIG. 72: SPECIMEN DESCRIPTION FOR THE SHEAR TESTING OF HONEYCOMBS. ... 81
FIG. 73: ASSEMBLY OF THE TEST SPECIMENS, B) SPECIMENS IN THE MOLDS C) SPECIMENS READY FOR THE SECOND CURING PROCESS, D) MOLDS IN THE OVEN. ... 82
FIG. 74: THE 10 KN INSTRON MACHINE AND THE 2 VIC 3D CAMERAS. ... 83
FIG. 75: TEST RESULTS OF THE HRH-10 HONEYCOMB CORE. ... 84
FIG. 76: TEST RESULTS OF THE ALU 5052 HONEYCOMB CORE. ... 84
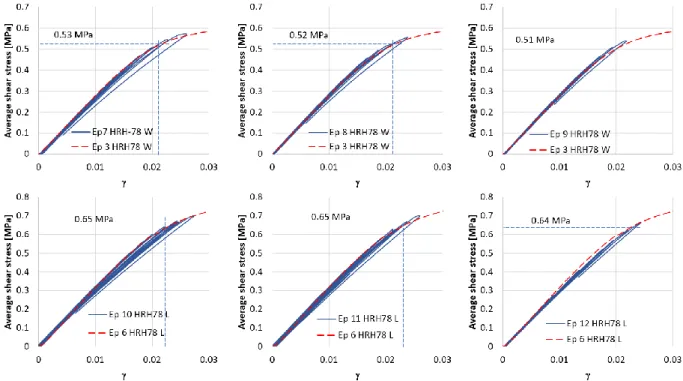
FIG. 77: AVERAGE SHEAR STRESS VS GAMMA CURVES OF THE HRH-78 IN W AND L DIRECTION. ... 85
FIG. 78: INCREMENTAL CYCLIC TESTING OF THE SPECIMEN 9. ... 85
FIG. 79: INCREMENTAL CYCLIC TESTING OF THE HRH-78 CORE: AVERAGE SHEAR STRESS VS GAMMA. ... 86
FIG. 80: EVOLUTION OF OUT-OF-PLANE DISPLACEMENTS MEASURED FROM A) 0 MM TO 0.04 MM AND B) 0 MM TO -0.04 MM. ... 87
FIG. 81: BUCKLING OF THE CELLS AT 0.24 MPA AND 0.4 MPA. ... 88
FIG. 82: BUCKLING EVOLUTION OF A CELL: FROM INITIAL BUCKLING TO COLLAPSE. ... 89
FIG. 83: NUMBER OF BUCKLES VS AVERAGE SHEAR STRESS AND GAMMA. ... 90
FIG. 84: BUCKLED CELLS AND AVERAGE SHEAR STRESS COMPARISON, ANALYSIS MADE BY OURSELVES. ... 91
FIG. 86: DESCRIPTION OF THE PRETREATMENT OF THE TEST VIDEOS. ... 92
FIG. 87: IMAGE OF CELLS BEFORE AND AFTER COLOR SEGMENTATION. ... 93
FIG. 88: EXAMPLES OF COLLAPSING AND NON-COLLAPSING CELLS TO TRAIN THE ANN. ... 94
FIG. 89: COLLAPSE OF THE CELLS ACCORDING TO THE RESULTS GIVEN BY THE ANN VS THE AVERAGE SHEAR STRESS. ... 94
FIG. 90: FAILURE SCENARIO OF THE SPECIMENS. ... 95
FIG. 91: COMPARISON OF A SPECIMEN BEFORE AND AFTER THE TEST. ... 97
FIG. 92: CELL WALL BOUNDARY CONDITIONS AND BUCKLING MODES. ... 100
FIG. 93: BUCKLING OF A CELL WALL (OUT-OF-THE-PLANE DISPLACEMENT) AND FORCE VS DISPLACEMENT CURVE. ... 101
FIG. 94: SINGLE CELL BOUNDARY CONDITIONS AND BUCKLING MODES. ... 102
FIG. 95: BUCKLING OF A SINGLE CELL (SCALE: 0 TO -0.1054 MM) AND FORCE VS DISPLACEMENT CURVE. ... 103
FIG. 96: THE BUCKLING SHAPE SUGGESTS THE IMPORTANCE OF THE SURROUNDING CELLS. ... 103
FIG. 97: BOUNDARY CONDITIONS OF THE DOUBLE LAP TEST MODEL. ... 104
FIG. 98: REAL TESTS VS SIMULATION OF HRH-78. ... 105
FIG. 99: CELL BUCKLING EXPERIENCED BY THE EXTERIOR AND THE INTERIOR OF THE SPECIMEN OF THE DOUBLE LAP TEST. ... 105
FIG. 100: AVERAGE SHEAR STRESS VS NODAL ROTATION OF THE DOUBLE LAP F.E. MODEL. ... 106
FIG. 101: AVERAGE SHEAR STRESS VS GAMMA OF THE DOUBLE LAP F.E. MODEL: WHEN THE NOMEX® PAPER WAS CONSIDERED TO BE TOTALLY ELASTIC THE CELLS DOESN’T COLLAPSE... 107
FIG. 102: DESCRIPTION OF THE NONLINEAR BEHAVIOR OF THE NOMEX® HONEYCOMB CORE HRH-78. ... 108
FIG. 103: CELL BUCKLING EXPERIENCED BY THE EXTERIOR AND THE INTERIOR OF THE SPECIMEN OF THE DOUBLE LAP TEST. ... 111
FIG. 104: CHARACTERISTICS OF THE SANDWICH BEAM MODEL WITH POTTING RESIN AT THE BORDERS. ... 112
FIG. 105: BUCKLING OF THE EXTERIOR AND INTERIOR CELLS OF THE SANDWICH BEAM WITH POTTING RESIN AT THE BORDERS. ... 113
FIG. 106: AVERAGE SHEAR STRESS VS GAMMA: DOUBLE LAP TESTS AND SANDWICH BEAM WITH POTTING AT THE BORDERS. ... 114
FIG. 107: AVERAGE SHEAR STRESS VS TOTAL NODAL ROTATION OF THE ELEMENTS: DOUBLE LAP TESTS VS SANDWICH BEAM WITH RESIN AT THE BORDERS. ... 114
FIG. 108: CHARACTERISTICS OF THE MODEL OF THE HONEYCOMB CORE WITHOUT SKINS. ... 115
FIG. 109: BUCKLING OF THE CELLS AND THE AVERAGE SHEAR STRESS VS GAMMA: THREE CASES. ... 115
FIG. 110: CHARACTERISTICS OF SANDWICH BEAM SPECIMENS WITH POTTING AT THE BORDERS. ... 116
FIG. 111: TESTING OF THE SANDWICH BEAM SPECIMENS WITH RESIN AT THE BORDERS, BEFORE AND AFTER THE TESTS. ... 117
FIG. 112: CURVES OF THE DOUBLE LAP TESTS VS THE SANDWICH BEAM TEST WITH POTTING AT THE BORDERS (W-DIRECTION). ... 118
FIG. 113: CURVES OF THE DOUBLE LAP TESTS VS THE SANDWICH BEAM TEST WITH POTTING AT THE BORDERS (L-DIRECTION). ... 118
FIG. 114: INCREMENTAL CYCLIC TESTING OF THE HTH-78 CORE: DAMAGED SHEAR BEHAVIOR OF THE HONEYCOMB STRUCTURE. ... 122
FIG. 115: CHANGE ON THE SHEAR STIFFNESS OF THE STRUCTURE: “ELASTIC BUCKLING” OF THE CELLS VS “BUCKLING & COLLAPSE” OF THE CELLS IN THE W DIRECTION. ... 122
FIG. 116: DETECTION OF THE COLLAPSE OF THE CELLS IN THE W DIRECTION THROUGH AN ANN (REMINDER). ... 123
FIG. 117: FITTING OF THE CURVE OF PERCENTAGE OF CELLS ABOUT TO BUCKLE WITH A PROBABILITY DISTRIBUTION FUNCTION; THE PROBABILITY DENSITY IS SHOWN IN BLUE. ... 124
FIG. 118: AVERAGE CURVES OF THE “DOUBLE RAIL TESTS” VS THE “SANDWICH BEAM WITH POTTING AT THE BORDERS”. ... 125
FIG. 119: COMPARISON OF THE CELLS RIPPING IN A 3-POINT BENDING TEST WITH POTTING RESIN AT THE BORDERS AND A DOUBLE RAIL TEST. ... 125
FIG. 120: FITTING OF THE EXPERIMENTAL RAIL SHEAR TESTING CURVES OF THE HRH-78 IN THE W AND L DIRECTIONS USING THE CDM PROPOSED APPROACH. ... 127
FIG. 121: DENSITY DISTRIBUTION CURVES REPRESENTING THE BUCKLING AND COLLAPSE STAGES OF THE CELLS. ... 128
FIG. 122: MESH OF THE DOUBLE RAIL TEST MODEL. ... 129
FIG. 123: FORCE VS DISPLACEMENT CURVES OF THE DOUBLE RAIL TESTS: EXPERIMENTAL VS NUMERICAL RESULTS FOR THE W DIRECTION. ... 129
FIG. 124: MESH OF THE SANDWICH BEAM WITH POTTING AT THE BORDERS. ... 130
FIG. 125: FITTING OF THE EXPERIMENTAL SANDWICH BEAM WITH POTTING AT THE BORDER IN THE L DIRECTION USING THE CDM PROPOSED APPROACH THAT CREATES CONVERGENCE ISSUES. ... 131
FIG. 126: FITTING OF THE EXPERIMENTAL SANDWICH BEAM WITH POTTING AT THE BORDER IN THE L
DIRECTION; LAW 2 AVOIDS CONVERGENCE ISSUES (SEE TABLE 10). ... 131
FIG. 127: FORCE VS DISPLACEMENT CURVES OF THE SANDWICH BEAM TESTS: EXPERIMENTAL VS NUMERICAL RESULTS. ... 132
FIG. 128: COMPARISON OF THE FAILURE SCENARIO OF THE NUMERICAL MODEL VS REAL TESTS, THE RESULTS ARE CONSISTENT. ... 132
FIG. 129: FORCE VS DISPLACEMENT CURVES OF THE SANDWICH BEAM TESTS: EXPERIMENTAL VS NUMERICAL RESULTS. ... 133
FIG. 130: TWO DIFFERENT LAWS ARE USED TO MODEL THE SHEAR BEHAVIOR OF THE HRH-78 CELLS, WITH AND WITHOUT THE EFFECT OF THE LATERAL STABILIZATION OF THE CELLS. ... 133
FIG. 131: FAILURE SCENARIO AFTER A PULL-OUT TEST PERFORMED BY YONG AND HEIMBS [32], [27]. ... 139
FIG. 132: FAILURE SCENARIO AFTER A PULL-OUT TEST PERFORMED TO DIFFERENT TYPE OF INSERTS. [19] .... 139
FIG. 133: DIFFERENCE BETWEEN THE FAILURE IN TRACTION AND COMPRESSION OF SYNTACTIC FOAMS. [90]141 FIG. 134: COMPARISON OF THE ANALYTICAL ESTIMATION VS THE EXPERIMENTAL RESULTS BY [90] ... 142
FIG. 135: CLASSICAL BEHAVIOR OF SYNTACTIC FOAMS IN COMPRESSION AND TRACTION BY [90] ... 142
FIG. 136: POTTING UNDER THE MICROSCOPE ... 143
FIG. 137: COMPRESSION TESTS MADE BY BUNYAWANICHAKUL ON THE ADHESIVE AV121-B ALONE WITH AND WITHOUT POROSITIES. ... 145
FIG. 138: SIZE OF THE COMPRESSION SPECIMENS AND VIEW OF THE SURFACES UNDER THE MICROSCOPE. .. 147
FIG. 139: SHAPE AND SET UP OF THE TRACTION TESTS SPECIMENS. ... 147
FIG. 140: EXPERIMENTAL CURVES OF THE TENSILE TESTS OF THE POTTING. ... 148
FIG. 141: TEST RESULTS OF THE COMPRESSION TESTS OF THE POTTING ... 149
FIG. 142: DENSITY OF THE SPF AS FUNCTION OF THE MICRO-SPHERES CONCENTRATION. ... 149
FIG. 143: EXPERIMENTAL EFFECTIVE YOUNG MODULI IN TRACTION AND COMPRESSION AS FUNCTION OF THE MICRO-SPHERES CONCENTRATION. ... 150
FIG. 144: RESISTANCE TO FAILURE UNDER TRACTION AND COMPRESSION AS FUNCTION OF THE MICRO-SPHERES CONCENTRATION. ... 150
FIG. 145: TEST SPECIMENS SUBJECTED TO PULL-OUT. ... 151
FIG. 146: GEOMETRY OF THE RODS AND POTTING CONTAINERS. ... 152
FIG. 147: TEST SET UP AND MEASURING OF THE PULL-OUT DISPLACEMENT OF THE ROD ... 154
FIG. 148: EXPERIMENTAL RESULTS OF THE TEST SPECIMENS TYPE 1. ... 154
FIG. 149: EXPERIMENTAL RESULTS OF THE TEST SPECIMENS TYPE 2. ... 155
FIG. 150: EXPERIMENTAL RESULTS OF THE TEST SPECIMENS TYPE 3. ... 155
FIG. 151: EXPERIMENTAL RESULTS OF THE TEST SPECIMENS TYPE 4. ... 156
FIG. 152: SUPPOSED POTTING FAILURE DUE TO TRACTION OF SPECIMENS EP1 AND EP5. ... 157
FIG. 153: CAUSES OF THE DETACHING OF THE METALLIC ROD. ... 158
FIG. 154: FAILURE OF THE POTTING IN SHEAR ... 159
FIG. 155: COMPARISON OF THE FAILURES OF INSERTS AND THE POTTING TEST; THE FASTENER WAS FIRMLY BONDED. ... 160
FIG. 156: COMPARISON OF THE FAILURES OF INSERTS AND THE POTTING TEST; THE FASTENER WAS NOT BONDED. ... 160
FIG. 157: ALGORITHM IMPLEMENTED IN TO AN UMAT TO REPRESENT THE POTTING MATERIAL BEHAVIOR. . 162
FIG. 158: COMPARISON OF THE EXPERIMENTAL AND NUMERICAL LAWS FOR THE POTTING WITH 7% OF MICRO-SPHERES ... 163
FIG. 159: COMPARISON OF THE EXPERIMENTAL AND NUMERICAL LAWS FOR THE POTTING WITH 10% OF MICRO-SPHERES ... 163
FIG. 160: COMPARISON OF THE EXPERIMENTAL AND NUMERICAL LAWS FOR THE POTTING WITH 13% OF MICRO-SPHERES ... 164
FIG. 161: MODELING OF THE TRACTION AND COMPRESSION TESTS. ... 164
FIG. 162: EXPERIMENTAL VS NUMERICAL RESULTS; TRACTION AND COMPRESSION TESTS. ... 165
FIG. 163: MODELING OF THE POTTING PULL-OUT TESTS. ... 165
FIG. 164: COMPARISON OF THE VERTICAL DISPLACEMENT FIELD BETWEEN THE EXPERIMENTAL AND NUMERICAL RESULTS FOR EP1 AND EP9 SPECIMENS. ... 166
FIG. 165: EXPERIMENTAL VS NUMERICAL RESULTS: LOADING CURVES OF THE SPECIMENS’ TYPE 1 AND 2. .... 167
FIG. 166: EXPERIMENTAL VS NUMERICAL RESULTS: LOADING CURVES OF THE SPECIMENS’ TYPE 3 AND 4. .... 167
FIG. 167: EFFECTIVE YOUNG MODULI: OBTAINED VALUES VS THE PREDICTION OF THE RULE OF MIXTURES. .. 168
FIG. 168: EXAMPLE OF THE APPLICATION OF THE ESA METHOD TO THE INSERT TYPE 1 (SEE NEXT SECTION) USING DIFFERENT HYPOTHESIS FOR THE MATERIALS AND GEOMETRIES. ... 174
FIG. 169: EXAMPLES OF VARIATIONS OF THE POTTING SHAPE FOR INSERTS [20], [30]. ... 180
FIG. 170: EXAMPLE OF DETACHING OF THE FASTENER [19], [32]. ... 181
FIG. 172: EXAMPLES OF THE IRREGULAR BORDERS FORMED IN INSERTS DUE TO PARTIAL REMOVAL OF THE
HONEYCOMB CELL WALLS [19], [20], [28]. ... 182
FIG. 173: EXAMPLES OF INCOMPLETE FILLING UNDERNEATH THE FASTENER BOREHOLES [19], [42]. ... 183
FIG. 174: EXAMPLES OF A) VARIATION OF THE MICRO-SPHERES CONCENTRATION OR POROSITIES, B) EXAMPLE OF AN INSERT ON WHICH THE INSERT IS SMALLER THAN THE INSERT RADIUS [33], [34]. ... 183
FIG. 175: DEFINITION OF THE EFFECTIVE POTTING RADIUS (EPR) AND THE REAL POTTING RADIUS (RPR) ACCORDING TO THE ESA [1]. ... 187
FIG. 176: EVIDENCE SHOWS THAT THE FAILURE APPEARS FROM THE POTTING REAL SHAPE INSTEAD OF FROM THE DOUBLE CELL WALLS. ... 189
FIG. 177: RESULTS OF THE SCRIPT DEVELOPED IN MATLAB: THE CELLS THAT ARE FILLED CHANGES WITH THE POSITION OF THE PERFORATION ... 190
FIG. 178: THE PERFORATION WAS TESTED FROM DIFFERENT CENTERS SHOWN IN BLUE. ... 191
FIG. 179: AVERAGE, MINIMAL, AND MAXIMAL NUMBER OF FILLED CELLS FOR DIFFERENT CELL SIZES (SC=1/8”, 3/16”, 1/4” AND 3/8”). ... 191
FIG. 180: AVERAGE, MINIMAL, AND MAXIMAL REAL POTTING RADIUS (RPR) FOR DIFFERENT CELL SIZES (SC=1/8”, 3/16”, 1/4” AND 3/8”). ... 192
FIG. 181: REAL POTTING RADIUS (RPR) FOR DIFFERENT CELL SIZES: ESTIMATION OF THE ESA VS THE OBTAINED RESULTS. ... 192
FIG. 182: GENERAL DESCRIPTION OF THE INSERTS TYPE 1, 2 AND 3. ... 195
FIG. 183: EXPERIMENTAL CURVES OF A) THE SHEAR TESTING OF THE HONEYCOMB CORE, B) THE ADHESIVE USED TO FABRICATE THE POTTING. ... 196
FIG. 184: A) SIZE OF THE FASTENER, B) SET-UP FOR THE PERFORMED PULL-OUT TESTS [19]. ... 197
FIG. 185: EXPERIMENTAL CURVES OF THE PULL-OUT TEST OF THE INSERTS TYPE 1 [19]. ... 197
FIG. 186: DAMAGE SCENARIO OF THE INSERTS TYPE 1 [19]. ... 198
FIG. 187: EXPERIMENTAL CURVES OF THE PULL-OUT TEST OF THE INSERTS TYPE 2 [19]. ... 199
FIG. 188: DAMAGE SCENARIO OF THE INSERTS TYPE 2 [19]. ... 199
FIG. 189: EXPERIMENTAL CURVES OF THE PULL-OUT TEST OF THE INSERTS TYPE 3 [19]. ... 200
FIG. 190: DAMAGE SCENARIO OF THE INSERTS TYPE 3 [19]. ... 200
FIG. 191: 1. TRAPPED AIR IN THE CELLS, 2. INSERT WAS NOT BONDED 3. THE INSERT IS IRREGULAR ... 201
FIG. 192: THE DIAL BORE GAUGE COULD HAVE BEEN POORLY POSITIONED, ALSO THE TOOL USED TO PULL-OUT THE INSERTS AUTHORIZED SMALL ROTATIONS. ... 202
FIG. 193: THE INSERT STIFFNESS SHOULD BE GIVEN MOSTLY BY THE CORE SHEAR DEFORMATION. ... 202
FIG. 194: RANGE OF MINIMAL AND MAXIMAL STIFFNESS ACCORDING TO THE ESA REAL POTTING RADIUS FORMULATIONS. ... 203
FIG. 195: EXPERIMENTAL CURVES OF BUNYAWANICHAKUL WITH THE FIXED DISPLACEMENT, NOW THE VALUES ARE SET TO BE IN AN ACCURATE STIFFNESS RANGE. ... 204
FIG. 196: COMPARISON OF THE EXPERIMENTAL, ANALYTICAL AND NUMERICAL STIFFNESS OF THE INSERTS TYPE 2. ... 205
FIG. 197: COMPARISON OF THE EXPERIMENTAL, ANALYTICAL AND NUMERICAL STIFFNESS OF THE INSERTS TYPE 2. ... 205
FIG. 198: COMPARISON OF THE EXPERIMENTAL AND ANALYTICAL STIFFNESS OF INSERTS TYPE 3. ... 206
FIG. 199: LOADING CURVES OF INSERTS TYPE 3 WITH THE MODIFIED DISPLACEMENT... 206
FIG. 200: A) THE CORE NEAR TO THE INSERT IS DIVIDED INTO A DIFFERENT SECTION BECAUSE ITS BEHAVIOR IS DIFFERENT, B) THE FASTENER GEOMETRY IS SIMPLIFIED. ... 207
FIG. 201: REDUCED F.E. MODELS OF INSERTS TYPE 1,2 AND 3. ... 207
FIG. 202: COMPARISON OF THE EXPERIMENTAL, ANALYTICAL AND NUMERICAL STIFFNESS OF THE INSERTS TYPE 1. ... 208
FIG. 203: THE SHEAR BEHAVIOR MEASURED BY BUNYAWANICHAKUL IS VALID UNTIL THE CELLS STARTS TO FOLD, THEREFORE SEMI-EXPERIMENTAL CURVES WERE PROPOSED TO MIMIC THE ACTUAL BEHAVIOR. ... 209
FIG. 204: BEHAVIOR LAW IMPLEMENTED TO CONSIDER ONLY THE INITIAL BUCKLING OF THE CELLS. ... 210
FIG. 205: BEHAVIOR LAW IMPLEMENTED TO CONSIDER THE INITIAL BUCKLING OF THE CELLS AND THE COLLAPSE. ... 210
FIG. 206: SHEAR BEHAVIOR OF THE HONEYCOMB WHEN THE POTTING BORDERS ARE IRREGULAR, CAUSING A PREMATURE COLLAPSE OF THE CELLS WITH NO INCREASE IN THE SHEAR STRENGTH... 211
FIG. 207: SHEAR BEHAVIOR OF THE HONEYCOMB WHEN THE POTTING BORDERS ARE IRREGULAR, CAUSING A PREMATURE COLLAPSE OF THE CELLS WITH INCREASE IN THE SHEAR STRENGTH. ... 211
FIG. 208: COMPARISON OF THE EXPERIMENTAL AND NUMERICAL RESULTS, THE BUCKLING OF THE CELLS IS COINCIDENT WITH THE ALLOWABLE LOAD ACCORDING TO BUNYAWANICHAKUL IN REF. [19]. ... 211
FIG. 209: COMPARISON OF THE EXPERIMENTAL AND NUMERICAL RESULTS; THE POINT WHERE THE CELLS START TO COLLAPSE SHOULD BE THE ELASTIC LIMIT THE INSERT. [19]. ... 212
FIG. 210: CONSIDERING THE EFFECT OF THE IRREGULAR BORDERS IN THE HONEYCOMB CORE. ... 213
FIG. 211: COMPARISON OF THE EXPERIMENTAL AND NUMERICAL RESULTS CONSIDERING THE LATERAL STABILIZATION EFFECT ON THE CELLS SURROUNDING THE INSERT. ... 214
FIG. 212: SKIN’S SHEAR BEHAVIOR LAWS. ... 215
FIG. 213: THE INCLUSION OF THE SKIN DAMAGE ALLOWS A BETTER AGREEMENT WITH THE EXPERIMENTAL RESULTS. ... 215
FIG. 214: BEHAVIOR LAWS THAT DESCRIBES THE POTTING BEHAVIOR UNDER TENSION AND COMPRESSION. 216 FIG. 215: COMPARISON OF THE EXPERIMENTAL AND NUMERICAL RESULTS CONSIDERING THE POTTING FAILURE WHEN IS FIRMLY BONDED: TRACTION DAMAGE OF THE POTTING. ... 217
FIG. 216: COMPARISON OF THE NUMERICAL LOADING CURVES WHEN THE FASTENER IS NOT BONDED. ... 217
FIG. 217: COMPARISON OF NUMERICAL BEST AND WORST CASES AND THE EXPERIMENTAL RESULTS (TYPE 1), SEE ALSO FIG. 219. ... 218
FIG. 218: THE COMPARISON OF THE EXPERIMENTAL AND NUMERICAL FAILURE SCENARIO SHOWS A GOOD AGREEMENT. ... 219
FIG. 219: DIFFERENT FAILURES IN THE SIMULATION OF THE BEST CASE OF THE INSERT TYPE 1. ... 219
FIG. 220: COMPARISON OF NUMERICAL BEST AND WORST CASES AND THE EXPERIMENTAL RESULTS (TYPE 2). ... 220
FIG. 221: COMPARISON OF NUMERICAL AVERAGE CASE AND THE EXPERIMENTAL RESULTS (TYPE 3). ... 221
FIG. 222: DESCRIPTION OF THE SECTIONS CONTAINED IN THE PYTHON SCRIPT OF THE INSERT. ... 221
FIG. 223: DESCRIPTION OF THE MODEL GEOMETRY AND PARAMETERS. ... 222
FIG. 224: DESCRIPTION OF THE SUPPORT, DESCRIPTION OF THE MESHING PARAMETERS USED FOR THE MODEL. ... 222
FIG. 225: EXAMPLE OF A FAILURE MODE MAP FOR SANDWICH STRUCTURES [104]. ... 225
FIG. 226: FAILURE OF THE SKINS, POTTING AND HONEYCOMB CORE; INSERT FAILURE LOAD VS THE REAL POTTING RADIUS. ... 228
FIG. 227: FAILURE OF THE SKINS, POTTING AND HONEYCOMB CORE; INSERT FAILURE LOAD VS POTTING TRACTION’S RESISTANCE. ... 229
FIG. 228: DIFFERENT INSERT FAILURE MODES VS THE THICKNESS OF THE SKINS. ... 230
FIG. 229: FAILURE SURFACES OF THE CORE, THE POTTING AND THE SKINS: RPR VS POTTING TRACTION STRENGTH... 231
FIG. 230: BOTTOM VIEW OF THE SURFACES: FAILURE MODE MAP OF INSERTS ... 232
FIG. 231: FAILURE MODE MAP OF INSERTS AND FAILURE LOAD. ... 232
FIG. 232: FAILURE SURFACES OF THE CORE, THE POTTING AND THE SKINS: SKIN THICKNESS VS RPR. ... 233
FIG. 233: FAILURE MODE MAP, SKIN THICKNESS VS RPR. ... 234
FIG. 234: FAILURE MODE MAP, SKIN THICKNESS VS RPR AND STRENGTH IN COLOR SCALE. ... 234
FIG. 235: POTTING MAS AND STRENGTH TO MASS RATIO VS REAL POTTING RADIUS... 235
FIG. 236: POTTING MASS AND INSERT STRENGTH TO MASS RATIO VS POTTING TRACTION STRENGTH. ... 236
FIG. 237: OPTIMIZATION CHART FOR THE INSERT MASS. ... 237
FIG. 238: CALCULATION OF THE LINEAR LIMIT OF THE VIRTUAL TESTING LOADING CURVES: ALGORITHM AND EXAMPLE... 238
1
Chapter one: General
introduction
The purpose of this chapter is to present an introduction to the context and problems on which this thesis is developed. This starts from a review of the most common applications of sandwich panels to some issues of the inserts sizing methods.
1.1 FROM AIRCRAFT TO INSERTS ... 3
1.1.1 The sandwich structure ... 3
1.1.2 Sandwich panels joints; a problem still to be investigated ... 5
1.1.3 Remarks on the insert design methods ... 7
1.1.4 Objectives of the thesis ... 8
3
1.1 From aircraft to inserts
Since the 1960’s composites are being used for aeronautic applications. Mostly because they allow to reduce the weight of mechanical parts, the maintenance costs, the energy consumption, and in consequence, increasing the overall performance of aircraft.
The first commercial airplane of Airbus, the A300B4-200 for 266 passengers was fabricated in 1974 and had about 5% of its overall weight made of composites, weighed about 90 tons empty and its maximal landing load capability was of 126 tons for an effective load capacity of around 36 tons. In comparison, the new Boeing 787-8 (Fig. 1) or Airbus A350-800, can carry up to 300 passengers, has 50% of its respective overall weight in composites, weighs about 100 tons and has a maximal landing load capability of 190 tons for a maximal effective load capability of about 86 tons (up to 280 % more than the A300).
To keep improving the economic efficiency, composites are more and more used. However, there are some parts that can’t be made of composites because of the local temperature or safety considerations, like the supports for the engines made of Marval steel or Inconel (nickel alloy) for some edges of the wings. The parts that were possible to replace with composites have already been replaced, like the fuselage or the wing box. Nowadays, the efforts are concentrated into optimizing costs because of the increasing demand for airplanes.
Fig. 1: Structural usage of composites in the Boeing 787.[16], [17].
The most common type of composite used for civil aircraft is Carbon Fiber Reinforced Polymer (CFRP) laminates with a majority of UD plies. For instance, the fuselage is almost entirely made of them (see Fig. 1). For this reason, most of the efforts of the composites community have been focused on these materials.
Other composites used for aircraft construction are sandwich panels with CFRP skins. Thanks to their high bending stiffness/weight ratio, these panels are ideal to design very lightweight structures, for aircraft control surfaces and helicopter primary structures for instance.
1.1.1 The sandwich structure
The sandwich structure consists of three main elements: two thin, stiff, and strong faces or skins and a thick, light, and weak core. The faces are adhesively bonded to the core to transfer the loads. Their working principle is simple: a thick core separates and maintains a certain distance between the skins, increasing the inertia and consequently the bending stiffness (see Fig. 2). Thus, they offer significantly higher bending and buckling stiffness compared to heavier laminates sheets.
Secondary functions of skins are to protect the core from the environment (avoid degradation, corrosion and moisture ingression), against low energy impacts and stabilize the core. Depending on the core material, it can be used for multifunctional purposes like increasing thermal or acoustic isolation, dynamic damping, furtive applications, active control, etc. Concerning the core, there are many types. The three main families are foam, cellular materials like honeycomb and balsa wood.
Because of their properties, these panels are used in many different fields, for example to build roofs or bridges in civil construction, for helicopters, aircraft or satellites in the aeronautic and aerospace domain, for thermal and acoustic isolation in the automotive sector, among many, many other applications.
Fig. 2: General description of a sandwich structure.
The idea to introduce these superlight panels for aeronautical applications comes from the middle 10’, however it was not until the 1930’s that their use was widespread accepted [5]. For aeronautical panels, the most used type of sandwich is made with CFRP skins with Nomex® honeycomb core. The advantages that these sandwich structures offer are enormous compared to similar structures. Face to skin stiffener panels sandwiches are sometimes preferred in helicopters, general aviation up to business aircraft. Also, compared to the traditional metallic skin-stringer construction they offer big advantages allowing to reduce the number of parts by 85%, the cost by 90% and 50% on the fabrication time [18], [19].
In the late 80’s Beechcraft developed the Starship, which was a business aircraft with 72% of its structural weight of composites, mostly CRFP sandwiches with Nomex® honeycomb core. Unfortunately, only 53 were fabricated and even less were sold. For this reason, Beechcraft determined that it was more profitable to re-buy the sold aircraft to destroy them rather than to keep providing the maintenance for the model. But all the acquired knowledge from the Starship design was used to design its successor, the Raytheon Premier I which is still in production today.
5 These sandwich panels are so efficient that they are used to build almost all the main body of helicopter structures. This is the case for the Airbus NH90, the Sikorsky Black Hawk (front panels and doors), or the Eurocopter Tiger, on which the structure represents about 10% of the total weight (the remaining 90% is for the engine, pales, electronics, etc.).
The use of these panels has been extended even for spatial applications like satellites, spatial shuttles and launching systems. These panels are ideal for such structures because they are very stiff and light at the same time, which is very important since it is very expensive to send something to space. The cost to deploy a satellite ranges between 2000 and 31000 US$ per kg depending on size and weight, which can be around several hundreds of kilograms. Even the smallest reduction of weight could lead to a big reduction of the launching cost [20]–[22].
In naval construction, they are used from competition to defense boats. In some cases their applications reduce the water drafts and increase the resistance against intense fatigue loadings [23].
Fig. 4: Radar absorbing sandwich panels were used to build Zumwalt-class destroyer [24]. Some other interesting characteristics can be integrated into the sandwich design. In 1997 sandwich panels were used to construct an enclosure for the communication systems (the Advanced Enclosed Mast/Sensor) of the USS Arthur W. Radford, a Spruance-class destroyer of the United States Navy. They were used as a multi-functional design that helped to reduce maintenance cost of the sensors, reduce the height of the communication structure and to create stealth properties. This was accomplished by embedding radar absorbing materials in the core of the panels, a similar technology is also used for the Zumwalt-class destroyer (see Fig. 4) [24].
1.1.2 Sandwich panels joints; a problem still to be investigated
Despite the great advantages of sandwich structures, they are restricted to secondary structures of commercial aircraft such as doors in general, cabin interiors and control surfaces like ailerons, spoilers, etc. (see Fig. 5) [5], [7].
The reason is simply because the design is more complex and it is difficult to ensure the quality requirements. Therefore, these panels may not be properly designed for all the in-service conditions of these aircraft.
Even if there have been big efforts to study them [6], they are not well mastered in terms of the materials used for their fabrication, manufacturing process, fatigue, damage growth, debonding of the parts, their several failure modes, assembly, impacts, etc.
As proof of this, there are investigations indicating that the Boeing 767 flies with up to 40.4 Kg of water stocked in their sandwich panels [7]. This was apparently caused by the loss
of the sealing capabilities of the panel due to the sandwich fabrication defects and the fatigue on the joints. This is a common problem of helicopters too since they are structurally made of sandwich panels [25].
Fig. 5: Use of sandwich panels on the Boeing 767 [7]
More specifically, the assembly of a sandwich structure must accomplish some service functions; ensure the forces transmission, do not reduce the mechanical resistance of the panel, allows a precise alignment of the parts, be inexpensive and ensure the sealing of the inside of the panel.
In most cases, to avoid exposing the core to concentrated loads, the joining is made through the skins. This is very simple and easy to do, although the load capabilities are directly limited by the mechanical properties of the adhesive (see Fig. 6). This technique is very widespread for cabins of commercial aircraft although it is not the most common.
Fig. 6: Different techniques to join panels: directly bonding them, adding reinforcements or densifying corners of the core to increase its mechanical properties. [22]
Another technique consists of reinforcing the core so it can resist concentrated loads caused by the assembly. These reinforcements are called inserts. These joints can be divided in two types: high-load and low load carrying inserts.
An insert is often a densification of the core that arises the local mechanical properties, providing the panel with an area where a junction can be installed. Inserts distribute the concentrated forces in a way that the core and the skins can support them. This type of assembly is by far the most used in sandwich structures. Indeed, its principle and installation are simple most of the time handmade, which guarantees low costs (see Fig. 7).
Nevertheless, there are some fabrication defects that can’t be avoided in the insert installation, like their irregular shape due to honeycomb geometry or the presence of air bubbles. This is relevant because inserts must be designed to support a desired load. Nevertheless, due to the complexity of the problem, the calculation process involves the simplification of several aspects like the geometry or the materials, that in consequence reduces the accuracy of the design methods.
7 Fig. 7: High load insert on the landing gear door of the Airbus A330
1.1.3 Remarks on the insert design methods
In general, inserts are designed according to the design requirements of the sandwich panel. This means that there are several types of inserts for different situations, but in general they are selected depending on the load capability. For panels that require the use of bolts to be assembled, most of the time a metallic fastener is installed into the insert so it can provide a metallic surface and the thread for the bolt.
However, the size and materials used for the insert must be chosen according to the assembly requirements and thus a design process is necessary. To make the good choice of parameters, there are a few bibliographical references that give the main guidelines for the insert design; like the Insert Design handbook of the ESA [1], or the Military handbook 23A [2] of the Department of Defense of the United States. According to these documents, the insert size must be proportional to loading requirement and is calculated by means of an analytical approach based on the formulations developed by a researcher named Ericksen [3], of the Forest Products Laboratory in 1953.
Even so, at the end, inserts are tested to determine experimentally their actual strength, although the existing experimental failure criteria for inserts may be too simplistic, i.e. when a reduction of more than 5 % on the slope is reached, or a sudden drop in the force vs displacement curve is found, an irreversible damage has occurred and the insert fails causing what is called a structural rupture.
If the sizing method doesn’t provide calibrated strength values, the design and testing process requires more iterations and hence everything is slowed down, costing resources, time and money.
But also, the simplistic experimental failure criteria for inserts is not based on the understanding of the failure causes of the inserts, therefore, even if there is a reduction of 5% on the slope of the loading curve, the insert may remain undamaged after all.
However, there is an alternative method, based on the recent development of computing technology that allows a more precise analysis; the finite element analysis (F.E.A.). This approach is strongly suggested by Zenkert [5] for the insert design. This is proposed because of the unique and complex conditions that surround the insert for every application. Yet, this may not be very easy to do because it requires time and expertise, making it not very affordable for every situation.
If both approaches are compared, the analytical approach is easier to implement compared to the F.E.A. Also, companies prefer to neglect or absorb the overweight of inserts in the panel, instead of spending valuable resources just to save a few grams of weight. They use the analytical method for insert design because it is cheaper to ignore this overweight problem than to solve it. And thus, the analytical approach for insert design remains today as the most used method for the industry.
Even though it’s true that the extra weight of a few grams per insert doesn’t represent a significant problem for helicopters or planes where they are used to assembly just a few electronics panel racks or hydraulic systems, it does represent a major problem for spatial applications. This is because satellites may have up to 25,000 inserts [26].This means that an overweight of only 1 gram per insert can lead to an extra cost of about 75,000 dollars. So if this overweight is avoided the savings can be huge [27].
1.1.4 Objectives of the thesis
Following the methods recommended by the ESA or the Military Handbook 23-A may be slow, expensive and in the end, it may result in oversized inserts.
The aim of this research is to create another alternative for the insert design. This new approach should provide more accurate predictions than the analytical approaches but also should be easier and quicker to implement in comparison with the detailed modeling using the F.E. method.
All in all, our approach consists of the creation of failure mode maps of inserts based on simplified but accurate virtual tests by means of F.E. simulations.
This is very practical because charts are known to be very useful to represent complex phenomena in a very compact and simple form, and this is the case for the insert strength prediction. This type of tool may be very valuable for engineers as it will allow reducing costs on the embodiment design and validation stages.
Also, the F.E.A. is a powerful tool that allows obtaining very accurate predictions of the mechanical behavior of complex structures, still, the main disadvantage is the development time. But if the insert F.E. model is simplified and parametrized in a proper way, it may be suitable to perform virtual tests on any type of insert in a short time.
In practice the most common type of loading is the pull-out, which induces principally a shear buckling of the core that results in a nonlinear response of the insert as was demonstrated in a previous PhD in the laboratory (see ref. [15]). This aspect is interesting because initially we thought that the shear postbuckling behavior of the core can be elastic, and thus the insert strength might be underestimated. For this reason, our principal objective is to improve the understanding of the non-linear behavior of the insert, this includes:
Study individually the nonlinear behavior of the skins, the honeycomb core and the potting.
9 Secondly, we want to understand what causes the oversizing of inserts but also propose a way to avoid it. This includes:
Study of the accuracy of the analytical methods
Study the influence of the interaction between the parts of the insert. Study the influence of defects on the insert behavior.
And finally, we want to develop a more efficient and accurate tool for the insert sizing that can replace the analytical approaches. This includes:
Development of a reduced F.E. model.
Development of charts of force vs geometry for the insert design.
1.1.5 Summary of the thesis
This research is divided in 5 chapters that cover different aspects involved in the inserts design:
This first chapter is a global introduction that explain the context and motivations of this research.
The second chapter is about the state of the art of knowledge of inserts in sandwich structures and Nomex® honeycomb cores.
The third chapter is focused on the buckling analysis of honeycomb cores subjected to shear loads.
In the fourth chapter a study about the mechanical properties of syntactic polymer foams for inserts is presented.
In the fifth chapter, all the developments of the previous chapters are integrated in the development of a virtual insert model, which is presented and validated experimentally. Also, in this last chapter, the failure mode maps for inserts are developed using the developed insert model.
This thesis can be presented as a pyramid (see Fig. 8), on which the base is the experimental and numerical analysis of the materials that compose the sandwich and inserts. The second part is the analysis of the interactions between the materials. Finally, the tip of the pyramid consists of applying all the acquired knowledge to present an innovative approach for the insert sizing.
11
Chapter two: State of the art of
inserts for sandwich structures
This chapter is a literature review of inserts for sandwich structures. First, the technical aspects of inserts are introduced including types and test standards. Then, a literature review of the experimental tests and the most common sizing methods for inserts is presented. The presented evidence indicates that investigating the honeycomb core shear buckling is necessary, and a section is dedicated to this subject. Finally, the conclusions are presented.
2.1 INSERTS FOR SANDWICH STRUCTURES ... 13
2.1.1 Types ... 13 2.1.2 Testing standards ... 17 2.1.3 Pull-out experimental testing of inserts ... 18 2.1.4 Strength prediction of inserts by analytical approaches ... 31 2.1.5 Strength prediction of inserts by numerical approaches ... 45 2.1.6 Conclusions of the state of the art of insert analysis ... 52
2.2 SHEAR BUCKLING OF NOMEX® HONEYCOMB CORES ... 55
2.2.1 The honeycomb structure ... 55 2.2.2 Properties of the Nomex® paper ... 57 2.2.3 Shear testing of honeycomb cores ... 59 2.2.4 On the shear behavior of honeycomb cores. ... 61 2.2.5 Conclusions on the honeycomb’s shear buckling ... 65
13
2.1 Inserts for sandwich structures
The pull-out inserts strength in sandwich structures has been investigated by several researchers (see for example ref. [4], [28]–[41]). The experimental evidence shows that there are different failure scenarios depending on the insert geometry and components, also, the order of appearance of the failure modes is very important.
Moreover, the experimental tests show that the insert strength is principally related to the shear strength of the core. For this reason, some calculation methods have been developed to estimate the insert strength as function of the core shear resistance [3], [37].
All these aspects are presented in this section, starting by general aspects of inserts such as type and testing standards, followed by insert pull-out experimental tests and sizing methods, and finally a review on the honeycomb cores.
2.1.1 Types
Inserts have been studied since sandwich panels became popular for weight reduction applications. As there are many different uses for panels, the inserts have been designed accordingly. As result, they are made in several geometries, materials, for different load conditions, etc. Some of the most characteristic are shown in Fig. 9.
Fig. 9: Several types of sandwich joints [35].
The inserts a), b), c), e) and h) allows to put a bolt all along through the sandwich panel, to avoid the crushing of the sandwich the core is reinforced by different type of densifications. When a hole through the sandwich panel is undesirable, concepts like d), f), and g), can be used, the core is reinforced too, most of the cases with potting. Also, a fastener is used to provide the thread for the bolt. When the panel must remain intact a concept like g) can be used.
Concerning the fasteners, there are several, the more characteristics are shown in Fig. 10. They are commonly made of aluminum 2024 alloy. They can be divided by their installation procedure: the molded-in type and the mechanical type.
The molded in fastener is installed, fixed and retained by encapsulating it within the potting. The mechanical fastener is generally used for metallic panels, its principal characteristic is to be installed by compressing and capturing the face skins.
Fig. 10: Comparison of the Shur-lok fastener applications [42].
Meanwhile, inserts can be classified in different ways. One way to do this is by its shape, as proposed by Zenkert [5]. They are: Self-taping screws and rivets, flared cylinder (top hat), partial inserts and finally, through the thickness inserts. A qualitative comparison of the loads bearing for each insert is given in Table 1.
2.1.1.1 Self-taping screws and rivets
The screw and rivet can be classified as low-load carrying inserts. Their installation is very simple, a hole is made in one of the panel faces and then the rivet is placed, an adhesive can be used to increase the strength. They’re used to attach light equipment to panel, like cabin safety equipment or shelves, although not used for aeronautical applications [15]. They’re made to be used with thick face panels. Even if their mechanical resistance is not very high, they’re inexpensive and the installation is very simple. The pullout, torsional and momentum forces are supported by the thread of the rivet and the skins or potting, thus the transverse and in plane strengths are relatively low, but the moment strength can be high.
Table 1: Comparison chart of performances given by Zenkert [5].
2.1.1.2 Flared inserts (top hat)
This insert type is recommended for metallic panels. Is stronger than the previously mentioned screws and rivets. Also, its installation is simple: A hole through the panel is made, then, an adhesive is placed under the neck of the fastener and pressed to the panel as shown in Fig. 11. In this way, the insert is (if desired) not bonded to the core, avoiding damaging it, although the insert strength decreases.
Due to its installation process, there are some disadvantages too. Its strength relies on the adhesive for transferring forces and moments, its installation deforms and may damage the skins in the closing procedure (skins may be damaged too) and a big stress-concentration is created at the base of the flared top.
15 Fig. 11: a) Force distribution of a screw b) mechanical fastener before installation c) installed
mechanical fastener [5], [15], [43].
2.1.1.3 Full potting, partial or blind inserts
This type is stronger than the one mentioned before. When the potting is bonded to both skins, it’s called full potting insert, when is bonded only to one skin is called partial insert (although this is not recommended by the ESA)[37].
It is used when the requirements don’t allow to drill both skins, for electronic racks attachment, cabin safety equipment, structural attachment to walls, shelves and fluid pipes in primary sandwich structures for helicopters. But there are more interesting cases like naval applications and for some special technologies in aircraft like stealth, that do not allow to perforate both sides of the panel. The installation process is all handmade and thus delicate and expensive. There are several ways of installing a partial insert, one is: drilling a hole through the panel (carefully), remove the core around where the insert will be placed (without damaging the skins), fill partially the hole with potting, place the fastener in to the resin and alginate it with the skins (using an installation tab), finally, fill the rest of the hole with potting (air bubbles must be avoided) and then curing or polymerizing the potting at room temperature (Fig. 12).
The performance of this insert can be increased by installing it under vacuum to avoid air bubbles [44] or by using different types of potting [35], different adhesives, or micro-spheres among other agents.
Fig. 12: Partial insert installation procedure [39].
This insert type is the most commonly studied. The force transfer is made through a bolt and the fastener installed in the insert. The interface between the fastener and the panel is made by the potting to bond the fastener and assure optimal contact (see Fig. 13).
![Fig. 13: Cut of a) a full potting insert, the potting is bonded to both skins b) partial insert, bonded to only one skin [28]](https://thumb-eu.123doks.com/thumbv2/123doknet/8263817.278231/33.892.248.644.72.369/potting-insert-potting-bonded-skins-partial-insert-bonded.webp)
![Fig. 15: Test standards of a) Shear testing, b) Pull-out test, c) Torque test, [35], [46]](https://thumb-eu.123doks.com/thumbv2/123doknet/8263817.278231/35.892.110.784.387.927/fig-test-standards-shear-testing-pull-test-torque.webp)
![Fig. 35: Approach description and shear stress distribution in function of the radius and sandwich parameters [2], [15]](https://thumb-eu.123doks.com/thumbv2/123doknet/8263817.278231/55.892.115.803.80.375/approach-description-stress-distribution-function-radius-sandwich-parameters.webp)
![Fig. 46: Comparison of the analytical model vs the F.E. calculation of the shear stress in the core [32]](https://thumb-eu.123doks.com/thumbv2/123doknet/8263817.278231/67.892.197.693.759.1091/fig-comparison-analytical-model-calculation-shear-stress-core.webp)
![Table 6: Mechanical properties of the Nomex® paper T412 according to Seemann [12].](https://thumb-eu.123doks.com/thumbv2/123doknet/8263817.278231/74.892.224.671.71.524/table-mechanical-properties-nomex-paper-t-according-seemann.webp)
![Fig. 61:Impact modeling of a Nomex® honeycomb sandwich panel; numerical vs experimental results [78]](https://thumb-eu.123doks.com/thumbv2/123doknet/8263817.278231/81.892.170.728.68.641/impact-modeling-nomex-honeycomb-sandwich-numerical-experimental-results.webp)