OATAO is an open access repository that collects the work of Toulouse
researchers and makes it freely available over the web where possible
Any correspondence concerning this service should be sent
to the repository administrator:
[email protected]
This is a
publisher’s version published in:
https://oatao.univ-toulouse.fr/27203
To cite this version:
Kazi Tani, Hycham Abdesslam and Bouanani, Abderrazak and
Baba-HamedKamila, Kamila and Probst, Jean-Luc The Dynamics of
Suspended Particulate Matter in the Oued Nachef (Tafna Basin,
Algeria): Typology of Flood Events and Contribution to Sediment
Transport. (2020) Journal of Geological Resource and Engineering,
8. 145-160. ISSN 2328-2193
Open Archive Toulouse Archive Ouverte
Official URL :
Journal of Geological Resource and Engineering 8 (2020) 145-160 doi:10.17265/2328-2193/2020.05.002
The Dynamics of Suspended Particulate Matter in the
Oued Nachef (Tafna Basin, Algeria): Typology of Flood
Events and Contribution to Sediment Transport
Kazi Tani Hycham Abdesslam1, Bouanani Abderrazak2, Baba-Hamed Kamila2 and Probst Jean-Luc.3
1. Laboratory N° 25, Dpt. Hydraulic, Institute of Science and Technology, Maghnia University Center, 13300, Maghnia, Algeria 2. Laboratory N° 25, Dpt. Hydraulic, Faculty of Technology, University Abou Bakr Belkaid, 13300, Tlemcen, Algeria
3. Laboratory of Functional Ecology and Environment, University of Toulouse, CNRS, Toulouse INP, University Toulouse 3-Paul Sabatier (UPS), Toulouse 31062, France
Abstract: This article focuses on the study of sediment transport during flood events in the Oued Nachef watershed that feeds the Mefrouche dam. To understand the sediment dynamics in this watershed, ANRH data on instantaneous water discharges and the respective concentrations of suspended particulate matter were used. This enabled the selection of some of the largest flood events over a 24-year period in order to establish the log-log relationships between sediment load (concentration and flux) and water discharge. However, the discharge-concentration relationships revealed hysteresis phenomena that enabled a flood typology to be established and classified into seven categories, thus showing very different transfer dynamics in relation to flood events. The results showed that Category 6 floods presenting hysteresis in the form of a figure of eight exported almost 44% of the suspended particulate matter load while representing just 29% of the flow discharge.
Key words: Algeria, Oued Nachef, suspended sediment transport, flood, hysteresis, typology.
1. Introduction
In semi-arid zones characterised by very irregular and often intense rainfall, climatic factors have considerable influence on the removal of particles from the ground and in fine on mechanical soil erosion. These particles are transported to wadis primarily by surface runoff. They can then be deposited temporarily along the course of the wadi or as sediment behind the barrages and dams, causing them to silt up. Some of these eroded soil particles will reach the Mediterranean Sea, accompanied by various pollutants that are adsorbed or complexed by the suspended particulate matter, thus contributing to the pollution of coastal areas. Research undertaken on mechanical soil erosion and sediment transport in
Corresponding author: Kazi Tani H. A., PhD, associate professor, research field: surface hydrology.
Probst J.L., PhD, CNRS research director, research field: hydrology and biogeochemistry.
rivers shows that the specific erosion of the Maghrebs watersheds is significant, ranging from 1,000 to 5,000 tonnes per km2 per year [1]. Erosion varies considerably from one basin to the next and can reach up to 7,200 t/km2/year, as in the case of the Oued Agrioun in Algeria [2]. As a consequence of this significant erosion in watersheds in Maghreb countries, the discharge of sediments carried on average every year to the Mediterranean Sea is estimated to be 100 million tonnes [2]. In these Mediterranean regions, mechanical soil erosion and the transport of sediment in rivers are mainly controlled by extreme climatic events, generally of considerable intensity and short duration, that generate significant surface runoff on watershed soils and sometimes intense flood flow in the wadis [3-13]. It is important to study these flood periods because they play a key role in terms of evaluating the export of particles and also obtaining a better understanding of
D
The Dy 146 particle tran water and th environment moments, w be understoo understandin the highly e surface wa improved un which also suspended p managed m erosion and this investig suspended s in north-wes detailed stud study was al of the flow liable to be d
2. Present
2.1 Geograp Characterist Located o Fig. 1 Geog K B W B T H d ynamics of Su nsfer process heir dynamic t. These per whose dynam od more fully ng of hot spo erodible areas ater. Further nderstanding play a key r particulate m more effective production o gation of the sediment tran stern Algeria dy of flood ev lso to contribu of sedimen deposited behation of the
aphical Loca tics on the Terni raphical locati Key: Boundray of su Water courses Border Towns Hydrometric st dams uspended Pa Flood Eve ses from the cs during tra riods therefo ics and contr y today, but a ts on a region s liable to su rmore, there of these con role in the f matter, to ensu ely in terms of fluvial sed dynamics o nsported by t , it was decid vent episodes ute to improv t exported b hind the Mefre Study Zo
ation and G plateau at a
ion of the Mefr ubstratum
tation
articulate Mat ents and Con e soil to sur ansport in a r ore represent ributions nee lso allow a b nal scale, not upply particle e needs to ntributory zo flow of expo ure that they of physical diment. Hence of the transfe the Oued Na ded to focus s. The aim of ved quantifica by this wadi rouche dam.
ne
Geomorpholog an altitude ab rouche watershter in the Oue tribution to rface river hot ed to etter tably es to be ones, orted y are soil e, in er of achef on a f this ation and gical bove 1,00 of nor Tle lati 1° R co so is 1 en 15 H ther ph wa 2.2 V sub mon rela 44-ev ov wa hed. ed Nachef (Ta Sediment Tran 00 m, the wa the large T th-western A mcen. It drai tudes 34°45 25 W. Rectangular efficient of 1. uth-west. Its m 4.25 km long ds at the Mef Hm3. The Me refore offers ysical and ge tershed are su Hydroclimat Variability in ject of seve nthly distribu ation to the year period ents in relatio er a 25-year m
tershed are ill
afna Basin, A nsport atershed of t Tafna watersh Algeria, sou ins a surface to 34°52 N in shape .37, the basi main watercou
g, has its sou frouche dam, efrouche wat very little p omorphologi ummarised i tology n the amount eral studies ution in term average i and the mon on to the tota measurement lustrated in F Algeria): Typo he Mefrouch hed (Fig. 1) uth-east of e area of 89 N and longit and with n is oriented urse, the Ou urce in Aouin the capacity tershed is a p potential for ical character n Table 1. t of rainfall in Algeria s of percent nterannual nthly percen al number of t period in t ig. 2. ology of e dam is part ) located in the city of km2 between udes 1°15 to a Gravelius north-east to ed El-Nachef, net Dejjaj and y of which is peneplain and erosion. The ristics of this
has been the [14-17]. The age of rain in mean over a tage of flood flood events he Mefrouche t n f n o s o , d s d e s e e n a d s e
The Dy Table 1 Phy Characteristic Equivalent rec Equivalent rec Compactness Basin slopeIg Drainage dens Average slope Bifurcation ra Fig. 2 Avera relation to th (1990-2014). The Mef climate zone in the month mm, i.e. 3.3 to fall. The due to the i number of maximum in average that February, th events. This the rise in but also by rainwater by rise in rainf number of f ynamics of Su ysical and geom cs ctangle length ( ctangle width (k coefficient KC (m/km) sity D (km-1) e of the waterco atio (RC) age monthly v he annual tot frouche dam e [18, 19]. Fig h of Septemb % of annual first flood ev intensity of t flood even n January at t month, and r here is a clear s phenomeno monthly tem the refilling y growing lo fall is record flood events uspended Pa Flood Eve morphological (km) km) C ourse (%) ariations in ai tal (average fo m reservoir i g. 3 shows th ber with a mo rainfall, as te vents start to the monthly r nts per mon 24%, i.e. 11 rainwater run r drop in the n is explaine mperatures (s of aquifers a ocal vegetati ed that incre to around te articulate Mat ents and Con characteristic r temperature or 1970-2010) is in asemi-hat rainfall be onthly total o emperature s occur in Oct rainfall, with nth reaching flood event noff of 79 mm number of fl ed by the star easonal chan and absorptio ion. In Marc eases the ave en. Beyond
ter in the Oue tribution to s of the waters Values 18.28 5.07 1.37 18.84 2.48 2.38 3.72 e (averages for ) and the num
-arid egins of 19 tarts ober h the g its s on m. In flood rt of nge), on of ch, a rage that, from red tem
3.
3.1 T inst sus disc Na dur hyd alt. The rati ed Nachef (Ta Sediment Tran shed. s the period 19 mber of flood m the month uces in rel mperatures riseData and M
Classificatio This study w tantaneous m pended part charge value tional Agenc ing the per drometric stat 1,134 m) loc e flow disch ng curve of w afna Basin, A nsport 70-2007), con events in rel of April, the lation to t e and the drMethods
on of Flow Ra was based on easurement o ticulate ma es (QL) me cy of Hydra riod 1990-2 tion (coordina cated upstrea harge values water levels r Algeria): Typo tributions in % lation to tota frequency o he intensity y season beginates and Conc values corr of the concen atter (SPM) asured by aulic Resourc 014 at the ates lat. 36.0 m of the Mef were obtain recorded on a ology of 147 % of rainfall in l flood events f flood events of rainfall, ns. centrations esponding to tration (C) of and flow the Algerian ces (ANRH) Sidi Hafif 9; long. 0.40; frouche dam. ned from the a limnimetric 7 n s s , o f w n ) f ; . e c
The Dy 148 scale. With water level taken on the 500 mL bott coolbox at The separat using pre-w µm. These suspended p very quickl (0.45 µm) c was then ov dried filter weight of pre-weighed before being and express concentratio during a 24-Fig. 3 concentratio interval of v the lowest c 0.01 and 10 m3/s, and b 0.01 and 0 interval red Fig. 3 Varia ynamics of Su regard to t reading a sa e bank from th
tle. The colle 4 °C, then t tion of SPM weighed filter filters rapidl particulate m ly tended tow classically use ven dried at containing SPM was d amount an g returned to sed in g/L. F on in differe -year measure shows a ons for differ
variation in categories of g/L for flow between 0.02 0.03 m3/s. T duced as the ation in SPM c uspended Pa Flood Eve the concentr ample of untr he surface of ected samples transported to was perform paper with ly became c atter and the wards the s ed to filter S 105 °C for SPM weig the differen nd the weig the volume Fig. 3 shows ent categorie ement period. wide rang rent flow rate concentration f flow rates, rates betwee and 31.64 This concen e flow rates concentration f articulate Mat ents and Con rations, for e reated water f the wadi usi s were stored o the laborat med by filtra a porosity o clogged with e filters poro tandard poro SPM. This m 30 min and hed again. ce between ght after dry of filtered w the variatio es of flow . ge of ave e categories. ns was large varying betw en 0.003 and g/L for betw tration varia increased.
for different flo
ter in the Oue tribution to each was ing a in a tory. ation f 10 h the osity osity atter d the The the ying, water n in rate rage The e for ween 0.01 ween ation This ph the wit wit run bec ther su the cate mea the line the 3.2 mea at stud ev wit stud rep The (ris ow rate catego ed Nachef (Ta Sediment Tran enomenon can slowest flow h SPM com h the fastest off and me omes predom refore tends ggested by Re world. Wit egories (bet asurements w sediments b ear erosion in riverbed. Flood Event The study of f asurement pa time ti, repre dy. These me ents over a 24 h a variable dy, 446 pa resented 45 e selection cri a distinct a e and fall); ories (averages afna Basin, A nsport n be explain w rates there i ming from di flow rates th echanical s minant and towards 1 g efs. [20-22] th regard t tween 30 were generally being transpo n the waterco Selection C flood events airs of conce esenting 1,5 easurements 4-year period duration o airs of val representativ iteria for thes and straightfo
for the perio
Algeria): Typo ed by the fa is a combinat ifferent sourc he contributio oil erosion the SPM c g/L, as has a for different o the faste and 100 y taken in t orted were ourse from t riteria was based on ntration and 40 pairs of were taken d from 1990 f T hours. In ues were s ve flood eve se flood event forward floo d 1990-2014). ology of ct that during tion of flows ces, whereas on of surface from slopes concentration already been rivers around st flow rate m3/s), the he spring and mainly due to he banks and instantaneous flow (Ci, Qi) values in this during flood to 2014 and n the present elected that ents in total. ts were: d hydrograph g s s e s n n d e e d o d s ) s d d t t . h
The Dynamics of Suspended Particulate Matter in the Oued Nachef (Tafna Basin, Algeria): Typology of Flood Events and Contribution to Sediment Transport
149
a flood peak above the average annual flow; a variation curve of SPM concentrations without null values.
3.3 Concentration-Flow Relationship
Generally, the most widely used regression between instantaneous measurements of concentrations of suspended particulate matter in relation to flow rate is the log-log model [23-25].
C = aQb (1) where parameters a and b are regression coefficients. Although the appropriateness of this approach has been debated by Ref. [26], its application appears suitable in several case studies and for different aims [27]. It is based on the transformation of values into logarithms to reduce the polarisation presented in calculations [28, 29].
Another empirical relationship, known as the curve of solid transport [30] that links sediment discharge with flow discharge has classically been used [31-36]. Its calculation offers the best adjustment and allows daily values of sediment discharge flow Qs to be evaluated from the flow discharge Q observed, and the study of flow/sediment discharge relationships and the influence of flow discharge on sediment transport over different timescales: annual, monthly and seasonal [37-44]:
Qs = aQb (2) where exponent b is a function of the physical, climatic and hydrological characteristics of the watersheds [45, 46] or the hydraulic conditions of the flow in the watercourse [21]. It generally varies between 1 and 2. Refs. [47, 48] suggest that exponent b and constant a reflect the characteristics of the watershed, whereas Ref. [49] considers that the constant represents an index of soil erodibility. 3.4 Calculation of Solid and Liquid Inputs
The suspended sediment input As is calculated by integrating the product of suspended sediment discharge over time. By considering the linear variation in sediment discharge over time, the average
sediment input for the period between times ti and ti+1 is given by the relationship:
(3) where:
As: annual solid input (t/year); Qi: flow discharge rate (m3/s);
Ci: concentration of sediments at time ti.
The arithmetic total of the basic sediment inputs for a given period (month, season, year or flood) provides the sediment input for this period. The specific tonnage or specific input expressed in t/km2/year is obtained by dividing the total annual input by the surface area of the watershed.
Similarly, the corresponding liquid input AL expressed in m3 is given by the relationship:
(4)
3.5 Hysteresis
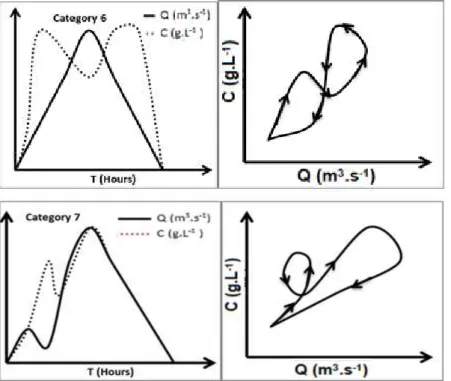
The study of sediment transport by event can allow the origin of the transported sediments to be determined by analysing the relationships between SPM concentration and flow discharge, notably when these relationships form hystereses. The analysis of this hysteresis is considered an interesting approach towards acquiring a better understanding of SPM dynamics in a watershed. Most research is currently based on the study of hysteresis loops to identify the different sources of sediments in a watershed [50-56]. It is therefore possible to distinguish between different forms of hysteresis, which can be grouped into seven categories (Fig. 4):
Category 1: linear form where the rise of the curve is parallel to the descent of the curve;
Category 2: open loop with a chronology of sampling points going in a clockwise direction (dextral hysteresis) from the start to the end of the loop, maximum C in SPM comes before maximum Q;
The Dy
150 ynamics of Suuspended Pa Flood Eve
articulate Mat ents and Con
ter in the Oue tribution to
ed Nachef (Ta Sediment Tran
afna Basin, A nsport
The Dynamics of Suspended Particulate Matter in the Oued Nachef (Tafna Basin, Algeria): Typology of Flood Events and Contribution to Sediment Transport
151
Fig. 4 Different categories of hysteresis in relationships between SPM concentration and flow discharge.
Fig. 5 Relationships between concentration-flow discharge (left) and sediment-flow discharge (right) for the period 1990 to 2014.
Category 3: open loop going in an anti-clockwise direction (sinistral hysteresis), maximum Q comes before maximum C;
Category 4: closed loop going in a clockwise direction (dextral);
Category 5: hysteresis in a figure of eight, but remaining open;
Category 6: closed figure of eight;
Category 7: complex form where the rise of the curve comprises a knot in a clockwise direction (dextral).
4. Results and Discussions
4.1 Concentration-Flow Discharge and Sediment-Flow Discharge Relationships
After extracting the instantaneous values of C and Q, sediment discharges can be calculated and the log-log type relationships between C and Q and between Qs and Q established (Fig. 5). The log-log model frequently used then allows parameters a and b to be determined that are specific for each watershed and
The Dynamics of Suspended Particulate Matter in the Oued Nachef (Tafna Basin, Algeria): Typology of Flood Events and Contribution to Sediment Transport
152
watercourse, and gaps filled when there are no measurements by simulating the missing values.
The C-Q regression presented a weak correlation coefficient (R = 0.47) for a distribution showing a greater spread of points for average values. These points coincided with flow discharge below 0.8 m3/s and sediment discharge above 1 g/L, values that corresponded to autumn flood events (easily mobilisable sediment). This coefficient increased when a regression was performed for the values of each flood event category (Table 2).
The Qs-Q relationship however revealed a better correlation coefficient (R = 0.95) for the same number of points.
The coefficient was almost identical for the two relationships while parameter b was very different: 0.304 for the C-Q relationship and 1.27 for the Qs-Q relationship.
The evaluation of the models achieved in hydrology was crucial. The root mean square error (RMSE) was then performed to give a value ranging from 0 to + , with the optimum of this value being the minimum:
(5) Ci: value of the concentration observed (g/L); C’: value of the concentration calculated by the model (g/L);
N: sample size.
For the C-Q regression, the RMSE gave a value of 1.21 while the Qs-Q regression was 2.1. These values were reliable and significant. Table 2 shows the
different C-Q regressions for each flood category. It can be seen that the correlation coefficients for the different categories varied between 0.38 and 0.62. They were close to that of the regression R = 0.58 for all floods. The RMSE values varied from 0.33 to 2.45. 4.2 Study of Flood Events
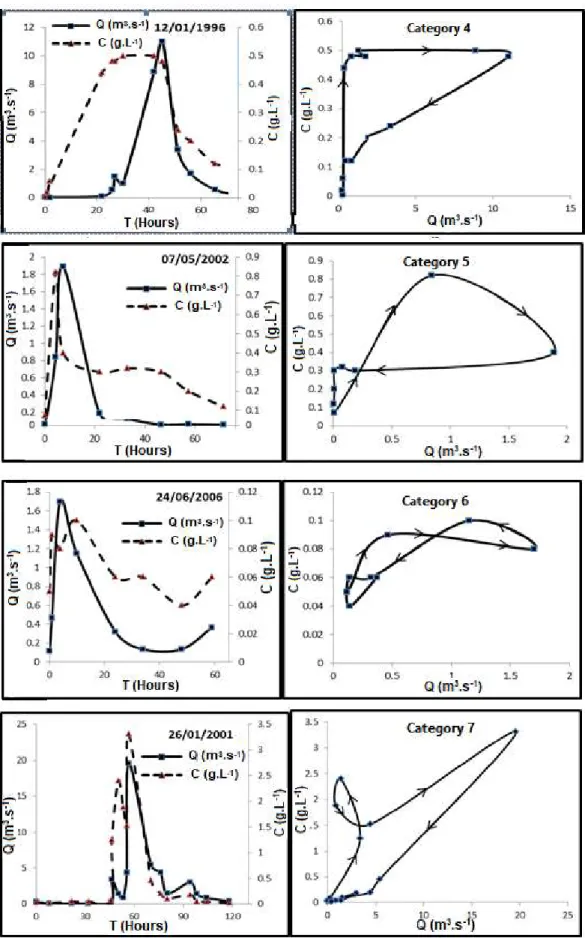
The term flood event refers to a complete hydrological event with a rise and fall in water level. Of the 45 floods selected in this study over the 24-year period, six were in autumn, 24 in winter, 14 in spring and one in summer. Fig. 6 shows the variations in Q and C observed in some of these flood events, with the temporal variations of these two parameters on the left and the relations between these two parameters, at times revealing hysteresis loops, on the right. Table 3 shows the seasonal distribution of the seven flood categories studied here.
The curves in Fig. 6 present different variants of the C-Q relationships that can be observed for the flood events in Oued El Nachef. These different variants can be grouped together, as mentioned above, in seven categories, with the percentages of each shown in Fig. 7. Thus 22% of the flood events fall into Category 1. This type of flood is characterised by a linearity of the C-Q relationship and generally occurs in winter and spring. The mechanical erosion and transport of suspended sediments is a function of the intensity of rainfall, water saturation of the soil, infiltration capacity and depth of runoff. At this time of the year, the ground is saturated and the level of infiltration is therefore lower, generating surface runoff that causes Table 2 Log-log models adjusted for each flood category to relationships (C-Q) with their RMSE adjustment test.
Log-log model C = aQb
Correlation coefficient R RMSE
a b Category 1 0.1657 0.3311 0.54 0.51 Category 2 0.1405 0.3695 0.67 0.38 Category 3 0.2038 0.2495 0.46 0.55 Category 4 0.5076 0.2162 0.38 1.37 Category 5 0.2251 0.2900 0.60 0.33 Category 6 0.2754 0.4623 0.62 2.45 Category 7 0.1614 0.4823 0.60 0.72
The Dynamics of Suspended Particulate Matter in the Oued Nachef (Tafna Basin, Algeria): Typology of Flood Events and Contribution to Sediment Transport
The Dynamics of Suspended Particulate Matter in the Oued Nachef (Tafna Basin, Algeria): Typology of Flood Events and Contribution to Sediment Transport
154
Fig. 6 Temporal developments in SPM concentrations and flow discharge during the selected floods (left) and the C-Q relationship during these floods (right), with arrows showing the dextral or sinistral direction of the hysteresis.
The Dynamics of Suspended Particulate Matter in the Oued Nachef (Tafna Basin, Algeria): Typology of Flood Events and Contribution to Sediment Transport
155 Table 3 Seasonal distribution of flood events in relation to the total of 45 floods for the different categories.
Category 1 Category 2 Category 3 Category 4 Category 5 Category 6 Category 7 Total Flood events in autumn 0 3 2 1 0 0 0 6 Flood events in winter 4 3 5 4 2 4 2 24 Flood events in spring 5 2 1 1 3 1 1 14 Flood events in summer 1 0 0 0 0 0 0 1 Total 10 8 8 6 5 5 3 45 % of total floods 22 18 18 13 11 11 7 100
greater mechanical erosion and linear sediment transport that becomes proportional to the flow discharge of the watercourse. Categories 2 and 3 each represent 18% of all the flood events studied. Category 2 floods (dextral hysteresis) are frequently seen in autumn.
In the case of Category 2 flood events, peak concentration was reached before peak flow discharge. There can be different reasons for this difference. It could be due to:
significant resuspension of sediment deposited after the previous flood event (flush effect);
a maximum contribution of surface runoff and therefore of mechanical soil erosion from the increase in flow;
the source of sediments (very erodible material) being close to the gauging station.
Thus, the transported sediment starts to be deposited before the peak flow, meaning that most of the suspended sediment being transported will be exported from the first discharges early on when the water is rising.
The opposite is true for Category 3 flood events (sinistral hysteresis) where the maximum C in SPM occurs after the peak flow. In this study, these flood events generally occurred in winter. The origin of sediment transported in this case is the result of linear hydric erosion and could also come from a source further away from the gauging station.
Category 4 floods represented close to 13% of the flood events studied and generally occurred in winter. The C-Q relationships present dextral, but closed
hysteresis. The first phase of this curve is explained by a resuspension and transport of sediments deposited after the previous flood event (as for Category 2). Then, in a second phase, the linearity describes a phase of transport where the concentration of sediments varies proportionally with the flow discharge.
With regard to Category 5 (hysteresis in an open figure of eight) and Category 6 (hysteresis in a closed figure of eight) flood events, they represent 11% of all the flood events studied. The C-Q relationship, which gives an open figure of eight, related to winter and spring floods. The form of this relationship can be explained by a first phase of transport of sediments already mobilisable in the watercourse, then a second phase of transport of sediments due either to erosion in the drainage channel caused by maximum flow discharge or to a contribution of sediment upstream of the watershed. The processes can be attributed to flood events in Category 6 that are mostly observed in winter. In this case, the second peak in concentration occurs directly after the maximum flow, suggesting a contribution of sediment from erosion of the sides. Finally, Category 7 flood events only represent almost 7% of the flood events studied. These flood events have two phases. The first causes the transport of sediments already in the drainage channel, and then immediately afterwards a reduction in flow discharge is recorded that is accompanied by a peak in SPM concentration C, which provides the knot indicating the inverse proportionality in the increase in the C-Q relationship in Fig. 5.
The Dy 156 4.3 Sedimen The avera this study w number of f flood event contributed j volume of r total. The s flood events were propor and 7.5% re Fig. 7 Distr categories (1 sediment tran Fig. 8 Relat between 1990 ynamics of Su nt Loads and age duration o was 3.5 days. flood events ts which, a just 8.5% of runoff that w sediment tran s represented rtionate to th spectively of ribution (in % to 7) of flood nsport (Ts) eva tionship betwe 0 and 2014. uspended Pa Flood Eve Water Volume of the flood e As shown a corresponde as can be s total sedimen was neverthe nsports of C 19% and 9% he volumes o f the total. For
% of the total) events studied acuated by all f
een the % of
articulate Mat ents and Con
es
events chosen above, the lar ed to Categor seen in Fig nt transport f eless 22% of ategory 2 an % respectively of runoff of r the flood ev of floods for d between 199 flood events. sediment tran
ter in the Oue tribution to n for rgest ry 1 g. 7, for a f the nd 3 y and 17% vents in C tran (0. cor Con 44 the Fin ev of s vol the different 0 and 2014 to
nsport and the
ed Nachef (Ta Sediment Tran Categories 5 nsport diverg 8%) was obs responding t nversely, the % of the sedi total volume ally, the con ents were prac
sediment tran ume respectiv categories and the volume of e % of water afna Basin, A nsport and 6, the ed completel served for C o a volume Category 6 iment for a f e of water ev ntributions o ctically the sa nsport and 9 vely. d the contribu f water flow ( volume (V) Algeria): Typo contributions ly. The lowes Category 5 of water of flood event flow discharg vacuated by f Category 4 ame, with 9. .8% and 12. ution (in %) of V) in all flood
for the flood e ology of to sediment st percentage flood events, f just 1.86%. s transported ge of 29% of all the floods. and 7 flood 4% and 9.6% 9% of water f the different events and to events studied t e , . d f . d % r t o d
The Dy Fig. 9 Intera However, transport loa lower than t In general, t when the gro
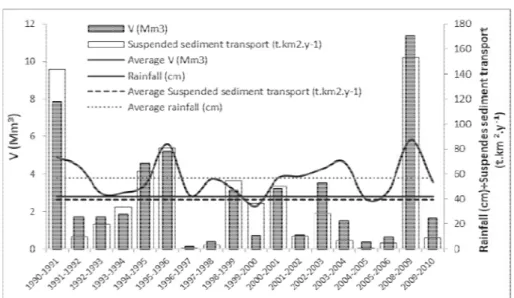
Fig. 8 den between the water flow f be seen tha from the line and 7 are cl interval, wh suspended s with water f Fig. 9 sh volumes of intensity of rainfall app sediment tra intensity of nature and i of a key rol transport in interannual a in the order hydrological and 2008-20 ynamics of Su annual variati , for Categor ad could be the contributi these flood e ound is cover notes a linear e sediment t for the seven at Categories ear relationsh lose to the lin hich means t sediment tran flow. hows good water evacu specific sed eared to pla ansports, with f this rainfall ntensity of th e in mechani rivers. Duri average of sp r of 40 t/km l cycles such 009 presente uspended Pa Flood Eve on in water vo ry 1 flood ev observed th ion of volum events occur red with vege r variation in transport and flood event 1 and 6 ar hip, whereas ne and withi that for thes nsport varied proportional ated annually iment transp ay a seconda h the distribu l, and as a he flood even ical soil erosi ing the 20 y pecific sedim m2/year, but s h as in 1990-d se1990-diment t articulate Mat ents and Con
olume and sedi vents, a sedim at was distin es of water f at a time of etation. percentage te d the volume categories. It re some dista Categories 2 in the confide se categories d proportiona ity between y and the an ort. Annual t ary role in th ution, nature consequence nts, playing m
ion and sedim years studied,
ent transport some excepti 1991, 1995-1 transport ran
ter in the Oue tribution to ment transpor ment nctly flow. year erms e of t can ance to 5 ence the ately the nnual total hese and the more ment , the was ional 1996 ging from an
5.
In an arti co Ou esta 25 rela par typ de rela ph the sini (Ca attr mec the occ exc tran to ed Nachef (Ta Sediment Tran rt (1990-2010). m 80 to 160 t nual volumesConclusion
n a hydroclim important ro cle focused o ntribution to ed Nachef. ablished base years (peri ationships bet ticulate mat ology allowe fined, of whic ationships w enomena of h flood events istral (Catego ategories 5, 6 ibuted to dif chanisms tha flood events urred in wint eption of Ca nsport for eacthe percentag afna Basin, A nsport t/km2/year, co of water (5 to
n
matic region le in erosio on the study suspended A typology d on a study iod 1990-20 tween concen tter and flo ed seven floo ch one presen while the hysteresis bet that were d ory 3) or com 6 and 7). T fferent erosio at vary by sea s. In total 84 ter (53%) a tegory 1, the ch of the cate ge of water Algeria): Typo orresponding o 11 million where floo n and river tr of flood eve sediment tran y of flood of 45 floods 14), by ex ntrations (C) ow discharg od event cat nted linear C-other six tween the ris extral (Catego mplex in a fig These phenom n-transport-s ason and by t 4% of the fl nd spring (31 e contribution egories was flow volum ology of 157 to significant m3). d events play ransport, this ents and their nsport in the events was over the past amining the of suspended e (Q). This egories to be -Q or log-log highlighted se and fall of ories 2 and 4) gure of eight mena can be edimentation the nature of oods studied %). With the n of sediment proportionate me. The most 7 t y s r e s t e d s e g d f ), t e n f d e t e tThe Dynamics of Suspended Particulate Matter in the Oued Nachef (Tafna Basin, Algeria): Typology of Flood Events and Contribution to Sediment Transport
158
frequent floods (22%) were in Category 1 (winter and spring), flood events where a linear C-Q relationship was observed but with sediment transport of just 8.5% of all the floods, despite significant volumes of water (> 30%). Meanwhile for Category 6 flood events, which only represented 11% of the flood events, the contribution to total volumes of water and sediment transport was significant at more than 43%. These Category 6 floods were mainly observed in winter (four floods) with a single flood in spring. They generally consisted of two phases, one of remobilisation and transport of sediment previously deposited on the wadi bed and a second of erosion and transport of sediments from the sides. On an interannual level, the assessment of sediment transport showed that the intensity of this transport was proportional to the volumes of water flow during the year. Thus the years 1990-1991, 1994-1995, 1995-1996 and 2008-2009 which had annual volumes of water above 4 million m3 (> 7 in 1991-1992 and > 11 in 2008-2009) exported the highest specific tonnages of sediment (60 to 160 t/km2/year), while in the other years the volumes exported were generally below 4 million m3 with sediment transport below 60 t/km2/year. In semi-arid Mediterranean regions, flood events play a key role in the export of sediments. The study of these events is vital to obtain a thorough understanding of the mechanisms of erosion-transport-sedimentation on a watershed scale as well as to accurately assess the annual tonnages of sediments evacuated by the watercourse. In this understanding of transfer mechanisms, it is evident that a flood event typology based on relationships between SPM concentrations and flow discharge is unquestionable of benefit.
Acknowledgments
The authors thank all the staff of the National Agency of Hydraulic Resources (ANRH), who participated in the field measurements at Terni Hydrometric Station. They also thank the anonymous
and the associate editor for their comments and suggestions. The authors are grateful to the CNRS for the stay of Pr. Kazi Tani in the Laboratory of functional Ecology and Environment
Author Contributions
All authors contributed equally to the paper. Jean Luc Probst was responsible for revising the article; and all authors read and revised the final manuscript.
References
[1] Walling, D. E. 1984. The Sediment Yields of African Rivers. International Association of Hydrological Sciences Publication 144: 265-83.
[2] Probst, J. L., and Amiotte-Suchet, P. 1992. Fluvial Suspended Sediment Transport and Mechanical Erosion in the Maghreb (North Africa). Hydrol. Sci. J. 37: 621-37. [3] Inbar, M. 1992. Rates of Fluvial Erosion in Basins with
a Mediterranean Type Climate. Catena 19: 393-409. [4] Alexandrov, Y., Laronne, J. B, and Reid, I. 2003.
Suspended Sediment Transport in Flash Floods of the Semi-arid Northern Negev, Israel. IAHS Publication 278: 346-52.
[5] Alexandrov, Y., Laronne, J. B., and Reid, I. 2007. Intraevent and Interseasonal Behaviour of Suspended Sediment in Flash Floods of the Semi-arid Northern Negev, Israel. Geomorphology 85: 85-97.
[6] Cohen, H., and Laronne, J. B. 2005. High Rates of Sediment Transport by Flash Floods in the Southern Judean Desert, Israel. Hydrological Processes 19: 1687-702.
[7] Rovira, A., and Batalla, R. J. 2006. Temporal Distribution of Suspended Sediment Transport in a Mediterranean Basin: The Lower Tordera (NE Spain). Geomorphology 79 (1-2): 58-71.
[8] Ghenim, A., Terfous, A., and Seddini, A. 2007. Étude du transport solide en suspension dans les régions semi-arides méditerranéennes: cas du bassin versant de lOued Sebdou (Nord-Ouest algérien). Sécheresse 18: 39-44.
[9] Billi, P. 2008. Flash Floods, Sediment Transport and Bed Forms in the Ephemeral Streams of Kobo Basin, Northern Ethiopia. Catena 75 (1): 5-17.
[10] Billi, P. 2011. Flash Flood Sediment Transport in a Steep Sand-Bed Ephemeral Stream. International Journal of Sediment Research 26: 193-209.
[11] Batalla, R. J., and Vericat, D. 2009. Hydrological and Sediment Transport Dynamics of Flushing Flows:
The Dynamics of Suspended Particulate Matter in the Oued Nachef (Tafna Basin, Algeria): Typology of Flood Events and Contribution to Sediment Transport
159 Implications for Management in Large Mediterranean
Rivers. River Research and Applications 25: 297-314. [12] Bouanani, A., Baba Hamed, K., and Fandi, W. 2013.
Production et transport des sédiments en suspension dans lOued Sikkak (Tafna-Nord-Ouest Algérie). Rev. Sci. Eau. 26: 119-32.
[13] Touazi, M., Laborde, J. P., and Bhiry, N. 2004. Modelling Rainfall-Discharge at a Mean Inter-yearly Scale in Northern Algeria. Journal of Hydrology 296 (1-4): 179-91.
[14] Bouanani, A. 2004. Hydrologie, Transport solide et modélisation, Etude de quelques sous- bassins de la Tafna (NW- Algérie). Thèse de Doctorat, Univ. Tlemcen. [15] Ghenim, A., and Megnounif, A. 2012. Ampleur de la
sécheresse dans le bassin d'alimentation du barrage Meffrouche (Nord-Ouest de lAlgérie). Physio-géo, 35-49.
[16] Megnounif, A., and Ghenim, A. N. 2012. Influence des variations hydropluviométriques sur la production des sédiments: Cas du bassin de la haute Tafna. Revue des sciences de l’eau 26 (1): 53-62.
[17] Megnounif, A., Terfous, A., and Ouillon, S. 2013. A Graphical Method to Study Suspended Sediment Dynamics during Flood Events in the Wadi Sebdou, NW Algeria (1973-2004). Journal of Hydrology 497: 24-36. [18] Terfous, A., Megnounif, A., and Bouanani, A. 2001.
Étude du transport solide en suspension dans loued Mouilah (Nord-Ouest Algérien). Rev. Sci. Eau. 14: 175-85.
[19] Megnounif, A. 2007. Étude du transport des sédiments en suspension dans les écoulements de surface. Thèse de Doctorat, Univ. Tlemcen.
[20] Gac, J. Y. 1980. Géochimie du bassin du lac Tchad. Bilan de laltération de lérosion et de la sédimentation. Trav. Doc. ORSTOM. 123: 251.
[21] Kattan, Z., and Probst, J. L. 1987. Transport en solution et en suspension par la Moselle en période de crues. Actes Journées d’Hydrologie “Crues et Inondations”, 16-8.
[22] Probst, J. L., and Signa, N. 1989. Estimation de lécoulement superficiel et de sa charge en suspension sur quelques grands bassins fluviaux du monde. C. R. Acad. Sci. Paris 309: 357-63.
[23] Ferguson, R. I. 1987. Accuracy and Precision of Methods for Estimating River Loads. Earth Surface Processes and Landforms 12: 95-104.
[24] Gordova, J. R., and Gonzalez, M. 1997. Sediment Yield Estimation in Small Watersheds Based on Stream Flow and Suspended Sediment Discharge Measurements. Soil Technology 11: 57-65.
[25] Jansson, M. B. 1997. Comparison of Sediment Rating Curves Developed on Load and on Concentration.
Nordic Hydrology 28 (3): 189-200.
[26] Walling, D. E. 1977. Assessing the Accuracy of Suspended Sediment Rating Curves for a Small Basin. Water Resources Research 13: 531-8.
[27] Crawford, C. G. 1991. Estimation of Suspended-Sediment Rating Curves and Mean Suspended-Sediment Load. J. Hydrol. 129: 331-48. [28] Cohn, T. A., De Long, L. L., Gilroy, E. J., Hirsch, R. M.,
and Wel, D. K. 1989. Estimating Constituent Loads. Water Resources Research 25: 937-42.
[29] Cohn, T. A. 1995. Recent Advances in Statistical Methods for the Estimation of Sediment and Nutrient Transport in Rivers. Reviews of Geophysics 33 (1): 1117-23.
[30] Campbell, F. B., and Bauder, H. 1940. A Rating Curve Method for Determining Silt Discharge of Stream. EOS Trans. Am. Geophys. Union. 21: 603-7.
[31] Guy, H. P. 1964. An Analysis of Same Storm-Period Variables Affecting Stream Sediment Transport. U.S. Geol. Surv. Prof. Pap. 462: 46.
[32] Mansue, I. J., and Anderson, P. W. 1974. Effects of Land Use and Retention Practices on Sediment Yields in the Stony Brook Basin, New Jersey. Water Supply Pap. 1978: 33.
[33] Piest, R. F., Bradford, J. M., and Spomer, R. G. 1957. Mechanisms of Erosion and Sediment Movement from Gullies. In Present and Prospective Technology for Predicting Sediment Yields and Sources. U.S. Dep. Agric. Res. Serv. Publ. ARS-S, 162-76.
[34] Walling, D. E., and Webb, B. W. 1982. Sediment Availability and Prediction of Stream Period Sediment Yields. I.A.H.S. Publ. 137: 327-37.
[35] Rieger, W. A., and Olive, L. J. 1984. The Behavior of Suspended Sediment Concentration during Storm Events. Drainage Basin Erosion and Sedimentation Proc. Conf. Erosion, Transportation and Sedimentation in Australian Drainage Basins, Univ New Castle, N.S.W., 121-6. [36] Kattan, Z., Gac, J. Y., and Probst, J. L. 1987. Suspended
Sediment Load and Mechanical Erosion in the Senegal Basin, Estimation of the Surface Runoff Concentration and Relative Contribution of Channel and Slope Erosion. J. Hydrol. 89: 59-76.
[37] Fournier, F., and Henin, S. 1962. Étude de la forme de la relation existant entre l’écoulement mensuel et le débit solide mensuel. Bari: Association internationale des sciences hydrologiques (AIHS), 353-8.
[38] Bolline, A. 1982. Etude et prévision de lérosion des sols limoneux cultivés en moyenne Belgique. Thèse de Doctorat, Univ. Liège, Belgique.
[39] Demmak, A. 1982. Contribution à létude de lérosion et des transports solides en Algérie septentrionale. Thèse de doctorat, Univ. Paris.
The Dynamics of Suspended Particulate Matter in the Oued Nachef (Tafna Basin, Algeria): Typology of Flood Events and Contribution to Sediment Transport
160
[40] Benkhaled, A., and Remini, B. 2003. Analyse de la relation de puissance: débit solide-débit liquide à léchelle du bassin versant de lOued Wahrane (Algérie). Rev. Sci. Eau. 16: 333-56.
[41] Achite, M., and Meddi, M. 2004. Estimation du transport solide dans le bassin versant de loued Haddad (Nord-Ouest Algérien). Sécheresse 4: 367-73.
[42] Benkadja, R. 2008. Analyse des apports solides en suspension à léchelle dun bassin en zone semi-aride: cas du bassin versant du Ksob (MsilaAlgerie). Presented at Third International Conference on the Geology of the Tethys, Aswan, Egypt.
[43] Khanchoul, K., Boukhrissa, Z., Acidi, A., and Altschul, R. 2012. Estimation of Suspended Sediment Transport in the Kebir Drainage Basin, Algeria. Quaternary International 262: 25-31.
[44] Benkadja, R., Benkadja, A., and Benhadouga, M. 2013. Quantification des matieres en suspension et valorisation des sediments de dragage a lechelle dun bassin semi-aride: Cas du barrage du Ksob (Algerie). Bull Eng Geol Environ 72: 523-31.
[45] Vivian, H. 1980. Érosion et transports solides dans le bassin du Drac au Sautet. CNRS: Équipe de recherche 30 C/O biologie végétale Grenoble, France, 349-58. [46] Probst, J. L., and Bazerbachi, A. 1986. Transport en
solution et en suspension par la Garonne supérieure. Sci. Geol. Bull. 39: 79-98.
[47] Bogardi, J. L. 1974. Sediment Transport in Alluvial Streams. Budapest: Academial Kiado Press, 812. [48] Hasholt, B., and Madeyski, M. 1998. Suspended
Sediment Yield from the Ansager River Basin, Denmark.
Danish Journal of Geography, 38-45.
[49] Vanoni, V. A. 1977. Erosion Rates from Sediments Sources. In Sedimentation Engineering. New York: ASCE Manual, 472-80.
[50] Heidel, S. G. 1956. The Progressive Lag of Sediment Concentration with Flood Waves. Trans. Am. Geophys. Union. 37: 56-66.
[51] Klein, M. 1984. Anti Clockwise Hysteresis in Suspended Sediment Concentration during Individual Storms: Holbeck Catchment, Yorkshire, England. Catena 11: 251-57.
[52] De boer, D. H., and Campbell, I. A. 1989. Spatial Scale Dependence of Sediment Dynamics in a Semi-arid Badland Drainage Basin. Catena 16: 277-90.
[53] William, G. P. 1989. Sediment Concentration versus Water Discharge during Single Hydrologic Events in Rivers. J. Hydrol. 111: 89-106.
[54] Hudson, P. F. 2003. Event Sequence and Sediment Exhaustion in the Lower Panuco Basin, Mexico. Catena 52: 57-76.
[55] Seeger, M., Errea, M. P., Begueria, S., Arnaez, J., Marti, C., and Garcia-Ruiz, J. M. 2004. Catchment Soil Moisture and Rainfall Characteristics as Determinant Factors for Discharge/Suspended Sediment Hysteretic Loops in a Small Headwater Catchment in the Spanish Pyrenees. Journal of Hydrology 288 (34): 299-311. [56] Fang, N. F., Shi, Z. H., Li, L., and Jiang, C. 2011.
Rainfall, Runoff, and Suspended Sediment Delivery Relationships in a Small Agricultural Watershed of the Three Gorges Area, China. Geomorphology 135 (12): 158-66.