https://doi.org/10.5194/hess-24-5355-2020 © Author(s) 2020. This work is distributed under the Creative Commons Attribution 4.0 License.
Contrasting seasonal changes in total and intense precipitation
in the European Alps from 1903 to 2010
Martin Ménégoz1, Evgenia Valla1, Nicolas C. Jourdain1, Juliette Blanchet1, Julien Beaumet1, Bruno Wilhelm1, Hubert Gallée1, Xavier Fettweis2, Samuel Morin3, and Sandrine Anquetin1
1Univ. Grenoble Alpes, CNRS, IRD, G-INP, IGE, 38000 Grenoble, France
2F. R. S. – FNRS, Laboratory of Climatology, Department of Geography, University of Liège, 4000 Liège, Belgium 3Univ. Grenoble Alpes, Université de Toulouse, Météo-France, CNRS, CNRM, Centre d’Études de la Neige,
38000 Grenoble, France
Correspondence: Martin Ménégoz (martin.menegoz@univ-grenoble-alpes.fr) Received: 20 December 2019 – Discussion started: 20 January 2020
Revised: 31 July 2020 – Accepted: 21 September 2020 – Published: 16 November 2020
Abstract. Changes in precipitation over the European Alps are investigated with the regional climate model MAR (Mod-èle Atmosphérique Régional) applied with a 7 km resolu-tion over the period 1903–2010 using the reanalysis ERA-20C as forcing. A comparison with several observational datasets demonstrates that the model is able to reproduce the climatology as well as both the interannual variabil-ity and the seasonal cycle of precipitation over the Euro-pean Alps. The relatively high resolution allows us to es-timate precipitation at high elevations. The vertical gradi-ent of precipitation simulated by MAR over the European Alps reaches 33% km−1 (1.21 mm d−1km−1) in summer and 38 % km−1(1.15 mm d−1km−1) in winter, on average, over 1971–2008 and shows a large spatial variability. A sig-nificant (p value < 0.05) increase in mean winter precipita-tion is simulated in the northwestern Alps over 1903–2010, with changes typically reaching 20 % to 40 % per century. This increase is mainly explained by a stronger simple daily intensity index (SDII) and is associated with less-frequent but longer wet spells. A general drying is found in summer over the same period, exceeding 20 % to 30 % per century in the western plains and 40 % to 50 % per century in the southern plains surrounding the Alps but remaining much smaller (< 10 %) and not significant above 1500 m a.s.l. Be-low this level, the summer drying is explained by a reduction in the number of wet days, reaching 20 % per century over the northwestern part of the Alps and 30 % to 50 % per cen-tury in the southern part of the Alps. It is associated with shorter but more-frequent wet spells. The centennial trends
are modulated over the last decades, with the drying occur-ring in the plains in winter also affecting high-altitude areas during this season and with a positive trend of autumn pre-cipitation occurring only over the last decades all over the Alps. Maximum daily precipitation index (Rx1day) takes its highest values in autumn in both the western and the eastern parts of the southern Alps, locally reaching 50 to 70 mm d−1 on average over 1903–2010. Centennial maxima up to 250 to 300 mm d−1 are simulated in the southern Alps, in France and Italy, as well as in the Ticino valley in Switzerland. Over 1903–2010, seasonal Rx1day shows a general and sig-nificant increase at the annual timescale and also during the four seasons, reaching local values between 20 % and 40 % per century over large parts of the Alps and the Apennines. Trends of Rx1day are significant (p value < 0.05) only when considering long time series, typically 50 to 80 years depend-ing on the area considered. Some of these trends are nonethe-less significant when computed over 1970–2010, suggesting a recent acceleration of the increase in extreme precipita-tion, whereas earlier periods with strong precipitation also occurred, in particular during the 1950s and 1960s.
1 Introduction
The European Alps are often considered the “water tower” of continental Europe (Beniston et al., 2018), hosting the head-waters of several major European rivers, such as the Rhine, the Danube, the Po and the Rhône rivers. Similar to other
mountain regions, this stems from both enhanced precipita-tion rates compared to surrounding lowlands and by the spe-cific role played by glaciers and the mountain snow cover in regulating the local and regional hydrological cycle (Wanner et al., 1997; Viviroli et al., 2008, 2020). The high popula-tion density and the presence of strong slopes make these ar-eas particularly prone to natural hazards such as landslides, floods and avalanches, which are strongly connected to me-teorological conditions (e.g. Beniston, 2006; Raymond et al., 2019; Evin et al., 2019). There is widespread scientific evi-dence that significant atmospheric warming has occurred and is projected to occur in the European Alps, as a response to anthropogenic forcing (Hock et al., 2019). This warm-ing is estimated to be 1.2◦C per century over the 20th cen-tury (Auer et al., 2007), which is twice as large as global rates (Brunetti et al., 2009; Gobiet et al., 2014). This warm-ing strengthened over the last decades, with values exceedwarm-ing 0.3◦C per decade (Rottler et al., 2019). Precipitation changes
are more difficult to detect because of (i) the difficulty to ob-serve and simulate this variable in particular over mountain-ous areas, (ii) their dependance on the large climate inter-nal variability, and (iii) the spatial heterogeneity peculiar to complex-topography areas.
The longest time series of observed precipitation in the European Alps are available in Switzerland and Italy, with station data that have been homogenized over the last 100 to 150 years (i.e. starting from 1900 and even before; Schmidli et al., 2002; Brugnara and Maugeri, 2019). Such a long record is useful to investigate precipitation changes. But sta-tion data need to be considered carefully, because the spatio-temporal heterogeneity of the data availability might be a cause of spurious trends (e.g. Masson and Frei, 2016). In-terpolation of station data can be used to produce gridded products, commonly used to investigate climate variability. For example, S2M (Durand et al., 2009) and SPAZM (Got-tardi et al., 2012) are two reanalyses covering the French Alps, HISTALP (“historical instrumental climatological sur-face time series of the Greater Alpine Region”; Auer et al., 2007) and EURO4M (European Reanalysis and Observations for Monitoring; Isotta et al., 2014) are reconstructions of the climate of the European Alps, and E-OBS is a dataset com-monly used for model verification over Europe (Cornes et al., 2018). General circulation models (GCMs) are also widely used to investigate climate change processes and trends. However, their coarse resolution precludes accurate simula-tions of small-scale processes typical of mountainous areas, such as those inducing the spatial heterogeneity of precipi-tation and snow cover. It is, therefore, difficult to study the Alpine climate variability with GCMs (Zubler et al., 2016). Due to their finer resolution (∼ 25 to 1 km) and their more detailed parametrization for physical processes (e.g. precipi-tation microphysics, surface snow scheme), which can be de-veloped and tuned specifically by considering regional geo-graphical features, regional climate models (RCMs) are more adapted to simulate the mountainous climate and can be used
to dynamically downscale GCMs or global reanalyses. They have been widely used to simulate the climate in mountain-ous areas and in particular temperature (Smiatek et al., 2016), daily and subdaily precipitation events (Torma et al., 2015; Pieri et al., 2015), precipitation trends (Giorgi et al., 2016), and snow cover (Steger et al., 2013). A fine resolution is critical to simulate precipitation correctly. By increasing the resolution from 0.44 to 0.11◦, Fantini et al. (2018) demon-strated that a RCM better captures the spatial pattern and the seasonal cycle of precipitation as well as its daily in-tensities and statistics. The improvement of the model per-formances currently allows researchers to run RCMs at high resolution, typically 1 to 5 km, in non-hydrostatic configu-rations, resolving the convective processes and allowing an accurate description of the snow cover in mountainous areas (e.g. Ban et al., 2014, 2015; Lüthi et al., 2019; Vionnet et al., 2019). Such a configuration is, however, challenging to run over more than 1 to 2 decades due to computational costs.
Internal climate variability in the North Atlantic basin in-duces large seasonal to multidecadal variability of precipi-tation over Europe (Qasmi et al., 2017; Dell’Aquila et al., 2018; Brugnara and Maugeri, 2019). In the European Alps, higher interannual variability is observed in the southern compared to the northern Alpine areas (Efthymiadis et al., 2007). Seasonally, higher interannual variability in winter and autumn compared to other seasons has been reported in this area (Brunetti et al., 2009; Bartolini et al., 2009). Over the last decades, precipitation rates have been declining for any period of the year in the Mediterranean area (Giorgi and Lionello, 2008; Mariotti et al., 2015), which is a sig-nal partly attributed to anthropogenic forcings (Hoerling et al., 2012) and associated with a significant surface drying (Douville and Plazzotta, 2017). Precipitation trends during the last century are more contrasted over the Alps, with a decrease in the southeastern Alps consistent with the dry-ing of the Mediterranean area (Schmidli et al., 2002; Auer et al., 2007; Brugnara and Maugeri, 2019) and an increase in the annual precipitation in the northwestern Alps, mainly driven by a positive and significant trend in winter and at high elevation (Masson and Frei, 2014, 2016). Napoli et al. (2019) suggested that the contrasted trends of precipi-tation between high mountains and lowlands over the last decades are explained by the aerosol forcing that cools the at-mosphere mainly at low elevations since the air quality is bet-ter at high elevations. Precipitation trends also show strong seasonal contrasts in the Alps (Pavan et al., 2019). In addi-tion, precipitation trends emerge from the natural variability only when considering long time series, typically 1 century (Schmidli et al., 2002). This result is consistent with previ-ous studies claiming that precipitation rates did not show any significant trend in the Alps when considering shorter peri-ods, as found in Durand et al. (2009) in the French Alps over the period 1958–2002.
Dry spells did not show any clear tendency over the last century in the Alps (Schmidli and Frei, 2005; Brugnara and
Maugeri, 2019), whereas the length of dry episodes increased in the Mediterranean area (Kuglitsch et al., 2010). On the other hand, Schmidli and Frei (2005) highlighted contrasting seasonal trends of the wet spell duration in the Swiss Alps, with a lengthening in winter and a shortening in summer. Using 104 rain gauge stations in Switzerland, Schmidli and Frei (2005) found an increase in the high quantiles of pre-cipitation by 10 % to 30 % over 1901–2000, a result evidenc-ing an increase in extreme precipitation in this area, which they relate to global climate change. This finding has been supported by Scherrer et al. (2016), suggesting an increase in both the intensity and the frequency of heavy precipita-tion events in Switzerland. The intensity of extreme precipi-tation is often expected to follow a Clausius–Clapeyron (CC) relationship with temperature changes, with a scaling rate surrounding 7 %◦C−1 (Trenberth et al., 2003). However, different values of CC scaling rates has been reported in the literature. Focusing on strong precipitation events ob-served in Switzerland (and regardless of their duration), Mol-nar et al. (2015) reported super-CC scaling rates between 11 %◦C−1 and 13 %◦C−1, partly related to an intensifica-tion of convecintensifica-tion during the last 30 years. Conversely, Ban et al. (2015) found an increase in extreme precipitation events that asymptotically intensifies following the CC relationship when applying a convection-resolving RCM at 2.2 km reso-lution over the European Alps. Using model data over the last 400 years and over the 21st century, Brönnimann et al. (2018) evidenced a limitation of the available moisture in the atmosphere at the seasonal timescale that limits the in-crease in heavy precipitation during the summer even with strong warming levels. They pointed out a shift in heavy precipitation events from late summer to early summer and early autumn. Considering the annual maximum of daily precipitation (Rx1day), Brugnara and Maugeri (2019) also found an increase in extreme precipitation in Switzerland over 1890–2017, whereas they could not highlight a clear trend of extreme precipitation in northern Italy, suggesting a non-uniform spatial change in strong precipitation events. The CC scaling rate shows a large spatial variability, in par-ticular because atmospheric circulation patterns may drive heterogenous moisture advection (Molnar et al., 2015) and also because of the potential limitation of moisture availabil-ity at the local scale (Brönnimann et al., 2018). Overall, the CC scaling rate depends on the frequency of the precipita-tion data considered in the calculaprecipita-tion, with higher CC scal-ing rates generally found when considerscal-ing data with high frequencies (e.g. hourly versus daily).
RCMs are limited-area models that can be forced later-ally with atmospheric reanalysis, often available only for the last decades, such as the ECMWF reanalyses ERA40 (1958– 2002, Uppala et al., 2005), ERA-Interim (1979–2019, Dee et al., 2011) and ERA5 (1950 onward; Hersbach and Dee, 2016). Recent reanalysis products available for the whole 20th century (e.g. ERA-20C, 1900–2010; Poli et al., 2016) now offer the possibility to apply RCMs over longer
pe-riods, although such a reanalysis, assimilating few data, is less reliable than reanalysis built in the satellite era. Most of the observational and modelling data used to investigate cli-mate change in the European Alps generally do not combine a daily resolution, a centennial availability and a fine spa-tial resolution, precluding investigations of changes in mean and extreme precipitation. This strongly limits the possibil-ity to detect precipitation trends, especially when consider-ing the large internal variability that may overwhelm long-term trends. In this study, daily precipitation variability and changes in the European Alps (referred to as the Alps in the rest of the text) are investigated over the period 1903–2010, using observational datasets as well as the Regional Atmo-sphere Model (MAR) applied with a resolution of 7 km and driven by the ERA-20C reanalysis. The material and meth-ods, including a description of MAR and different observa-tional datasets are described in Sect. 2. The model outputs are compared with several observational datasets in Sect. 3. Seasonal and annual trends of precipitation indices are es-timated over 1903–2010 in Sect. 4. A discussion associated with the conclusions is presented in Sect. 5.
2 Material and methods
2.1 The regional climate model MAR
In this section we provide a succinct description of the Re-gional Atmosphere Model (MAR; http://mar.cnrs.fr/, last ac-cess: 12 November 2020), developed at ULiège (Belgium) and IGE (Grenoble). A more detailed description can be found in Gallée and Schayes (1994), Gallée (1995) and Gal-lée et al. (2001, 2005). MAR is a hydrostatic primitive equa-tion model with a vertical coordinate defined as sigma coor-dinates. The radiative transfer through the atmosphere uses the radiative scheme of the ECMWF reanalysis (Morcrette, 2002). MAR includes a detailed scheme of clouds micro-physics with six prognostic equations for specific humidity, cloud droplet concentration, cloud ice crystals (concentra-tion and number), concentra(concentra-tion of precipitating snow par-ticles and rain drops. The convective adjustment is param-eterized according to Bechtold et al. (2001). MAR is cou-pled to the one-dimensional land surface scheme SISVAT (Soil Ice Snow Vegetation Atmosphere Transfer; De Ridder and Schayes, 1997; Gallée et al., 2001) that includes a snow multilayer scheme (Brun et al., 1992 ), including prognos-tic equations for temperature, mass, water content and snow properties (dendricity, sphericity and size) as well as an ice module (Lefebre et al., 2003). As pointed out in Messager et al. (2006), the physics of MAR can be adjusted to the re-gion of interest and can be used with relatively high reso-lutions (40 to 7 km; finer resoreso-lutions would not be possible when using the hydrostatic configuration). MAR is a limited-area model that offers the advantage to be able to be forced by most reanalyses (including ERA-20C) or CMIP5/CMIP6
global model outputs. MAR has been first designed for po-lar regions (Gallée, 1995), i.e. Antarctica (e.g. Gallée et al., 1996; Naithani et al., 2002; Gallée et al., 2013; Amory et al., 2015; Agosta et al., 2019) and Greenland (Fettweis et al., 2017). It has also been applied over tropical regions (Mes-sager et al., 2004) to investigate the precipitation variabil-ity (Gallée, 2004). MAR has also been used to simulate the climate at midlatitudes (e.g. Wyard et al., 2017) and, in particular, to study changes in precipitation over Europe (Doutreloup et al., 2019). It has been applied over various mountainous areas, e.g. Himalaya (Ménégoz et al., 2013), Svalbard (Lang et al., 2015), Kerguelen archipelago (Favier et al., 2016; Verfaillie et al., 2019) and Antarctic peninsula (Datta et al., 2018).
2.2 MAR configuration
We used version 3.9.0 of MAR, which is an open-source code available at https://mar.cnrs.fr/ (last access: 12 Novem-ber 2020). Here, the model was applied over the European Alps with a domain that extends from 42.8 to 48.4◦N and from 2.5 to 15.2◦E, and it includes 140 × 90 grid points at 7 km horizontal resolution. This domain covers most of the European Alps, except its most eastern part over Austria and Slovenia. With the model physics being affected at the bor-ders by the lateral forcing, a smaller domain is chosen for the analysis, which extends from 43.5 to 48◦N and from 5 to 13◦E, covering the French, Italian and Swiss Alps, as well as a large part of the Austrian mountains (Fig. 1a). This con-figuration is based on 24 levels in the atmosphere and 7 lev-els in the soil, and the snow cover is described with a num-ber of layers varying from 1 to 20. Here, MAR is laterally forced with the 6-hourly outputs of the ERA-20C reanaly-sis, and its dynamical and physical schemes are applied with a time step of 60 s. ERA-20C is one of the first reanalyses available from 1900 to 2010, assimilating surface pressure and near-surface winds over the ocean and forced by sea sur-face temperature (SST) reconstructions (Poli et al., 2016). By assimilating a limited number of variables correspond-ing to those available relatively homogeneously over 1900– 2010, the ERA-20C reanalysis is expected to be homoge-neous over this period, with a limited risk of including spu-rious trends. However, this reanalysis is probably less accu-rate than other products also assimilating humidity and tem-perature in the free troposphere, which is a weakness that could induce model biases also in regional experiments as ev-idenced by Fettweis et al. (2017) over Greenland. The coarse resolution of ERA-20C (∼ 125 km) does not allow for a cor-rect description of the atmospheric variables over mountain-ous areas, which justifies the use of a regional model with higher resolution and advanced physical parameterizations. MAR has already been successfully tested with the ERA-20C reanalysis as boundary conditions over Europe (Wyard et al., 2017, 2018). After a spin-up of 2 years, the model in general and the surface component in particular are
sup-Figure 1. (a) Annual mean of precipitation (TP, mm yr−1) over 1971–2008 in the Alps simulated with MAR applied with a resolution of 7 km and laterally forced with ERA-20C. The coloured boxes correspond to the southern Alps (SA, orange), the northwest-ern Alps (NWA, blue) and the northeastnorthwest-ern Alps (NEA, purple). Precipitation differences (%) between (b) the MAR experiment and the SPAZM dataset, (c) the MAR experiment and the EURO4M-APGD observational gridded datasets, and (d) the SPAZM and the EURO4M-APGD datasets. Panels (c) and (d) are shown only for the area where the SPAZM data are available. The 1000 m spaced black contours show the topography in the 7 km resolution model, start-ing from 500 m a.s.l., and political frontiers are denoted with the black dashed lines. The pattern correlation values between MAR outputs and observational data are 0.59 and 0.63, respectively, with EURO4M and SPAZM (p value < 1 × 10−200).
posed to reach an equilibrium. Therefore, the first 2 years have been excluded from this analysis that hence focuses on the period 1903–2010.
2.3 Observational datasets
Observational datasets are used in this study for two ob-jectives: first, a comparison between the model outputs and the different precipitation datasets have been conducted over 1971–2008, a period for which all the datasets are avail-able (Sect. 3). Second, an analysis of the trends of several precipitation indices is described using the MAR experi-ments and the MeteoSwiss station data available since the beginning of the 20th century (Sect. 4). In addition to the
MeteoSwiss station data, the following datasets have been considered.
2.3.1 HISTALP
The HISTALP (“historical instrumental climatological sur-face time series”) is the first long-term database of meteo-rological data collected in the European Alps, initiated in the 1990s (Auer and Böhm, 1994) and completed later on (Auer et al., 2007). This dataset is available with a monthly resolution for air temperature at 2 m, surface pressure, pre-cipitation, sunshine duration and cloudiness through two different configurations: a first one including homogenized time series of local measurements, with the first observations available from 1760 for temperature and 1800 for precipita-tion, and a second one provided as a gridded version. The gridded version, used in our study, is available from 1800 to 2014. Originally available at a 1◦×1◦ resolution (Auer et al., 2007), it is now based on a 50×50 resolution (http: //www.zamg.ac.at/histalp/dataset/grid/five_min.php, last ac-cess: 12 November 2020).
2.3.2 EURO4M-APGD
The Alpine Precipitation Grid Dataset (EURO4M-APGD; Isotta et al., 2014) is a 5 km × 5 km grid analysis of daily precipitation, extending over the European Alps and cover-ing the period 1971–2008. It is based on rain gauge networks, encompassing more than 8500 stations from Austria, Croa-tia, France, Germany, Italy, Slovenia and Switzerland. This dataset was developed in the framework of the European Re-analysis and Observations for Monitoring (EURO4M) initia-tive and is simply named EURO4M hereafter.
2.3.3 E-OBS
E-OBS is provided by the ECA&D (European Climate As-sessment & Dataset) project under the Copernicus Climate Change Service (van den Besselaar et al., 2011). It is a daily gridded dataset over Europe for temperature and precipita-tion, produced from interpolation of local measurements at two available resolutions: 0.25 and 0.1◦ (the highest reso-lution is used in this study). It is available from 1950 and updated each year, and it is commonly used for model evalu-ation (e.g. Guillod et al., 2017). Version 19 of E-OBS offers an estimate of the uncertainty related to the interpolation of local observations by providing a 100-member ensemble for each variable (Cornes et al., 2018).
2.3.4 S2M
The S2M reanalysis combines large-scale reanalyses and forecasts with in situ meteorological observations, includ-ing precipitation, in order to provide a hourly reanalysis of meteorological conditions in the French Alps, at the scale of massifs with a typical surface area of 1000 km2 within
which meteorological conditions are assumed to be homoge-nous but vary with elevation by steps of 300 m (Durand et al., 2009). Hence this reanalysis does not use a regular grid but focuses on the elevation dependency of meteorological conditions. A recent version of this open-access reanalysis is now described in Vernay et al. (2019).
2.3.5 SPAZM
The SPAZM dataset is a gridded product at a 1 km resolu-tion for minimum and maximum daily 2 m temperature and daily precipitation in the French Alps, available over the pe-riod 1948–2009 and based on the interpolation of a dense network of rain gauges and temperature sensors from Météo-France and the French company Électricité de Météo-France (EDF; Gottardi et al., 2012). This dataset is provided with calibra-tion parameters allowing users to reproduce the stream flow observed in the Rhône valley with a hydrological model. These parameters are useful to correct the snowfall rates that are often underestimated in rain gauge measurements. The solid and liquid precipitation has been computed by consider-ing 100 % of solid precipitation below 0◦C and 100 % of liq-uid precipitation above 2◦C, considering daily temperature. A linear relationship for the ratio liquid/solid precipitation was applied between 0 and 2◦C. Following the calibration suggested by Picouet (2012), we applied a correction factor for solid precipitation of 1.5 in the northern Alps and 1.3 elsewhere. The northern Alps are defined here as the area lo-cated north of Grenoble city (45.1885◦N) and higher than 1000 m a.s.l. These apparently arbitrary values have been de-veloped and evaluated in the context of hydrological studies (Gouttevin et al., 2017).
An increasing number of climate data based on observa-tional networks, reanalysis product and model experiments covering the European Alps are available, as described in the project EURO4M (Isotta et al., 2014, and http://www. euro4m.eu/datasets.html, last access: 12 November 2020, for recent updates). The number of products in this study has been limited for practical considerations, but obviously, fur-ther investigations could be done with ofur-ther datasets (e.g. ERA5; Hersbach and Dee, 2016; ARCIS Italian observa-tions; Pavan et al., 2019).
2.4 Statistical analysis and indices
Mean and trends for the precipitation indices described in Table 1 are considered in this study, most of them selected from those recommended by the World Meteorological Or-ganization (Peterson et al., 2001; http://etccdi.pacificclimate. org/list_27_indices.shtml, last access: 12 November 2020). These indices, for which a full description is shown in Ta-ble 1, are the total precipitation amount (annual, TP, or sea-sonal, STP), the number of wet days (denoted WD), the sim-ple daily intensity index (SDII, i.e. the amount of precipita-tion during the days with precipitaprecipita-tion), the maximum daily
precipitation (Rx1day), the mean number of wet spells per season (MNWS) and the mean wet spell duration (MWSD). When comparing MAR outputs with observational datasets based on a higher resolution (EURO4M, SPAZM), these ones are linearly interpolated onto the MAR grid. The gridded data are based on regular grids, except the S2M data that are provided with a georeferenced polygon describing the lo-cation of each massif. Correlation and root-mean-square er-ror (RMSE) are computed to investigate the differences be-tween datasets. The linear trends are computed with a linear least-square regression, and a two-sided p value is computed to test if the trends are significantly different from zero (Wald test with a t distribution of the test statistic). Mean values and normalized trends (in percentage of the averaged val-ues) are computed annually and seasonally for the precipita-tion rates and indices in the following secprecipita-tions. The seasons are computed by averaging indices over December–January– February (DJF) for winter, March–April–May (MAM) for spring, June–July–August (JJA) for summer and September– October–November (SON) for autumn.
3 Climatology of the MAR experiment and the observational datasets
3.1 Spatial differences
The total precipitation amount (TP) averaged over 1971– 2008 simulated with MAR is shown in Fig. 1a, with annual mean ranging between 300 and 3000 mm. In a general way, TP is stronger in the northern than in the southern Alps as ex-pected due to the drier Mediterranean climate in the south. A comparison between the MAR experiment and the EURO4M reanalysis (Fig. 1b) shows a good consistency between these two datasets in the lowlands (i.e. below 500 m a.s.l.), with positive or negative differences barely exceeding 20 % in these areas, except in the Piedmont–Ticino–Lombardy re-gion and in some parts of the northern Apennines where the model underestimates the strong precipitation rates specific to these medium-elevation areas of the southern Alps. Above 1500 m, this difference is larger with precipitation rates 40 % to 80 % higher in the MAR experiment than in the EURO4M dataset. Such a difference is significant with respect to the interannual standard deviation of precipitation that gener-ally does not exceed 30 % over the domain of application of MAR (Fig. A1). The comparison between MAR and SPAZM (Fig. 1c) shows similar differences in the lowlands as with EURO4M (∼ 20 %) but a better agreement at high elevation, with differences barely exceeding 40 %. Pattern correlation between MAR and EURO4M is 0.59 and reaches 0.63 be-tween MAR and SPAZM, suggesting a slightly better spa-tial consistency between these last two products. The precip-itation rates estimated from SPAZM above 1500 m a.s.l. are also higher in comparison to those provided by EURO4M (Fig. 1d, differences ranging between 20 % to 80 %). As
snowfall rates in SPAZM have been adjusted to fit the hydro-logical balance over the French Alps, this comparison sug-gests that the high precipitation rates simulated with MAR above 1500 m a.s.l. may be realistic. Overall, TP simulated with MAR is relatively similar to TP estimated from SPAZM and shows stronger values with respect to EURO4M data over the Alps.
3.2 Vertical gradients
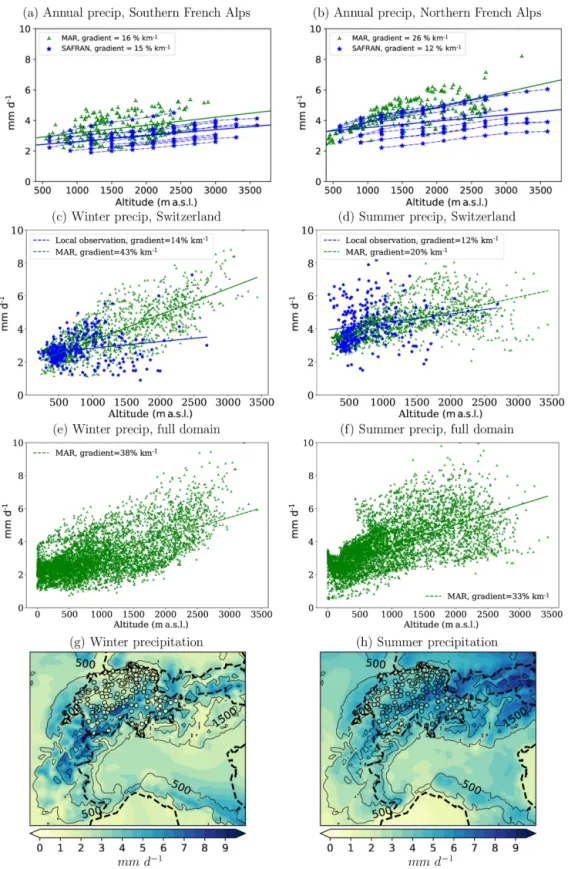
Vertical gradients of TP simulated with MAR are evidenced in Fig. 2 (as yearly averages, considering both wet and dry days), including also a comparison to the S2M reanalysis and the MeteoSwiss station data. In the MAR experiment, TP varies from 2 to 4 mm d−1 at 500 m a.s.l. and from 3 to 5 mm d−1at 2500 m a.s.l. in the southern Alps; it varies from 2 to 4 mm d−1 at 500 m a.s.l. and from 3 to 6 mm d−1 at 2500 m a.s.l. in the northern French Alps. The vertical gra-dient estimated from the S2M dataset is smaller than those simulated by MAR. The large spread in the scatter plots of Fig. 2a and b is explained by the spatial variability of the vertical gradient of precipitation, which is stronger in MAR than in S2M. Based on a comparison with high-resolution numerical weather forecast model and glacier mass bal-ance in mountain glaciers in the French Alps, it has been shown that S2M most likely underestimates high-elevation winter precipitation (above 2000 m a.s.l.), which lends cre-dence to the higher gradients simulated by MAR (Vionnet et al., 2019). MAR data are compared to the MeteoSwiss station data in Fig. 2c and d. A difference between the two datasets in terms of vertical gradients is found both in winter (14 % km−1for the local observations vs. 43 % km−1in the MAR data) and in summer (12 % km−1for the local observa-tions vs. 20 % km−1in the MAR data). These seasonally con-trasted differences suggest a possible underestimation of the precipitation rates estimated from rain gauge measurements in relation to snowfall undercatch issues (Kochendorfer et al., 2017). However, the differences found in summer, i.e. a period with reduced snowfall rates, also suggest an overes-timation of the precipitation rates at high elevation in the MAR experiment. Nevertheless, it is difficult to accurately quantify the model biases at high-elevation areas because of the scarceness of the observational data above 2000 m a.s.l., whereas a large number of the MAR grid cells reach an ele-vation ranging between 2000 and 3000 m a.s.l. with a spatial resolution of 7 km (Fig. 2c and d). An underestimation of the precipitation rates in the model versus the station data is also found in summer at intermediate elevation (500–1500 m, Fig. 2d). This difference appearing only in summer suggests an inability of the convective model scheme, which could in-duce too much convective mixing. Overall, the vertical gra-dient of precipitation simulated by MAR over the entire do-main of application reaches 38 % km−1(1.15 mm d−1km−1) in winter and 33 % km−1 (1.21 mm d−1km−1) in summer (Fig. 2e and f). Overall, the spatial patterns shown in Fig. 2g
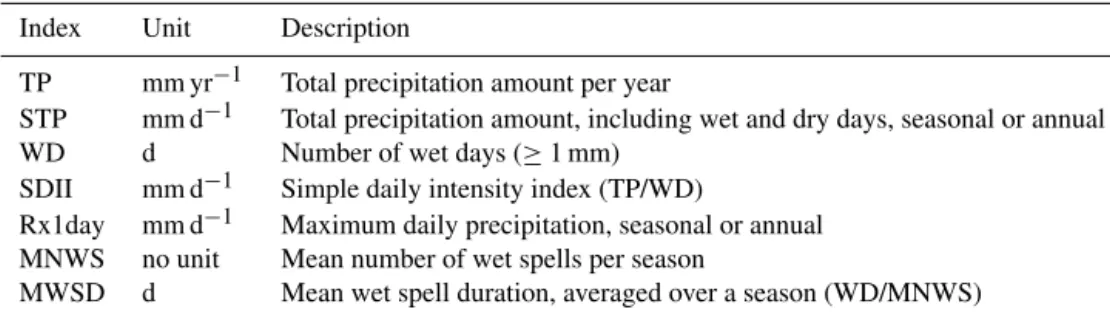
Table 1. Annual and seasonal precipitation indices analysed in this study. Precipitation is the sum of solid and liquid precipitation. These definitions follow the recommendation by the World Meteorological Organization (Peterson et al., 2001; http://etccdi.pacificclimate.org/list_ 27_indices.shtml, last access: 12 November 2020).
Index Unit Description
TP mm yr−1 Total precipitation amount per year
STP mm d−1 Total precipitation amount, including wet and dry days, seasonal or annual WD d Number of wet days (≥ 1 mm)
SDII mm d−1 Simple daily intensity index (TP/WD)
Rx1day mm d−1 Maximum daily precipitation, seasonal or annual MNWS no unit Mean number of wet spells per season
MWSD d Mean wet spell duration, averaged over a season (WD/MNWS)
and h for the MAR experiment and the MeteoSwiss station data suggest that MAR is able to reproduce the seasonal vari-ations of precipitation rates, with large (small) values in sum-mer in the northeastern (southwestern) Alps and an opposite pattern in winter.
3.3 Interannual variability and seasonal cycle
The temporal evolution of precipitation and its seasonal cycle over the period 1971–2008 is shown in Fig. 3 for three sub-regions defined as the southern Alps (SA, 43.5 to 45.5◦N and 5 to 7.5◦E), the northwestern Alps (NWA, 45.5 to 47◦N and 5 to 7.5◦E) and the northeastern Alps (NEA, 45.5 to 48◦N and 7.5 to 13◦E), corresponding respectively to the orange, blue and purple boxes in Fig. 1a. These boxes have been de-fined according to the data availability of the products used for comparisons as well as regional climatological tions: SA is largely affected by the Mediterranean dry condi-tions, NWA precipitation rates are mainly related to western low-pressure systems, and NEA is more typical of a conti-nental climate, with wetter conditions in summer than in win-ter. Over 1971–2008, precipitation rates estimated from the different datasets (EURO4M, SPAZM, E-OBS, HISTALP) show similar features. They range between 2 and 4 mm d−1 in SA and take higher values in NWA and NEA, varying be-tween 3 and 5 mm d−1. Table 2 includes the interannual cor-relations between the different datasets, which take values above 0.8, except for HISTALP that correlates neither with EURO4M nor with MAR. The correlations between MAR and the observational datasets range between 0.84 and 0.89, whereas the correlations among these different datasets sys-tematically exceed 0.9, even reaching 0.99 and 0.97 for EURO4M versus SPAZM in SA and NWA. Such high cor-relation is probably due to the rain gauge network used to produce these gridded datasets that is partially common be-tween the two products. Overall these correlation values sug-gest a correct interannual variability in the MAR experiment but less realistic than those estimated from the other obser-vational datasets (except HISTALP). The model bias could be related to both model deficiencies and uncertainties in the ERA-20C reanalysis used as boundary conditions. The
dif-ference between the MAR experiment and the observational products is similar in all the datasets, with a RMSE rang-ing between 0.26 and 1.14. RMSE values computed with HISTALP are comparable to the other ones, evidencing that HISTALP is able to provide an estimation of precipitation similar to the other products, even if the interannual variabil-ity is poorly reproduced in this dataset compared to the other ones (low correlation). No clear regional and data-dependent specificity in terms of RMSE is discernable in Table 2. It is worth noting that the uncertainty related to data interpola-tion in E-OBS (orange dashed lines) encompasses the time series corresponding to the other datasets. Such a large un-certainty is probably related to the low number of obser-vations assimilated in E-OBS over the Alps in comparison with the large number of meteorological stations used to build EURO4M and SPAZM. This points out the large uncer-tainty of such gridded products in mountainous areas. MAR is closer to SPAZM and EURO4M (smaller RMSE) than to HISTALP and E-OBS (higher RMSE), a finding giving con-fidence to the realism of the MAR simulation. The differ-ent datasets show specific seasonal cycles of precipitation (Fig. 3, bottom), with two maximum values in spring and autumn in SA (Mediterranean climate), one maximum value in summer in NEA (continental climate) and a mix between these two regimes over NWA. Overall, the consistency be-tween the different datasets is better in SA and NEA than over NWA, where more discrepancies among the datasets have been found. The comparison between model experi-ments and observational datasets gives confidence to the pre-cipitation rates simulated with MAR forced here by ERA-20C. Longer simulations are therefore considered in the next section to investigate potential trends over the last century.
4 Precipitation trends in the Alps over 1903–2010 4.1 Mean annual and seasonal precipitation
No significant trend in precipitation rates is identified on av-erage when considering the three Alpine sub-regions shown in Fig. 3, a finding that could be explained by the
short-Figure 2. Precipitation (STP) averaged over 1971–2008 simulated by MAR and estimated from reanalyses and observations. Panels (a– f) show precipitation as a function of the elevation over the southern (a) and the northern (b) French Alps in MAR experiments and S2M reanalysis and estimated over Switzerland from local meteorological stations and from the MAR grid cells covering Switzerland during summer (c) and winter (d). The vertical gradients averaged over the whole model domain are shown for winter (e) and summer (f). STP averaged over 1903–2010 in the MAR experiment (shaded, mm d−1) and observed at MeteoSwiss stations in Switzerland (dots, observations available from the beginning of the 20th century) are shown for summer (g) and winter (h). In (g) and (h), the 1000 m spaced black contours show the topography with a 7 km resolution, starting from 500 m a.s.l., and political frontiers are denoted with the black dashed lines.
Figure 3. Annual mean precipitation (mm d−1) averaged over the southern Alps (SA), the northwestern Alps (NWA) and the northeastern Alps (NEA) over the period 1971–2008 (top row) and corresponding monthly averaged seasonal cycle over the same period (bottom row). The area covered by the SA, NWA and NEA domains can be visualized in Fig. 1. MAR outputs are shown with the observational datasets EURO4M, SPAZM, HISTALP and E-OBS (see text for details). E-OBS (orange solid line) is provided with an estimation of the observational uncertainty (orange dashed lines).
Table 2. Correlation Pearson coefficient computed over 1971–2008 (C) and root-mean-square error (RMSE) between the time series of precipitation data over 1971–2008 for the three different sub-areas described in Fig. 1. All the correlations are significant (p value > 0.05), except those computed with the HISTALP data.
Southern Alps (SA) Northwestern Alps (NWA) Northeastern Alps (NEA) MAR – EURO4M C =0.89; RMSE = 0.46 C =0.88; RMSE = 0.37 C =0.85; RMSE = 0.41 MAR – SPAZM C =0.87; RMSE = 0.26 C =0.85; RMSE = 0.45 –
MAR – E-OBS C =0.84; RMSE = 0.69 C =0.86; RMSE = 0.83 C =0.79; RMSE = 0.90 MAR – HISTALP C =0.02; RMSE = 0.64 C = −0.10; RMSE = 0.73 C = −0.22; RMSE = 0.66 EURO4M – SPAZM C =0.99; RMSE = 0.38 C =0.97; RMSE = 0.62 –
E-OBS – SPAZM C =0.93; RMSE = 0.63 C =0.95; RMSE = 1.14 –
E-OBS – EURO4M C =0.94; RMSE = 0.29 C =0.95; RMSE = 0.54 C =0.93; RMSE = 0.54 EURO4M – HISTALP C =0.03; RMSE = 0.68 C = −0.08; RMSE = 0.74 C = −0.26; RMSE = 0.67
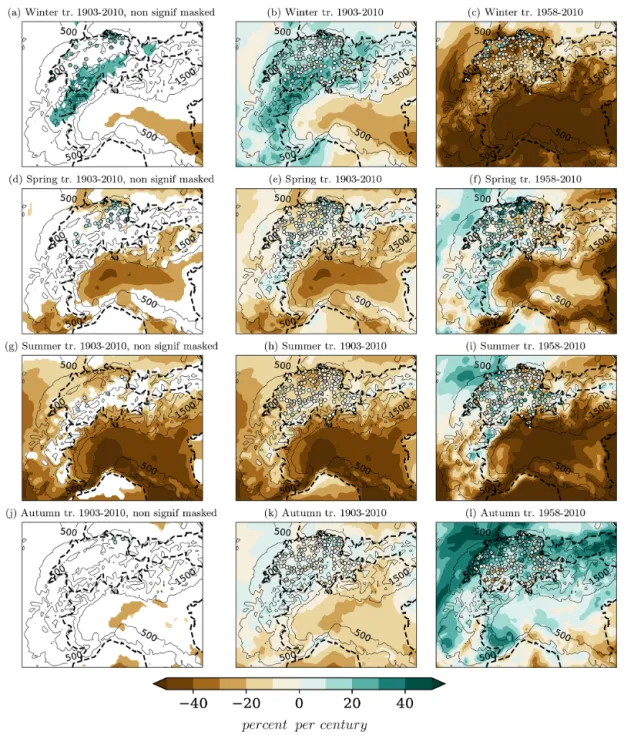
ness of the time series. The seasonal trends of mean precip-itation (STP) are investigated now over longer periods, by considering in Fig. 4 the MAR experiment (shaded) and the MeteoSwiss station data (dotted) over 1903–2010 (left) and over 1958–2010 (right). The MeteoSwiss data are used here because they are available over the period covered by the MAR experiment (i.e. from 1903). Over 1903–2010, trends are contrasted by season and altitude. In winter, there is a general positive trend in precipitation over the Alps (up to 40 % per century), contrasting with a drying simulated in the surrounding plains (∼ −10 % per century), both in the Po plain and in the Rhône valley (Fig. 4b). In winter, the MAR experiment is consistent with the local observations showing an increase in precipitation over Switzerland, except in the southern part of this country, where some stations show a drying trend. However, when masking the non-significant
trends (p value > 0.05, Fig. 4a), only the positive trends of precipitation remain over the Alpine mountains, with values ranging between 20 % and 40 % per century in the north-ern French Alps and in southwestnorth-ern Switzerland, at an el-evation generally higher than 1500 m a.s.l. The MeteoSwiss data show a significant increase in precipitation at stations located further north in Switzerland, with a magnitude simi-lar to the model values. In summer, a general drying is sim-ulated over the whole model domain (Fig. 4h), with values exceeding 40 % to 50 % per century in the Po and the Rhône valleys. This signal is much less pronounced in the Alpine areas located above 1500 m a.s.l., where the signal is gener-ally not significant (Fig. 4g). The drying is less pronounced over Switzerland in comparison with the southern Alps. Con-sidering Fig. 4h, a drying and even a slight increase in pre-cipitation (< 10 % per century) is found in the station data
Figure 4. Seasonal linear trends (% per century) of precipitation in winter (a–c), spring (d–f), summer (g–i) and autumn (j–l) over 1903–2010 for (a, b, d, e, g, h, j, k) and over 1958–2010 for (c, f, i, l). The 1000 m spaced black contours show the topography in the 7 km resolution model, starting from 500 m a.s.l., and frontiers are denoted with the black dashed lines. In (a, d, g, j), the trend is masked when its p value is below 0.05 (level of confidence lower than 95 %; white areas for the model outputs and station data excluded).
over the mountains of southern Switzerland, whereas a dry-ing is observed in the north of the country (10 % to 20 % per century). The summer trends locally observed in Switzerland are, however, barely significant (Fig. 4g). Spring and autumn trends show intermediate patterns, with a drying pronounced in the plains, and a slight moistening in the mountainous ar-eas (Fig. 4d, e and j, k). The trends simulated and observed during spring and autumn are smaller and barely significant, except in the Po plain where a drying is simulated by MAR
and in the north of Switzerland where a moistening is signifi-cant at some stations (Fig. 4d–j). Over the more recent period (1958–2010; Fig. 4c, f, i and l), the only significant signal is the strong drying found in the Po plain (p value < 0.05) in winter–spring–summer, when more heterogeneous trends are found in the mountains at the same time (not signifi-cant, p value > 0.05; non-significant trends are not masked in Fig. 4c, f, i and l). The main differences between the trends found over 1902–2010 and 1958–2010 are found in
win-ter, when the drying occurring in the Po plain is more pro-nounced and extends until the high-altitude areas during the more recent period (Fig. 4b and c). Also, a strong moistening is found in autumn, especially pronounced in the northwest-ern flank of the Alps. This signal occurred mainly over the last decades (Fig. 4k and l) but it is generally not significant (p value > 0.05, not shown).
The seasonal changes in precipitation simulated with MAR over the Alps are deeply related to the seasonal changes in moisture in the ERA-20C reanalysis used as boundary conditions (Fig. 5). The drying occurring in the Po Plain is related to a drying that occurred over a large part of the Mediterranean area, in particular over the French and the Italian Mediterranean coasts that propagate inland espe-cially during the summer, when southwestern winds trans-port moisture at the east of the continent (Fig. 5c). During the winter and the autumn, a moistening over Germany, Benelux and the north of France and Switzerland is related to an in-crease in western moisture fluxes that bring moisture from the Atlantic, in particular over the northern flank of the Alps (Fig. 5a–d). The coarse resolution of ERA-20C does not al-low for a fine estimation of the precipitation changes over the Alps, as it can be done with MAR, but conversely, it is shown here that the spatial features of the precipitation changes over the Alps produced with MAR are largely related to the large-scale moisture changes driven by the ERA-20C boundary conditions.
4.2 Wet spells
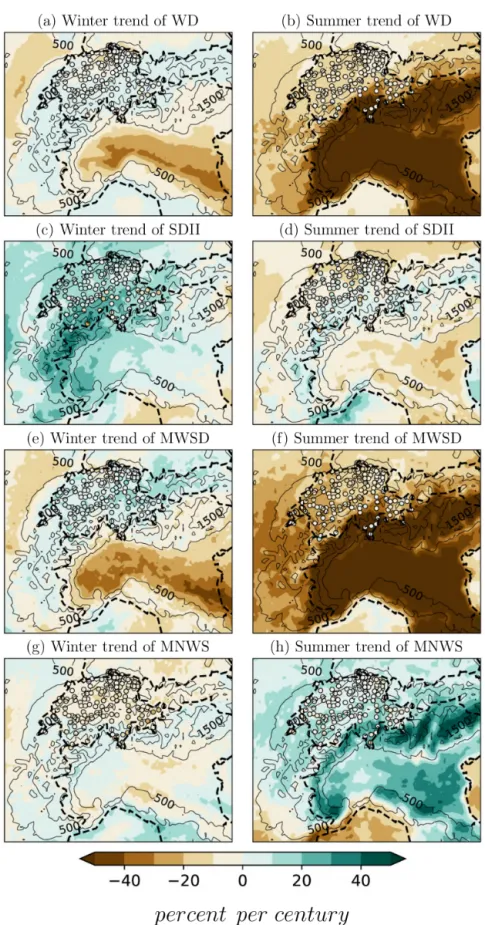
Changes in the wet spell features are highlighted in Fig. 6, showing the centennial summer and winter trends of WD (Fig. 6a and b), SDII (Fig. 6c and d), MWSD (Fig. 6e and f) and MNWS (Fig. 6g and h). In winter and over the Alps, the slight increase in WD, ranging between 0 % and 10 % per century, is slightly contributing to the increase in the STP (Fig. 6a), but this one is mainly explained by an increase in SDII by 10 % to 30 % per century (Fig. 6c). These changes are associated with an increase in MWSD by 10 % to 20 % per century (Fig. 6e). Finally, the winter trend in MNWS shows a different pattern from the previous ones (Fig. 6g), with a consistent decrease over the northern Alps and in par-ticular over Switzerland, ranging between 10 % and 20 % per century in both model and observational data. These changes suggest that the precipitation increase found in winter over the Alpine mountains is related to longer, more-intense and less-frequent wet spells. The agreement between the model and the observations is relatively good in winter. In summer, a large part of the drying is explained by a reduction in WD, reaching 10 % to 20 % in the northwestern flank of the Alps, and exceeding 40 % to 50 % per century in the southeast-ern Alps (Fig. 6b). The SDII shows smaller changes dur-ing this season (Fig. 6d) that can be either positive or neg-ative and barely exceed 10 % per century. A general decrease in MWSD is simulated in summer (Fig. 6f), especially
pro-nounced over the southeastern flank of the Alps and in the Po plain, which is a signal also found in the observations over Switzerland, albeit with a smaller magnitude. Finally, the model shows a general increase in MNWS (Fig. 6h) in sum-mer, which is particularly strong over the southeastern flank of the Alps. Over Switzerland, this signal is small and not consistent with the observations that show a minor reduction in MNWS. Overall, these results suggest that the decrease in the mean precipitation rates over the Alps in summer is ex-plained by a drastic reduction in WD, with shorter and more-frequent wet spells without any strong change in SDII. 4.3 Extreme precipitation
The means and the trends of extreme precipitation rates are described by considering Rx1day seasonally (Fig. 7) and an-nually (Fig. 8). Extreme precipitation shows contrasted sea-sonal and spatial climatological patterns (Fig. 7a, c, e and g). In winter and spring, it takes higher values over the south-ern Alps (both in France and in Italy) than in the northsouth-ern Alps (Fig. 7a–c). In summer, extreme values are smaller in the western Alps than in the eastern Alps. The most intense events are found in autumn, in both the western and the east-ern parts of the southeast-ern Alps, with averaged Rx1day values ranging between 50 and 70 mm d−1in many areas (Fig. 7g). Over Switzerland, the climatological pattern of Rx1day is consistent between the model and the observations, except for some local exceptions. In contrast with the trends of mean precipitation (Fig. 4), there is a general increase in Rx1day (Fig. 7b, d, f and h) that occurs during the four sea-sons and both in the plains and in the mountainous areas. The trend in the seasonal Rx1day over the period 1903–2010 takes values between 0 % and 40 % per century and gen-erally ranges between 20 % and 40 % per century over the Alpine mountain range. Such an increase in percentages sug-gests strong changes in local extremes, in particular in the regions where strong events are frequent in autumn (50 to 70 mm d−1, Fig. 7g). The magnitude of the change in Rx1day is similar between the model and the observations, but the MeteoSwiss station data show more heterogeneous spatial trends, with some locations where the trends can be small and even slightly negative. The mean increase in Rx1day over the model domain reaches 10 %, 10 %, 6 % and 13 % per century in winter, spring, summer and autumn, respectively, confirm-ing a general increase in Rx1day for all the seasons.
The climatological mean of the annual Rx1day (Fig. 8a) is dominated by the seasonal Rx1day computed in autumn that shows a similar pattern (Fig. 7g). Centennial Rx1day val-ues (Fig. 8b, maximum Rx1day computed over 1903–2010) show a pattern similar to the annual average of Rx1day. The strongest centennial events are found in the southern Alps, France and Italy, as well as in the Ticino valley in Switzerland, with extreme values locally reaching 250 to 300 mm d−1. The annual trends are inspected in Fig. 8c, highlighting a general increase in extreme precipitation. The
Figure 5. ERA-20C linear trends over 1902–2010 of vertically integrated moisture (shading, kg m−2per decade) and vertically integrated moisture flux (arrows, kg m−1s−1per decade). The rectangle highlights the domain of application of MAR.
significance of this trend is described in Fig. 8d, where non-significant trends (p value > 0.05) are masked. The annual samples considered here are obviously larger than the sea-sonal samples, allowing us to more efficiently detect signif-icant trends. In that case, a good consistency is found be-tween the model and the MeteoSwiss station, with both of them showing only positive trends, ranging between 20 % and 40 % per century, and covering large parts of the Alps and the Apennines.
4.4 Statistical significance of the trends
The large interannual-to-decadal variability of the climate in the Europe–North Atlantic region, in relation to internal cli-mate variability, makes precipitation trends challenging to detect in the Alps. When considering time series over 1971– 2008, i.e. a relatively short period, there is no clear ten-dency of the mean precipitation in the Alps (Fig. 3). By computing trends from the beginning of the 20th century, winter increase and summer decrease in mean precipitation emerge from interannual to decadal variability over large areas (Fig. 4). Similarly, the positive trends of the annual Rx1day values are significant (p value < 0.05) over large ar-eas of the Alps, in particular where the trends are positive and strong (i.e. > 10 % per century), whereas all the neg-ative and small trends in both the model data and the Me-teoSwiss station data are not significant (Fig. 8d). Figure 8e illustrates the trend of the annual Rx1day, considering the average of the MeteoSwiss data (purple), the model data av-eraged over Switzerland (blue) and the whole model domain
(red). In agreement with the patterns shown in Fig. 8c and d, the mean trend in the annual Rx1day in Fig. 8 is positive for both the model outputs and the observations, reaching 9.43, 8.74 and 8.40 mm d−1per century, respectively, for the Me-teoSwiss data, the model over Switzerland and the model over the whole domain. The vertical bars in Fig. 8e show the length of the time series required to identify a significant trend over the period 1903–2010, starting from 2010 and go-ing back into the past. Startgo-ing from 2010, the trends become significant (p value < 0.05) only when extending the time se-ries backward until 1961, 1932 and 1942 for the MeteoSwiss data, the model integrated over Switzerland and the model integrated over the whole domain, respectively, which corre-spond to length of time of ∼ 50 to ∼ 80 years. We nonethe-less see that shorter time series can lead to significant signals as evidenced in Fig. 8f, showing the p value computed to estimate the significant level of the trend. The three curves reach values below 0.05 during the years 1960–1970, high-lighting significant trends of Rx1day over 1960–2010 for the observations and over 1970–2010 for the model data. 4.5 Temperature and precipitation relationship
The potential relationship between Rx1day and tempera-ture trends is investigated in this section. On average over the MAR domain, the relationship between the Rx1day anomaly and the annual temperature anomaly is significant (p value < 0.05) and reaches a positive trend by 3.11 %◦C−1 (not shown). This value is smaller than the Clausius– Clapeyron relationship that reaches in theory 6 %◦C−1–
Figure 6. Winter and Summer 1903–2010 trends (% per century) of WD (a, b), SDII (c, d), MWSD (e, f) and MNWS (g, h) simulated by MAR (shaded) and locally observed in Switzerland (dots). WD is computed as a percentage of the available daily data for observations. Any station from the observational network that includes missing data is excluded when computing the trends.
Figure 7. Seasonal mean (mm d−1, a, c, e, g) and trends (% per century, b, d, f, h) over the period 1903–2010 of the seasonal Rx1day simulated by MAR (shaded) and locally observed in Switzerland (dots) for Winter (a, b), Spring (c, d), Summer (e, f) and Autumn (g, h).
Figure 8. Mean (a) and maximum (b) of the annual Rx1day (mm d−1) and its trend (% per century) including (c) and excluding (d) the areas where the p value is lower than 0.05, over 1903–2010. Annual Rx1day (e) and associated p value of the trend (f) over the same period averaged over the model domain (red for the entire Alpine region and blue for the Swiss domain only) and for the MeteoSwiss network (purple, average of the MeteoSwiss data station available over 1903–2010). The vertical bars in (e) highlight the year before which the p value never exceeds 0.05.
7 %◦C−1(Trenberth et al., 2003). It is also smaller than the value of 7.7 %◦C−1 reported by Scherrer et al. (2016) us-ing meteorological stations available in Switzerland over the last century. The increase in Rx1day intensity shows a strong spatial variability, with values ranging between 0 % and 40 % in the MAR simulation (Fig. 8a). Also, it occurred during all the seasons (Fig. 7), even when the seasonal mean of precip-itation is decreasing (Fig. 4).
An analysis of the relationship between temperature and strong precipitation is provided in Fig. 9 by superimposing
the areas where the increase in annual Rx1day is positive and significant (Fig. 9a) with other variables (hatching areas for Rx1day signal superimposed to other variables in Fig. 9b– f). The increase in Rx1day intensity is simulated both in ar-eas with a strong warming (e.g. Apennines) or a moderate one (e.g. over the Alps at high elevation; Fig. 9b). The tem-perature change during Rx1day is positive and strong in the Apennines in the western and northeastern parts of the Ital-ian Alps (up to 4◦C per century), whereas it shows smaller
Figure 9. Rx1day intensity trend (a), temperature trend (b), temperature trend during the Rx1day occurrence (c) and correlation between Rx1day and annual temperature (d). Mean (e) and trend (f) of the occurrence day of Rx1day over 1903–2010. In all the panels, the hatching highlights the areas where the Rx1day trend is positive and significant (p value < 0.05). Temperature increase and change in the convective versus total precipitation ratio are significant (p value < 0.05) everywhere, whereas the trend (f) of the occurrence day of Rx1day is not significant (p value > 0.05).
trends over the Jura (up to −4◦C per century, Fig. 9c). Nev-ertheless, the increase in the Rx1day intensity projects well onto the pattern correlation between Rx1day and the annual temperature (Fig. 9d). These findings suggest that warmer temperatures favour strong precipitation events at the annual timescale, but the lack of correlation between the trends in Rx1day and the trends in temperature (Fig. 9b) at the lo-cal slo-cale demonstrates that other processes than temperature changes affect Rx1day intensity. One of them is the shift in the seasonality of the occurrence of Rx1day. As shown in Fig. 9e, Rx1day occurs, on average, over 1902–2010, from July over the northern flank of the Alps (day 180 to 210) to August–September (day 210 to 270) over the southern flank of the Alps. In the Jura, the increase in Rx1day intensity is associated with a Rx1day shift from the summer to the au-tumn (+30 to +60 d, Fig. 9f). This explains the small and even negative centennial trend of temperature during Rx1day in this area (Fig. 9c). Conversely, the strong warming occur-ring in the southeastern flank of the Alps and over the Apen-nine is not associated with any clear change in the season-ality of Rx1day (Fig. 9f). Over Switzerland, Brönnimann et al. (2018) also suggested a shift in the seasonality of Rx1day. A similar finding is found here, but caution is required with this assumption since the shifts described in Fig. 9f are not significant (p value > 0.05). Rx1day positive trends are also simulated in areas with both limited warming and without any shift in the seasonality of Rx1day occurrence and in par-ticular in the Alps at high elevation (Fig. 9f). This suggests that other processes are probably at play, driving increases in Rx1day intensity.
5 Discussions and conclusions
Previous work highlighted a temperature increase in the Alps over the last century, associated with an increase in precipi-tation over the northern Alps in winter and a drying in sum-mer (Schmidli et al., 2002; Auer et al., 2007; Masson and Frei, 2014, 2016; Brugnara and Maugeri, 2019; Pavan et al., 2019). However, the detailed features of climate change over the Alps remain partly unknown, in particular because of the lack of observational data at high elevation and observational issues with snow precipitation. In addition, the large internal variability of the climate system, especially pronounced in Europe, may overwhelm long-term trends that remain chal-lenging to detect. Here, MAR has been used at a 7 km reso-lution over the Alps over the period 1900–2010 and laterally forced with the ERA-20C reanalysis. A comparison with sev-eral datasets (EURO4M, SPAZM, S2M, E-OBS, HISTALP and local MeteoSwiss data) demonstrates that the model is able to reproduce the climatological precipitation rates as well as both the interannual variability and the seasonal cy-cle of precipitation over the Alps. The high resolution used in the MAR experiment allowed for a relatively correct rep-resentation of the topography, with a large number of grid
cells covering elevations between 2000 and 3500 m, corre-sponding to areas with few available observations. The verti-cal gradient of precipitation averaged over the Alpine area is estimated to be 33 % km−1(1.21 mm d−1km−1) in summer and 38 % km−1 (1.15 mm d−1km−1) in winter, with values stronger in the northern Alps than in the southern Alps. The spatial variability of this vertical gradient is large, being af-fected by the local climate conditions.
The seasonal changes in precipitation simulated with MAR are largely related to changes in moisture fluxes found in the ERA-20C reanalysis at the European scale. The model experiment confirms an increase in precipitation during the winter over the northwestern Alps, above 500 m a.s.l., and significant and more pronounced above 1500 m a.s.l., with local values of 20 % to 30 % per century over the pe-riod 1903–2010. This increase in precipitation is mainly ex-plained by more-intense precipitation during wet days, and it is associated with longer albeit less-frequent wet spells, a result consistent with Schmidli and Frei (2005) over Switzer-land. The model reproduces the general drying that occurred in summer during the same period, exceeding 40 % to 50 % per century in the lowlands, whereas it is much smaller (< 10 % per century) and not significant above 1500 m a.s.l. This drying is not related to a decrease in the intensity of precipi-tation, but it is explained by a drastic reduction in the number of wet days, with shorter and more-frequent wet spells. It is consistent with previous work suggesting that the Alpine re-gion appears as an exception in a drying rere-gion, where con-vective precipitation increases locally, in relation to surface warming and sufficient moisture available in the soil at high-elevation areas (Giorgi et al., 2016). The precipitation trends diagnosed over the last decades (i.e. from ∼ 1960) differ from those described from the beginning of the 20th century. In particular, a strong moistening, albeit not significant, is found in autumn over most of the Alpine areas during the last decades and not over the last century. Furthermore, the dry-ing of the Po plain is more pronounced and extended north-ward and westnorth-ward during the winter, without a clear positive trend of precipitation at high elevation over the last decades during this season. The trends simulated over the last decades are consistent with recent studies based on observations cov-ering the last decades (e.g. Isotta et al., 2014; Pavan et al., 2019).
The model reproduces the observed climatological pat-terns of the seasonal maximum precipitation and in particu-lar the particu-large values occurring in the southern Alps in autumn, exceeding 50 and even 70 mm d−1 on average over the pe-riod 1903–2010. This result is consistent with the radar ob-servations described in Panziera et al. (2018), showing that the annual maximum of daily precipitation rates occurs dur-ing the autumn, whereas the annual maximum of hourly pre-cipitation occurs preferentially during the summer in rela-tion to convective events. Centennial daily events reaching 250 to 300 mm d−1are simulated in the southern Alps, both in France and in Italy, as well as in the Ticino valley. The
seasonal maximum of precipitation shows a general increase over the last century and during the four seasons, reaching values between 20 % and 40 % per century in the Alps. An increase in strong precipitation has been evidenced in previ-ous studies over the European Alps in relation to higher tem-perature and moisture rates in the atmosphere following the Clausius–Clapeyron relationship (e.g. Ban et al., 2015). A significant relationship between Rx1day intensity and warm-ing is also simulated over the Alps but with a smaller value reaching 3.11 %◦C−1. This relationship shows a strong spa-tial variability in the MAR experiment, suggesting that other processes can affect Rx1day changes. On one side, the dry-ing of the surface may act as a positive feedback enhanc-ing warmenhanc-ing signals, which has been identified as one of the causes of the Mediterranean amplification (Brogli et al., 2019). On the other hand, even with strong warming levels in place, Brönnimann et al. (2018) suggested a limited increase in Rx1day during the summer in the Alps due to moisture limitation. In their study, they pointed out a shift in this in-dex typically observed at the end of the summer toward early summer and early autumn. Albeit not significant, shifts of seasonality of Rx1day are also found in the MAR experi-ment, which complicates the relationship between tempera-ture and Rx1day. Nevertheless, the MAR experiment shows an increase in Rx1day both annually and for all seasons, and it is significant mainly over mountainous areas, a result con-sistent with the observations from Scherrer et al. (2016) and Brugnara et al. (2019). Further investigations are required to disentangle the different processes driving Rx1day changes and in particular the moisture availability in both the soil and the atmosphere at different layers. Following Doutreloup et al. (2019), who tested different convective schemes to simu-late precipitation with MAR, dedicated experiments based on different resolutions, including smaller ones to allow for the resolution of convective processes, could help to understand how strong precipitation events are affected by changes in convective precipitation, in particular for strong local events that cannot be simulated with the intermediate resolution used in this study.
In the MAR experiments, the trends of the seasonal max-ima of precipitation integrated over the Alps are significant (p value < 0.05) only when considering long time series, typ-ically 50 to 80 years depending on the area considered. Some of these trends are nonetheless significant when computed over recent decades, from the 1960s/1970s to the 2000s. This suggests a recent acceleration of the increase in extreme precipitation, whereas earlier periods with strong precipi-tation also occurred, in particular during the 1950s/1960s. These ones could be explained by internal climate variabil-ity and/or the non-linear response of the climate system to anthropogenic greenhouse gases and aerosols. In particular, the cooling related to aerosol forcing, which peaked during the 1970s/1980s (Koch et al., 2011) over Europe, could have masked the warming related to greenhouse gases and tem-porarily prevented changes in extreme precipitation. Further model investigations should be conducted to disentangle the variability of the Alpine climate related to internal variabil-ity and external forcings. This research is needed to antici-pate possibly strong precipitation changes in the Alps under global climate change.
Appendix A
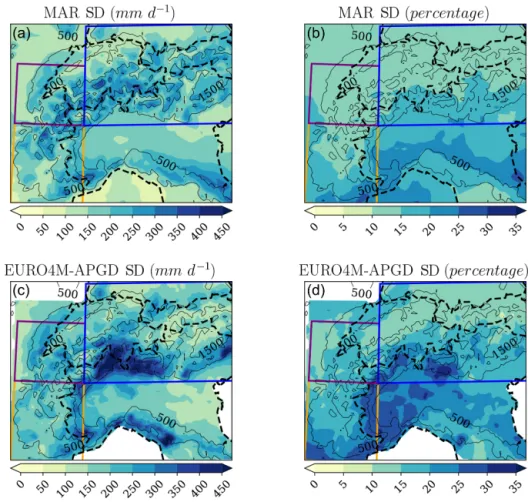
Figure A1. Standard deviation of annual precipitation over 1971–2008 (in mm d−1) (a, c) and (in %) (b, d) in the MAR experiment (a, b) and in the EURO4M-APGD dataset (c, d).
Data availability. MAR is accessible at https://gitlab.com/ Mar-Group (last access: 12 November 2020) (GitLab, 2020) and documented at http://mar.cnrs.fr/ (last access: 12 November 2020) (MAR, 2020). The outputs of the MAR experiment used in this study can be downloaded at https://doi.org/10.5281/zenodo.3674607 (Ménégoz et al., 2020). The HISTALP data are available at http://www.zamg.ac.at/histalp/ (last access: 12 November 2020) (Auer et al., 2007). Alpine Pre-cipitation Grid Dataset (EURO4M-APGD), Version 1, is available online at https://doi.org/10.18751/Climate/Griddata/APGD/1.0 (Isotta et al., 2014). ECA&D data can be downloaded at https://www.ecad.eu//download/ensembles/ensembles.php (last ac-cess: 12 November 2020) (Cornes et al., 2018). S2M data are avail-able online on the AERIS platform at https://doi.org/10.25326/37 (Vernay et al., 2019). The SPAZM dataset has been provided by EDF and Météo-France for this research. It could be made available to other researchers under a specific research agreement. Requests should be sent to dtg-demandedonnees-hydro@edf.fr.
Author contributions. All authors contributed to design the study. XF, MM and JB ran MAR experiments and produced the figures. MM wrote the article and other authors contributed with suggested changes and comments.
Competing interests. The authors declare that they have no conflict of interest.
Acknowledgements. The authors thank the providers of obser-vational datasets. The figures have been produced with the python package basemap (https://matplotlib.org/basemap/, last ac-cess: 12 November 2020). The authors thank the three referees for their useful comments and the editor for the efficient management of the review process.
Financial support. As part of the project CDP TRAJECTORIES, this work is funded by the French National Research Agency in the framework of the “Investissements d’avenir” programme (ANR-15-IDEX-02). The training period of Evgenia Valla was funded by the ERASMUS programme and the VATEX project funded under the programme Labex OSUG@2020 (ANR10 LABX56). The authors thank the “Institut du Développement et des ressources en Informa-tique scientifique” (IDRIS, CNRS, project no. A0080101523) and the GRICAD project (https://gricad.univ-grenoble-alpes.fr/, last ac-cess: 12 November 2020) for providing computer time for the sim-ulations presented in this paper.
Review statement. This paper was edited by Nadav Peleg and re-viewed by Federico Grazzini and two anonymous referees.
References
Agosta, C., Amory, C., Kittel, C., Orsi, A., Favier, V., Gallée, H., van den Broeke, M. R., Lenaerts, J. T. M., van Wessem, J. M., van de Berg, W. J., and Fettweis, X.: Estimation of the Antarctic surface mass balance using the regional climate model MAR (1979–2015) and identification of dominant pro-cesses, The Cryosphere, 13, 281–296, https://doi.org/10.5194/tc-13-281-2019, 2019.
Amory, C., Trouvilliez, A., Gallée, H., Favier, V., Naaim-Bouvet, F., Genthon, C., Agosta, C., Piard, L., and Bellot, H.: Compar-ison between observed and simulated aeolian snow mass fluxes in Adélie Land, East Antarctica, The Cryosphere, 9, 1373–1383, https://doi.org/10.5194/tc-9-1373-2015, 2015.
Auer, I. and Böhm, R.: Combined temperature-precipitation vari-ations in Austria during the instrumental period, Theor. Appl. Climatol., 49, 161–174, 1994.
Auer, I., Böhm, R., Jurkovic, A., Lipa, W., Orlik, A., Potzmann, R., Schöner, W., Ungersböck, M., Matulla, C., Briffa, K., and Jones, P.: HISTALP – historical instrumental climatological sur-face time series of the Greater Alpine Region, Int. J. Climatol., 27, 17–46, 2007.
Ban, N., Schmidli, J., and Schär, C.: Evaluation of the convection-resolving regional climate modeling approach in decade-long simulations, J. Geophys. Res.-Atmos, 119, 7889–7907, https://doi.org/10.1002/2014JD021478, 2014.
Ban, N., Schmidli, J., and Schär, C.: Heavy precipitation in a changing climate: Does short-term summer precipitation in-crease faster?, Geophys. Res. Lett., 42, 1165–1172, 2015. Bartolini, E., Claps, P., and D’Odorico, P.: Interannual variability
of winter precipitation in the European Alps: relations with the North Atlantic Oscillation, Hydrol. Earth Syst. Sci., 13, 17–25, https://doi.org/10.5194/hess-13-17-2009, 2009.
Bechtold, P., Basile, E., Guichard, F., Mascart, P., and Richard, E.: A mass flux convection scheme for regional and global models, Q. J. Roy. Meteorol. Soc., 127, 869–886, 2001.
Beniston, M.: Mountain weather and climate: a general overview and a focus on climatic change in the Alps, Hydrobiologia, 562, 3–16, 2006.
Beniston, M., Farinotti, D., Stoffel, M., Andreassen, L. M., Cop-pola, E., Eckert, N., Fantini, A., Giacona, F., Hauck, C., Huss, M., Huwald, H., Lehning, M., López-Moreno, J.-I., Magnusson, J., Marty, C., Morán-Tejéda, E., Morin, S., Naaim, M., Proven-zale, A., Rabatel, A., Six, D., Stötter, J., Strasser, U., Terzago, S., and Vincent, C.: The European mountain cryosphere: a review of its current state, trends, and future challenges, The Cryosphere, 12, 759–794, https://doi.org/10.5194/tc-12-759-2018, 2018. Brogli, R., Kröner, N., Sørland, S. L., Lüthi, D., and Schär, C.:
The Role of Hadley Circulation and Lapse-Rate Changes for the Future European Summer Climate, J. Climate, 32, 385–404, https://doi.org/10.1175/JCLI-D-18-0431.1, 2019.
Brönnimann, S., Rajczak, J., Fischer, E. M., Raible, C. C., Rohrer, M., and Schär, C.: Changing seasonality of moder-ate and extreme precipitation events in the Alps, Nat. Hazards Earth Syst. Sci., 18, 2047–2056, https://doi.org/10.5194/nhess-18-2047-2018, 2018.
Brugnara, Y. and Maugeri, M.: Daily precipitation variability in the southern Alps since the late 19th century, Int. J. Climatol., 39, 3492–3504, https://doi.org/10.1002/joc.6034, 2019.