HAL Id: hal-01986522
https://hal.archives-ouvertes.fr/hal-01986522
Submitted on 5 Mar 2019
HAL is a multi-disciplinary open access
archive for the deposit and dissemination of
sci-entific research documents, whether they are
pub-lished or not. The documents may come from
teaching and research institutions in France or
abroad, or from public or private research centers.
L’archive ouverte pluridisciplinaire HAL, est
destinée au dépôt et à la diffusion de documents
scientifiques de niveau recherche, publiés ou non,
émanant des établissements d’enseignement et de
recherche français ou étrangers, des laboratoires
publics ou privés.
Quality Control Using Machine Vision and Multiclass
SVM Classifier
Aubain Yro, Camille Edié N’zi, Kidiyo Kpalma
To cite this version:
Aubain Yro, Camille Edié N’zi, Kidiyo Kpalma. Cocoa Beans Fermentation Degree Assessment For
Quality Control Using Machine Vision and Multiclass SVM Classifier. International Journal of
Inno-vation and Applied Studies, ISSR Journals, 2018, 24 (4), pp.1711-1717. �hal-01986522�
1
Cocoa Beans Fermentation Degree Assessment For Quality Control Using
Machine Vision and Multiclass SVM Classifier
YRO Aubain1, N’ZI Edié Camille2, KPALMA Kidiyo3
1
Electronique et Electricité Appliquées, Institut National Polytechnique Félix Houphouët-Boigny,
[email protected], Yamoussoukro, Côte d’Ivoire
2
Electronique et Electricité Appliquées, Institut National Polytechnique Félix Houphouët-Boigny, Yamoussoukro, Côte d’Ivoire
3
Institut d'Electronique et Télécommunications, Institut National des Sciences Appliquées, 20 avenue des Buttes de Coësmes CS 70839 - 35 708 Rennes Cedex 7, FRANCE
Abstract
Traditionally, a cut-test is used to assess the cocoa fermentation degree for a quality control aims. However, this method is subjective and presents several drawbacks. In this paper, a reliable machine vision system was proposed to automatically identify and classify cocoa beans (Theobroma cacao L.). The approach developed in this study uses color features and a support vector machine-based method for cocoa beans classification according to the fermentation degree. To outline this approach, firstly, images were acquired, and beans were separately identified from the background. After that, color features were extracted in each component of RGB, HSV and YCbCr color spaces and were used to describe cocoa beans fermentation degree. Then, a selection procedure of the best cocoa beans descriptor combination was developed. Finally, SVM model was built to discriminate unfermented, partly fermented and well fermented cocoa beans. This model was 10-fold cross-validated to ensure its stability. Using selected descriptors, our approach had a discrimination rate of 100% in both training and prediction set. The results show that, machine vision system coupled with SVM model can rapidly, accurately, and reliably discriminate cocoa beans according to the fermentation degree compared to the traditional classification methods.
Keywords: Cocoa beans, fermentation, classification, machine vision, SVM.
Corresponding Author: YRO Aubain, [email protected]
1. INTRODUCTION
Before any processing into finished products, the cocoa beans must undergo a post-harvest treatment. Fermentation is one of the most important operations of this process [1] because it improves the final quality of the product and the processors always demand cocoa beans being well fermented, as it assures the development of the aroma precursors and the cocoa flavor [2]. According to [3], the degree of fermentation is strongly correlated with cocoa quality attributes such as reducing sugars, free amino acids and bean pH. Likewise, a good fermentation contributes to the reduction of bitterness and astringency of cocoa.
Generally, a « cut test » is used to assess fermentation degree of a cocoa bean bulk [4]. It consists in cutting a bean lengthwise and visually analyzing its internal color in the day light. At the end of this analysis, the beans are divided according to their degree of fermentation into three different classes: the well-fermented beans (WF) are characterized by the brown color while the violet and slatey colors indicate respectively partially fermented beans (PF) and unfermented (UF) [3]. In each class, the beans are counted and then their percentage is estimated according to 300 beans examined. This visual classification system is the standard method currently used to evaluate the quality and acceptability of marketable cocoa. However, this approach is qualitative, tedious and quite subjective. Lopez et al. [5] also noted that it is very limited in the evaluation of defects and color of cocoa beans. In addition, it can be inefficient for large volumes of cocoa beans because of human errors.
2
To overcome these limitations, other quality control methods such as spectrophotometry [6], high performance liquid chromatography, Fourier transform infrared spectroscopy [7] and imaging [1] have been proposed. However, even if all these methods of analysis are reliable and precise, they are time consuming, laborious, expensive and require more expertise. Such systems cannot be used for routine checks on the quality of commercial cocoa beans. Therefore, a quick and reliable method is essentially required to classify cocoa beans for quality control.
Computer vision has emerged in recent years as a reliable technology in the assessment of the quality of agricultural and food products [8], [9]. Machine vision combines image analysis and machine learning techniques to provide automated inspection [1]. It is more economical, quick, reliable, and non-destructive [2]. Computer vision systems have been used successfully for quality control of products such as apples [10], rice [11] and tomatoes [12].
The aim of this study is to propose a simple, rapid and reliable system based on artificial vision for the automatic classification of cocoa beans. In this approach, the cocoa bean image was first isolated from the whole image background. Next, color descriptors were calculated on each color component of cocoa image. Indeed, as previously mentioned, color is the main attribute used to discriminate different fermentation levels of cocoa beans. RGB, HSV and YCbCr color spaces were used in this study. Then, we proposed a selection procedure of the optimal fusion descriptors to discriminate cocoa beans. Finally, a Support Vector Machines (SVM) model was built for the cocoa bean classification.
The paper is organized as follow. Machine vision based cocoa beans classification method is presented in section 2. Then, experimental results are provided in section 3. Finally, section 4 concludes and gives perspectives for future work.
2. MATERIELS AND METHOD
2.1. COCOA BEANS SAMPLE PREPARATION
The cocoa pods were procured for the study from Bongouanou, Côte d’Ivoire on January 2018. All the cocoa samples analyzed were of Forastero variety. The ripe pods were opened; and the beans were removed, fermented and sun-dried.
Cocoa beans fermentation process was carried out according to producer usual practice. Every two days, they were stirred and after six days all the beans were sundried. The moisture content of the dried beans was approximately in range 7.5-8%.
For this experiment, 1000 beans were randomly selected and a cut-test was performed by a quality control expert. Thus, the beans sample were classified into three different classes according to cocoa fermentation level (Fig.1).
After the analysis, 50 beans were selected for each fermentation class previously defined. Then, in order to form a set of 150 image samples, an image of each bean was also acquired using the system described in section 2.2. This set was randomly divided into two groups. The training set which contained 90 samples were used to build the discrimination model. The remaining 60 beans were used as a validation set to predict the performance of the fitted model. Table 1 shows the number of cocoa beans samples used for training and validation sets.
2.2. IMAGES ACQUISITION
In this study, a machine vision system was developed to assess fermentation level of cocoa bean samples. The image acquisition was done using a color GigE Vision camera (SONY XCG-5005C, 2/3-type, CCD sensor,
(c) (b)
(a)
Fig.1. Different fermentation level of cocoa beans: (a) unfermented bean, (b) partly fermented bean and (c) well fermented bean
3
2448x2048 spatial resolution, China), mounting an appropriate lens (Fujifilm corporation, model HF16HA-1B, f = 16 mm F1.4-F16, 2/3” color camera, Japan). Each capture has 512x512 pixels and encoded on 8 bits per channel in RGB color space. The GigE Vision dedicated acquisition board was used to transfer camera information to the
Table 1
Number of cocoa samples used for training and detection sets. Cocoa
beans Samples per each fermentation level Training validation Total
Unfermented Partly fermented Well-fermented Training validation Training Validation Training validation Number
of beans
30 20 30 20 30 20 90 60 150
HP computer (Core-i5, 2.8 GHz, 8 GB). Two white-light LEDs (18 W), placed on either side of the camera, were used to illuminate the object placed on a blue background at 50 cm away from the camera lens.
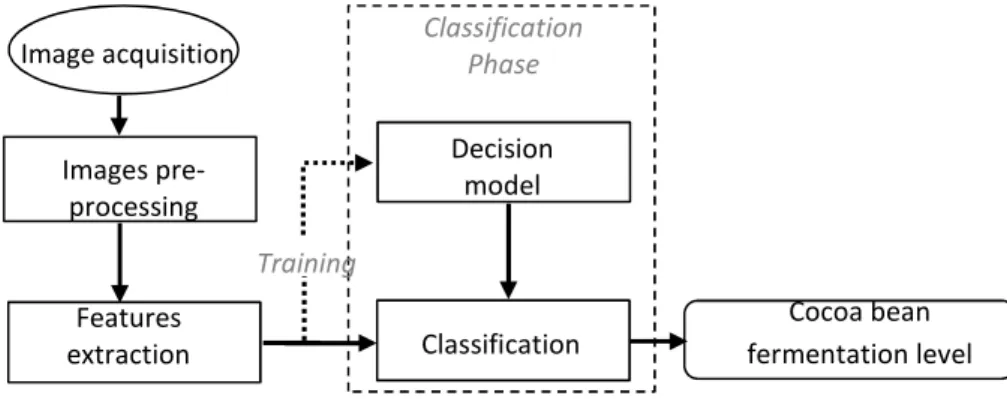
An overview of the machine vision based method for cocoa beans fermentation level assessment is shown in Fig. 2 and the following subsections discuss the details of this method.
2.3. IMAGES PRE-PROCESSING
This step consists of noise removal and image segmentation (Fig.3).
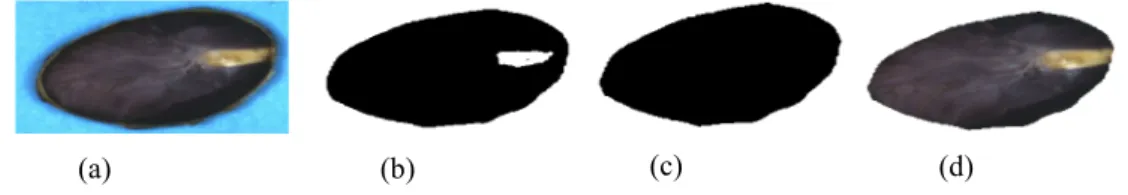
In order to reduce the noise due to acquisition conditions, a median filter was applied. Then, an unsupervised segmentation method was used to extract the cocoa bean from their background. For this, Otsu’s algorithm [13] was used to create a bit mask in which the background is 0 and the object is 1. Otsu’s method is based on the study of the variance of the grayscale to search automatically a threshold value that separates the pixels belonging to the background from those of the object. Subsequently, the holes in the mask obtained [9] previously were filled by applying a morphological opening. Finally, the logical AND operation between the mask and the original image was used to isolate the bean from its background. Thresholding algorithm was implemented in the value component of HSV color space. The segmentation process is shown in Fig.4.
Fig. 3. Segmentation flow chart of a cocoa bean
Otsu's thresholding Cocoa bean sample image
Convert RGB image to HSV
image median filtering
Morphological opening Segmented image Decision model Images pre-processing Features extraction Classification Cocoa bean fermentation level Classification Phase Image acquisition Training
4
2.4. FEATURES EXTRACTION
2.4.1. EXTRACTING COLORS DESCRIPTORS
Color changes ranging from purple to brown have been reported during the cocoa beans fermentation process. Thus, colors are used as measures of fermentation degree. In this study, color features of beans are quantified as the descriptors for classifying cocoa beans with different fermentation stages. The Eq. 1 to 6 [9] were applied to calculate the mean, variance, skewness, kurtosis, entropy and energy on each image color component and then, they were concatenated in order to generate a feature vector for each cocoa beans image.
However, color images are exposed as different forms in different color spaces [14]. For this reason, descriptors extracted from RGB, HSV and YCbCr color spaces were evaluated.
RGB space is a widely used color space for image display. It is composed of three color components: red, green and blue. Generally, other color spaces are derived from the RGB space considered as the basic color space [14]. All our images are acquired in this standard system.
HSV space is frequently used in computer graphics. It is more closely related to the human perception of colour than RGB color space. The three color components are hue, saturation and value. In order to convert RGB to HSV colour space rgb2hsv function in MATLAB 2017a can be used.
YCbCr is a family of color spaces used in video systems. Y is the luminance component and Cb and Cr the blue and red chroma components. To convert RGB to YCbCr colour space, rgb2ycbcr function in MATLAB 2017a can be used. 0 ( ) N k m ea n kp k = =
∑
2 0 v arian ce ( ) ( ) N k k µ p k = =∑
− 3 3 0 2 1 ( ) ( ) variance N k skew ness k µ p k = =∑
− 4 1 0 2 1 ( ) ( ) v a r N k k u r to s is k µ p k = =∑
− 0 ( ) ln ( ( )) N k e n tr o p y p k p k = = −∑
2 0 [ ( )] N k e n e rg y p k = =∑
Where p(k) is the relative frequency of a gray level k and N is the total number of gray levels in the image.
2.4.2. EFFECTIVES DESCRIPTORS SELECTION
In general, the performance of color image classification model depends on the set of selected descriptors. Thus, statistical methods, such as Principal Component Analysis (PCA), are applied to determine a subset containing the maximum image information from a set of descriptors[15]. Our approach differs from that commonly used selection process. We aim to evaluate several descriptor vectors separately in order to select the best vector as the input descriptor to generate the final model. Therefore, we propose to construct and to
(d) (c)
(a) (b)
Fig. 4. Segmentation process: (a) Original image, (b) Otsu’s thresholding, (c) Morphological opening, (d) segmented image
(5) (6) (1) (2) (3) (4)
5
select a descriptor vector of cocoa beans fusing colors features defined on one or more color spaces previously described.
For convenience, descriptor vector was defined in each color space. Then, to train the discrimination model, different descriptor vector combinations were evaluated. First, a descriptor vector was selected and 10-fold cross-validated. Then it is combined with other descriptor vectors and the whole was evaluated once more. Finally, the best combination is the one with the highest accuracy.
2.5. DECISION MODEL DEVELOPMENT
Support Vector Machine (SVM) based-model were developed for classifying cocoa beans using color descriptors. SVM is a binary classification method by supervised learning. It was introduced by Vapnik in 1995 [16]. SVM model works to find a linear hyperplane that separates data and maximizes the distance between the two classes. It selects the hyperplane that maximizes the margin. Therefore the problem of optimization under the following constraints is to be deduced [17]:
m in , , ( T ) 1 i i w i y w x b ∀ + ≥
When the data are not linearly separable, the variables C and
ξ
=
{ ,
ξ ξ
1 2,..., }
ξ
n are introduced to soften the constraints (Eq.8). In this case, a kernel function is used to transform the space of the input data into a larger space in which it is possible to find a separating hyperplane [18]:2 1 1 min 2 0 subject to , ( ) (1 ) N i I i T i i w C i y w x b ξ ξ ξ = + ≥ ∀ + ≥ −
∑
In this study, multiclass SVM classifier with radial basis function kernel were used. This classifier was developed using an open source library LIBSVM [19]. The margin and kernel parameters of the classifiers were determined using grid search and 10-fold cross-validation.
3. RESULTS AND DISCUSSION
In order to test classifier system, 90 cocoa beans images were used from a total of 150 images. The remaining 60 beans were used as validation set to predict the performance of the fitted model.
3.1.1. EFFECTIVE DESCRIPTOR SELECTION
Seven descriptor vector combinations were performed from three colors spaces to implement model for cocoa beans classification based on colors features measurement. Then, each of them was 10-fold cross-validated for selecting the most effective descriptor vector. This process has been run 20 times in order to increase the number of estimates. Table 2 presents the descriptor vectors as well as the number of features used to select the most discriminative descriptors and the obtained cross-validation (CV) accuracy. We notice that descriptors vectors HSV, HSV+YCbCr and RGB+HSV+YCbCr containing respectively 18, 36 and 54 features get higher CV accuracy. Therefore, these features vectors were used as final discriminative vectors to train the whole training set and generate the final classification model.
Table 2.
Results of the most discriminative features selection using 10-fold cross-validation
Descriptors vectors Number of features CV accuracy (%)
RGB 18 95,56 HSV 18 100 YCbCr 18 96,67 RGB + HSV 36 96,67 RGB + YCbCr 36 98,89 HSV + YCbCr 36 100 RGB + HSV +YCbCr 54 100 (9) (7)
6
3.1.2. CLASSIFICATION
After selecting the most discriminative descriptors, classification was performed using each of them in order to compare the results obtained. Table 3 shows the results of cocoa bean classification using SVM classifier coupled with color features extracted in three color spaces.
Table 3.
Results of cocoa bean classification using SVM classifier coupled with different combination of color features extracted in RGB, HSV and YCbCr color spaces.
Descriptors vectors Number of features
Discrimination result
Recognition rate (%) Accuracy rate (%)
RGB 18 97,78 96,67 HSV 18 100 100 YCbCr 18 98,89 98,33 RGB + HSV 36 100 100 RGB + YCbCr 36 98,89 98,33 HSV + YCbCr 36 100 100 RGB + HSV +YCbCr 54 100 100
It can be noted that the classifier system using selected descriptor had a discrimination rate of 100% as well for the recognition as for the prediction. Furthermore, through the analysis of table 3, we notice that the classifier system with the inputs selected descriptors by 10-fold cross validation have a higher classification accuracy than the others descriptors.
As can be seen, the descriptors extracted from the HSV color space are more discriminating than those calculated from the RGB and YCbCr color spaces. In general, combinations of descriptors extracted from several color spaces significantly improve the classification results of cocoa beans. These results show that the method proposed in this article is robust to classify cocoa bean samples according to fermentation degree with an accuracy of 100% in both raining and validation set.
4. CONCLUSION
In this study, a computer vision system was proposed for the classification of cocoa beans according to their fermentation degree. This classification system is based on supervised learning techniques known as vector support machine (SVM). First, the bean images were acquired and then segmented to separate them from the background of the image. Once the images were identified, the color features were extracted from RGB, HSV and YCbCr spaces. Then we proposed a selection procedure of the best discriminative descriptors vector. Finally, SVM model used the selected descriptors to classify cocoa beans according to the fermentation degree. The results of this study showed that the machine vision system coupled with SVM model can be used for the classification of cocoa beans.
Acknowledgements
This work was funded by the Strategic Support Program for Scientific Research of Côte d’Ivoire (PASRES-CI).
References
[1] N. León-Roque, M. Abderrahim, L. Nuñez-Alejos, S. M. Arribas, et L. Condezo-Hoyos, « Prediction of fermentation index of cocoa beans (Theobroma cacao L.) based on color measurement and artificial neural networks », Talanta, vol. 161, p. 31 39, déc. 2016.
[2] M. Barel, Qualité du cacao: l’impact du traitement post-récolte. Editions Quae, 2013.
[3] E. Teye et al., « Estimating cocoa bean parameters by FT-NIRS and chemometrics analysis », Food Chem., vol. 176, p. 403–410, 2015.
[4] J. E. Kongor, J. F. Takrama, A. S. Budu, H. Mensah-Brown, et E. O. Afoakwa, « Effects of fermentation and drying on the fermentation index and cut test of pulp pre-conditioned Ghanaian cocoa (Theobroma cacao) beans », J. Food Sci. Eng., vol. 3, no 11, p. 625, 2013.
7
[5] L. A.S et D. P.S, « Cocoa fermentation, in: Biotechnology: A Comprehensive Treatise », Enzymes, Biomass,
Food and Feed, p. 563 577, 1995.
[6] K. B. Gourieva et O. . Tserrevitinov, « Method of evaluating the degree of fermentation of cocoa beans »,
USSR Patent, 1979.
[7] E. Teye, X. Huang, H. Dai, et Q. Chen, « Rapid differentiation of Ghana cocoa beans by FT-NIR spectroscopy coupled with multivariate classification », Spectrochim. Acta. A. Mol. Biomol. Spectrosc., vol. 114, p. 183– 189, 2013.
[8] D. Mery, F. Pedreschi, et A. Soto, « Automated design of a computer vision system for visual food quality evaluation », Food Bioprocess Technol., vol. 6, no 8, p. 2093–2108, 2013.
[9] V. Muracciole, « DEFINITION ET MISE EN PLACE D’UN OUTIL TEMPS REEL D’ANALYSE DES CARACTERISTIQUES PHYSIQUES DES SEMENCES SECHES », UNIVERSITE D’ANGERS, ANGERS, 2009.
[10] A. Mizushima et R. Lu, « An image segmentation method for apple sorting and grading using support vector machine and Otsu’s method », Comput. Electron. Agric., vol. 94, p. 29–37, 2013.
[11] C.-L. Chung, K.-J. Huang, S.-Y. Chen, M.-H. Lai, Y.-C. Chen, et Y.-F. Kuo, « Detecting Bakanae disease in rice seedlings by machine vision », Comput. Electron. Agric., vol. 121, p. 404 411, févr. 2016.
[12] P. Wan, A. Toudeshki, H. Tan, et R. Ehsani, « A methodology for fresh tomato maturity detection using computer vision », Comput. Electron. Agric., vol. 146, p. 43 50, mars 2018.
[13] N. Otsu, « A Threshold Selection Method from Gray-Level Histograms », EEE Transactions on Systems,
Man, and Cybernetics, p. 62 66, 1979.
[14] S. Sabzi, Y. Abbaspour-Gilandeh, et H. Javadikia, « Machine vision system for the automatic segmentation of plants under different lighting conditions », Biosyst. Eng., vol. 161, p. 157 173, sept. 2017.
[15] N. El-Bendary, E. El Hariri, A. E. Hassanien, et A. Badr, « Using machine learning techniques for evaluating tomato ripeness », Expert Syst. Appl., vol. 42, no 4, p. 1892 1905, mars 2015.
[16] V. N. Vapnik, Statistical learning theory, Wiley. New York, 1998.
[17] A. Djeffal, H. E. Rais, et M. C. Babahenini, « Un système de tri automatique des dattes par SVM 1vsR », Rev.
Sci. Technol., vol. 3, 2012.
[18] L. Wang, « Support Vector Machines: Theory and Applications », Springer, 2005.
[19] C.-C. Chang et C.-J. Lin, « A Library for Support Vector Machines », National Taiwan University, Taipei,