HAL Id: cea-02528391
https://hal-cea.archives-ouvertes.fr/cea-02528391
Submitted on 1 Apr 2020
HAL is a multi-disciplinary open access
archive for the deposit and dissemination of
sci-entific research documents, whether they are
pub-lished or not. The documents may come from
teaching and research institutions in France or
abroad, or from public or private research centers.
L’archive ouverte pluridisciplinaire HAL, est
destinée au dépôt et à la diffusion de documents
scientifiques de niveau recherche, publiés ou non,
émanant des établissements d’enseignement et de
recherche français ou étrangers, des laboratoires
publics ou privés.
defluorination reactions on single-walled carbon
nanotubes
Pierre Marcoux, Joachim Schreiber, Patrick Batail, Serge Lefrant, Joel
Renouard, Guy Jacob, David Albertini, Jean-Yves Mevellec
To cite this version:
Pierre Marcoux, Joachim Schreiber, Patrick Batail, Serge Lefrant, Joel Renouard, et al.. A
spec-troscopic study of the fluorination and defluorination reactions on single-walled carbon nanotubes.
Physical Chemistry Chemical Physics, Royal Society of Chemistry, 2002, 4 (11), pp.2278-2285.
�10.1039/B109770A�. �cea-02528391�
A spectroscopic study of the fluorination and defluorination reactions on
single-walled carbon nanotubes
Pierre R. Marcoux,*
aJoachim Schreiber,
bPatrick Batail,
aSerge Lefrant,
bJoël Renouard,
cGuy Jacob,
cDavid Albertini,
bJean-Yves Mevellec.
ba
CNRS FRE 2068, Institut des Matériaux Jean Rouxel, 2 rue de la Houssinière, 44322 Nantes cedex 3, France.
Fax: +33(0) 2 40 37 39 95 ; Tel: +33(0) 2 40 37 39 18 ; E-mail: Pierre.Marcoux@cnrs-imn.fr
b
CNRS UMR 6502, Institut des Matériaux Jean Rouxel, 2 rue de la Houssinière, 44322 Nantes cedex 3, France.
cSNPE, Centre de Recherches du Bouchet, rue Lavoisier, BP 2, 91710 Vert-le-Petit, France.
This submission was created using the RSC Article Template (DO NOT DELETE THIS TEXT)
(LINE INCLUDED FOR SPACING ONLY - DO NOT DELETE THIS TEXT)
The purpose of manipulating isolated single-wall carbon nanotubes (SWNTs), rather than bundles, has led to an active research in the field of the functionalisation of such carbon compounds. Different ways exist today to obtain some new soluble macromolecules from SWNTs. Here we focus on the fluorination functionalisation. As the solubility properties depend essentially on the functionalisation degree, it is important to develop reliable and simple methods to quantify this degree. The CnF stoichiometry of three different
fluorinated SWNTs samples are determined with the X-Ray Photoelectron Spectroscopy (XPS). Then the evolution of the Raman spectra with the fluorination degree of these samples is discussed. An atomic force microscopy (AFM) study highlights the good solvation properties of the most fluorinated sample with a majority of isolated nanotubes being observed. Then we take advantage of these good solvation properties, combined with the possibility of recovering the pristine non-fluorinated nanotubes, to carry out surface enhanced Raman spectroscopy (SERS) studies of well-dispersed SWNTs. These studies put in evidence the bundle effect, which is due to the agglomeration of SWNTs into bundles. This effect can be readily observed by Raman spectroscopy.
1 Introduction
With novel structural, electronic, and mechanical properties,1,2
single-walled carbon nanotubes (SWNTs) constitute an important new form of carbon compounds that may find applications in many fields.3 The aim of getting some true
solutions, rather than metastable suspensions, has led to functionalisation of SWNTs. Functional groups are covalently attached to the sidewalls to (i) prevent the aggregation of SWNTs into bundles (due to van der Waals attractive interactions) and (ii) favor their solubilisation in organic solvents. End-group functionalisation of shortened SWNTs allowed first the preparation of stable organic solutions of nanotubes.4,5,6 Then the fluorination of the nanotubes sidewalls
led to a high degree of solvation in a variety of heavy alcohols.7
As a matter of fact, the repulsive interactions between the covalently grafted fluorine prevent the aggregation into bundles. Secondly, the hydrogen bonds between fluorine and alcoholic protons causes a better solvation. While the obtained solutions are metastable, they persist long enough to permit a solution-phase chemistry to be carried out on the fluorotubes. Sidewall derivatisation (alkylation by nucleophilic substitution) of fluorotubes led to soluble tubes in various organic solvents.8 The
advantages of fluorination as a derivatisation process are actually manyfold : i) the manipulated tubes are not shortened and are isolated ; ii) fluorination of nanotubes is given for a reversible process ; iii) fluorotubes are the starting point of various derivatisations by the way of nucleophilic substitutions. The sidewall functionalisation of small-diameter nanotubes via electrochemical reduction of an aryl diazonium salt has been recently described.9 Because of the variety of available aryl
diazonium salts this technique is promising but has not led to soluble nanotubes yet, presumably due to a low degree of functionalisation.
Here we report a method to determine the fluorination stoichiometry CnF of single-wall carbon nanotubes based on
X-Ray Photoelectron Spectroscopy (XPS). Then, increasing amounts of sidewall derivatisation may be correlated to a consistent evolution of the Raman spectra of the fluorotubes. In addition, the availability of discrete fluorotubes dispersed on
rough metal surfaces has allowed for a Surface Enhanced Raman Spectroscopy (SERS) study of well-dispersed SWNTs.
2 Experimental section
2.1 Fluorination
SWNTs were bought from Tubes@Rice (Rice University, Houston, TX). The method by which these tubes were prepared is based on the pulsed laser vaporisation method. This method was first developed in Prof. Smalley’s laboratory,10 and has been
described in detail.11 The method produces a ‘felt’ of material,
consisting of 40-50 % vol. of SWNTs with the remainder being largely amorphous carbon and residual catalyst particles (Ni and Co). This raw material is then treated with a 12-hour 2.6 M nitric acid reflux, followed by rinsing in pH 8.0 water, centrifugation, extraction with toluene, and a final filtration. The resulting material consists of greater than 90 % weight of SWNTs, with the principal impurity being Ni/Co catalyst particles, 3-15 nm diameter, overcoated with a thin onion-like layer of graphitic carbon. It was sold as a water suspension, stabilised with a non-ionic surfactant (Triton X-100). These nanotubes were first filtered over a Teflon membrane (Sartorius, 1 µm) and washed with methanol to remove the surfactant. This washed sample is labelled TR1.
An ethanolic suspension of TR1 was slowly evaporated in a quartz tube, so as to depose a coating of nanotubes on the inner quartz walls. This coating was then vacuum baked at 1250°C under 3.5×10⁻⁸ bar for 17 h, in order to be desorbed from any
residual surface contaminants. It could then be peeled off from the inner walls to form a free standing film or “buckypaper” of SWNTs, being 5 to 10 µm thick (measured by scanning electronic microscopy). The baked buckypaper is labelled TR2. For each reaction a pre-weighted piece of baked paper, weighing 5 mg, was used. Three fluorination conditions were performed, leading to three different stoichiometries, noted A (19 h at 200°C), B (9 h at 220°C) and C (5 h at 260°C). The fluorination process, using F2 diluted into N2, was similar as the one
described previously.7
The XPS samples were prepared by evaporating an alcoholic solution of the fluorotubes on a diamagnetic steel support. Argon etching was not performed on the samples, in order to avoid any breaking of the CF bonds.
The XPS analyses were performed with a Leybold (LHS 12) spectrometer (CNRS-Université de Nantes). The ionising radiation (Kα1α2 of Mg) was provided by a
non-monochromatised X-ray source working at an acceleration tension of 12 kV and an emission current of 10 mA.
2.3 Raman measurements
Raman data were recorded on a Jobin Yvon T 64000 spectrometer equipped with a cooled charged coupled-device (CCD) detector. The scattering signal was collected through a microscope in backscattering configuration. All spectra were obtained at room temperature, with a resolution of 2 cm-1. The
laser power on the sample was limited to 2 µW to be sure to avoid heating of the samples.
2.3 AFM experiments
To prepare the observed sample, 0.2 mg of C fluorotubes were dispersed into 10 mL of anhydrous isopropanol through 15 min of low-density sonication (in a 20 kHz Bioblock ultrasonic cleaner). 20 µL of this solution were deposited on a mica muscovite disk (12 mm ∅) and immediately dried under primary vacuum. The AFM experiments were performed in air with a commercial microscope (Nanoscope III, Digital Instruments, Santa Barbara, CA), operated in non contact mode. Classical Si3N4 cantilevers were used (Ultrasharp, NT-MDT, Axess Tech,
France). The average constant and resonance frequency were about 14 N/m and 315 kHz respectively.
2.4. Defluorination
Fluorination of single-wall carbon nanotubes is described as a reversible functionalisation.7 The defluorination reaction of
fluorinated buckypapers was carried out in solution by dispersing 1.8 mg of buckypaper C (C1.9F) into 30 mL of
anhydrous isopropanol under argon (10 minutes of sonication). Then 5 mL of hydrazine 98 % (Aldrich) was added : some nanotubes started immediately to flocculate. The dispersion was stirred at room temperature for 1 h 15. The defluorinated nanotubes were filtered over a Teflon membrane (Sartorius, 1 µm), abundantly rinsed with methanol and finally dried under vacuum. They will be noted as D samples.
2.5. SERS study
The rough SERS surface is created in an Alcatel Bell 300 evaporation chamber. The metal (silver or gold) is heated and evaporated in vacuum (2×10⁻⁶ bar). It condenses on a very clean
glass substrate. The roughness is determined by an AFM and is of the order of 5–10 nm (root mean square). These parameters give a growing speed of 6 nm/min.12
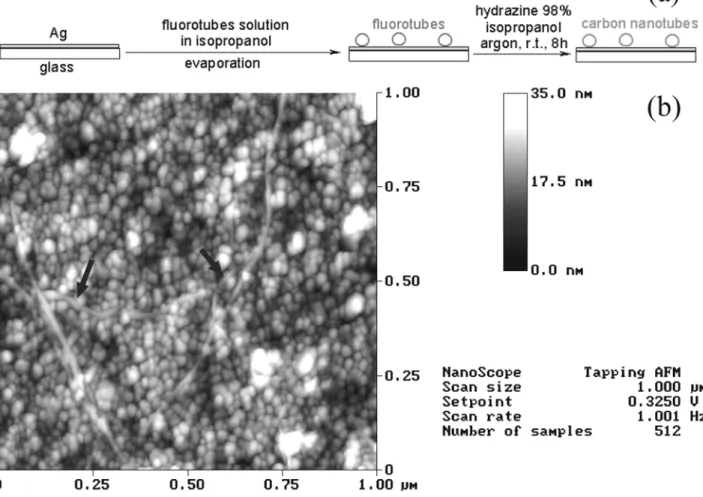
These rough metallic surfaces are used to perform the FSD (fluorination / solvation / defluorination) deposition process on them (schemed in fig. 7a) : 0.2 mg of C fluorotubes were dispersed into 10 mL of anhydrous isopropanol through 15 min of low-density ultrasonication under argon. 20 µL of this solution were deposited on the SERS support and immediately dried under primary vacuum. Concerning the defluorination step of the deposited fluorotubes, the SERS support was covered with 4 mL of anhydrous isopropanol and 0.2 mL of hydrazine (Aldrich 98 %) for 8 h at room temperature, under argon (the solution was periodically homogenised with a syringe). Then the SERS support was immersed into a big volume of methanol to wash it from hydrazine, and dried under primary vacuum (12 h, room temperature).
The roughness of the SERS surface did not allow a precise measurement of the heights of the dispersed fluorotubes (see fig. 7b). Nevertheless, the measured widths on fig. 7b are very close
to those measured on mica (fig. 4), and thus we believe that the imaged tubes correspond to isolated fluorotubes.
Concerning the control sample, we chose to disperse the TR2 nanotubes (after baking) with low density sonication in ethanol. The dispersion is deposited on a similar silver SERS surface and dried in the same way. Since ethanol is a poor solvent for carbon nanotubes, this sample serves as a reference, because a majority of large bundles subsist.
3 Fluorination
3.1 Determination of the stoichiometry
The covalent bond C–F is emphasised by the presence of some C 1s peaks at high binding energies attributed to the grafted carbons, whereas the peak of the non-grafted carbons is at 284.5 eV (see fig. 1a). From the sample A to C, a strong increase in the high energies components can be seen : as concerned with sample C, the most fluorinated one, the highest peak is at 288.7 eV. According to literature, the C 1s massif may include six components : the non-grafted carbons (at 284.5 eV), the oxygen-grafted carbons (hydroxyles at 286 eV, carbonyles at 287.6 eV and carboxyles at 288.5 eV)13 and finally the fuorinated carbons
(at 287.1 eV and 289.7 eV).15 The presence of hydroxyles and
other oxygenated functions is due to the purification including a long acid treatment (see Table 1). Some fluorination experiments on non-purified nanotubes will be made.
The F 1s peak reveals a binding energy of 683.8 eV and includes
only one component (fig. 1b). Polytetrafluoroethylene has a F 1s binding energy of 689.6 eV.14 This suggests that the fluorine
bonded to fluorotubes is considerably more ionic than the
Table 1 Elemental percentages calculated from the 1s orbit in the XPS
spectra. % C % F % O TR1 89.0 - 11.0 TR2 87.3 - 12.7 A 68.5 21.0 12.5 B 65.9 25.0 9.1 C 54.0 43.3 2.8
Fig. 1 X-Ray Photoelectron Spectroscopy of the fluorinated nanotubes.
(a) Normalised spectra of the C 1s peaks before (TR2 curves) and after fluorination (A, B and C curves). (b) Spectrum of the F 1s peak of the C
fluorine present in alkyl fluorides. It constitutes thus a good leaving group for nucleophilic substitutions.8,15 As a
consequence, fluorotubes are the chemical starting point of an organic chemistry upon carbon nanotubes sidewalls. As concerned with the fluorination of the catalyst particles (Ni and Co), we can neglect the presence of metallic fluorides. The thermogravimetric analysis of TR2 gives indeed a –99.25 % mass loss at 820°C, which shows that the catalyst mass can be neglected.
Commercial fluorinated graphite (CFx)y, bought from Aldrich
(x≈1.1), was used as a calibration sample to obtain sensitivity factors and deduce the stoichiometries CnF of the fluorotubes
with XPS. The exact stoichiometry of the calibration sample was determined by elemental analysis as x = 0.964. Therefore, the three fluorination degrees are : A : C3.9F ; B : C2.3F ; C : C1.9F
(the absolute error on the n values is about 0.1). Two approximations are made : i) a fluorotube standard would be more appropriate than a fluorographite one ; ii) the fluorine bonded to the nanotube catalyst and amorphous carbon is neglected. This latter approximation can be made since the used nanotubes were purified.
Finally, we notice that the maximum reached stoichiometry, C1.9F, is consistent with the limit C2F previously observed,15 and
that the n values obtained with another calibration sample (Teflon (CF2)y) are the same as those obtained with
fluorographite.
3.2 Raman study of the fluorinated samples
The baking step prior to fluorination is known to play a double role : i) to desorb the contaminants adsorbed on the surface of the bundles and inside them ; ii) to help recover the 2D graphene lattice on the side-walls of the nanotubes. The acid treatment leads to the intercalation of acid molecules inside the rope lattice,11 which exerts a pressure on the tubes. Such a pressure is
likely to upshift the frequency of the radial breathing mode
(RBM). The high temperature combined with the high vacuum of the baking step favours the liberation of these entrapped molecules, leading thus to an increase in intensity of the low frequency components of the RBM. The major component is at 192 cm-1 before baking and at 176 cm-1 after. The
desintercalation of the acid molecules also leads to the 6 cm-1
downshift of the E2g modes. As we have observed in several
cases, a release on the constraint exerted on the bundles is also linked with an increasing in intensity of the RBM.16 This
phenomenon is seen in fig. 2d : the relative area of the RBM strongly increases after the baking step. The partial recovering of the 2D graphene lattice is demonstrated by the strong decrease of the D-band, as also shown in fig. 2d.
Figs. 2 show the influence of the fluorination degree of the sidewalls on the Raman spectra at 676 nm. As far as the RBM is concerned, the fluorination degree does not influence its frequency but strongly affects its intensity (fig. 2a). To quantify this phenomenon, fig. 2d indicates the relative areas of the RBM. The decrease of intensity of the RBM bands upon increasing the degree of fluorination can be explained by the constraint induced by the covalent bonds with fluorine. Note that this phenomenon has also been observed when SWNTs are doped with lithium atoms.17 Besides, the more a nanotube is bent, the easier it will
undergo an addition reaction.18 As a consequence, the RBM
components corresponding to the smallest diameters (i.e. to the highest frequencies) were expected to vanish first, but it is not the case. Note that the dispersion of frequencies of RBM is principally due to the bundle effect (the Tubes@Rice samples present a narrow distribution diameter centred at 1.2 nm).11 In
that case, the lower frequency modes (176 cm-1) are related to
nanotubes inserted into small bundles, that is to tubes more accessible to F2. The higher frequency bands (196 cm-1)
correspond to nanotubes less accessible to F2 since they are
inserted into large bundles. It is interesting to point out that this 20 cm-1 shift is in agreement with a value calculated earlier.19
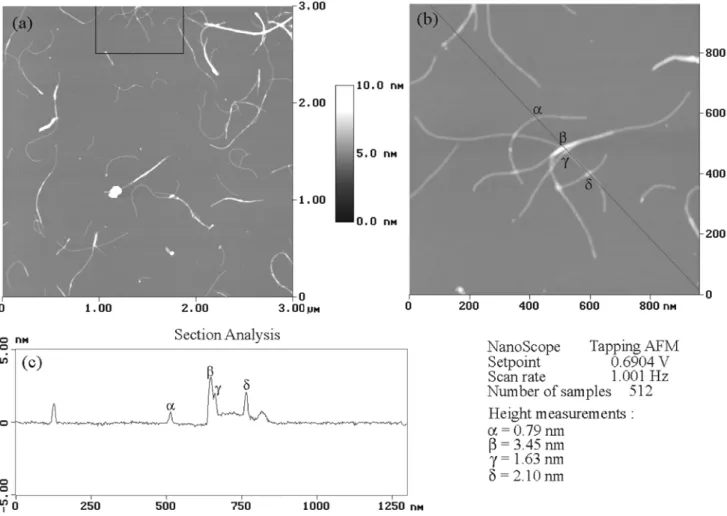
Fig. 4 Tapping AFM of the C fluorotubes (C1.9F stoichiometry). Fig. (b) corresponds to the enlargement of the framed upper part of fig. (a). Fig. (c) represents the section analysis along the black line of fig. (b).
The bonded fluorine atoms cause the rehybridisation from sp2 to
sp3 of the grafted carbon atoms. The fluorination process
disrupts thus the 2D graphene lattice. As exemplified in fig. 2b, the intensity of the D-band considerably increases with the degree of fluorination. The relative areas of the D-band are shown in fig. 2d. Finally, the E2g tangential modes of the
fluorotubes are downshifted by 7 cm-1 and broadened as the
stoichiometry increases (fig. 2c). This can be explained by the covalent bonding of SWNTs with fluorine. Fluorine is heavier and therefore fluorotubes exhibit E2g modes of lower
frequencies.
Note that the band at 1546 cm-1 typical of metallic SWNTs
promptly vanishes upon fluorination. This behaviour is consistently observed for other chemical modifications of SWNTs.20
3.3 Structural study and solvation properties of the fluorotubes.
As F2 reacts aggressively with many organic components, it is of
importance to assure that i) the sidewalls of the nanotubes are maintained without too many defects, such as holes ; ii) the tubular structure is maintained. Under too strong fluorinating conditions, tubes are likely to be destroyed.15 The three A, B and
C fluorotubes samples were observed with a transmission
electron microscope, which revealed that the tube-like structure was maintained and that the sidewalls remain unaltered (fig. 3). We also carried out atomic force microscopy (AFM) experiments to show the good solvation properties of the fluorotubes in alcoholic solvents. Figs. 4 show AFM images of the C fluorotubes dispersed with isopropanol (Mickelson et al found that isopropanol and sec-butanol suit at best).21 The height
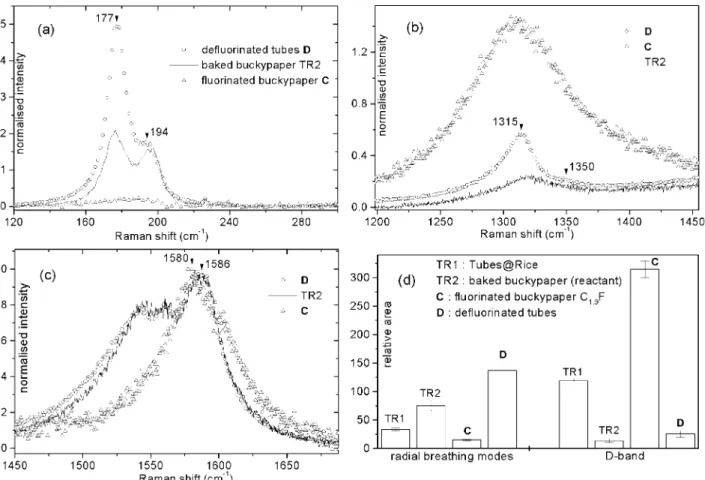
Fig. 5 Raman study at 676 nm of the defluorination step. Figs. (a), (b) and (c) show the Raman spectra of the pristine nanotubes TR2, the fluorinated
buckypaper C (stoichiometry C1.9F) and of the defluorinated sample D (made from C). Fig. (d) represents the relative area of the BRM and of the D-band (the total area of the E2g modes is taken as a reference 100).
Fig. 6 Influence of the defluorination process on the size of the bundles. Fig. (a) schemes a buckypaper after fluorination : the proportion of large
bundles is important. In fig. (b) the solvation of the fluorotubes in isopropanol after sonication causes the desaggregation of the bundles into isolated fluorotubes (or small bundles). Finally, the sudden reagreggation caused by the hydrazine treatment in isopropanol solution cannot lead to bundles as
measurements on the AFM images confirmed that a majority of the observed tubes correspond to single fluorotubes. The diameter distribution is centred around 8 Å (244 measurements; mean diameter : 7.8 Å; standard deviation : 1.7 Å). As can be seen in the centre of fig. 4b, the fluorotubes can overlap. The regions of overlapping are likely to correspond to unfluorinated regions of the tubes. The point α corresponds to the height of one fluorotube. The points γ and δ correspond to the crossing of two flurorotubes. The point β corresponds to the height of four fluorotubes (overlapping of three tubes, crossing a fourth one).
4 Defluorination and SERS study
The capacity of getting a majority of isolated fluorotubes on a surface, combined with the possibility of defluorinating some fluorotubes into pristine carbon nanotubes, is favourable to a SERS investigation of the latter. The defluorination of fluorotubes was first carried out in solution prior to the study of the defluorination process on a SERS surface.
4.1 Defluorination of a buckypaper
A Raman spectrum at 514 nm shows that the RBM are completely recovered after defluorination. On the contrary, at 676 nm, some differences appear on the RBM (fig. 5a) : a strong increase in the low frequency components is seen. As mentioned before, the dispersion of frequencies of RBM is mainly due to a distribution in the nanotube diameters, affected by the bundle effect. As a consequence, the RBM shape of the defluorinated nanotubes is due to a strong increase in the proportion of small bundles. This phenomenon is schematised in fig. 6 : during the fluorination step (in gaseous phase) the size of the bundles is not affected. The proportion of large bundles in the fluorinated buckypaper is therefore important (fig. 6a). Before the treatment
with hydrazine, the fluorotubes are dispersed in isopropanol by ultrasonication. At this stage, a majority of fluorotubes are isolated (fig 6b). Adding hydrazine to the solution causes nearly immediately their aggregation into bundles of defluorinated nanotubes. But the flocculated nanotubes do not form bundles as large as before (fig. 6c). The low frequency modes thus become preponderant in the RBM Raman signal.
The high frequencies spectrum (fig. 5b) indicates that the 2D graphene lattice is not completely recovered since the D-band appears stronger after defluorination. This phenomenon is more pronounced at 676 nm than at 514 nm. This indicates that the fluorination functionalisation is not completely reversible. One can remark that the component at 1315 cm-1 (amorphous carbon)
of the D-band stays almost the same but the component at 1350 cm-1 (SWNTs)increases after the defluorination step. Such an
evolution is not surprising since the fluorination/defluorination process does not modify the quantity of amorphous carbon, but induces some defects in the structure of the SWNTs.
We can finally notice that the downshift of the E2g mode caused
by the fluorination disappears after defluorination for both 514 nm and 676 nm excitations (fig. 5c).
4.2 SERS study
Here we describe a novel two-step deposition process of nanotubes on a rough metal surface (fig. 7a). The results of this new technique upon SWNTs are discussed by the means of Raman spectroscopy.
The SERS technique is very effective in the case of SWNTs. The interaction is very strong. It can be seen in fig. 7b that the individual SWNTs adapt very well to the rough surface. Drawing conclusions is not that easy because the changes in the spectra compared to classical Raman spectroscopy can be generated by the sample or the surface or by a combination of
Fig. 7 Fig. (a) schemes the FSD (fluorination / solvation / defluorination) process. This method is used to deposit well-dispersed carbon nanotubes on a
them. For this reason a "classic" deposit by ethanol and the new FSD method are compared.
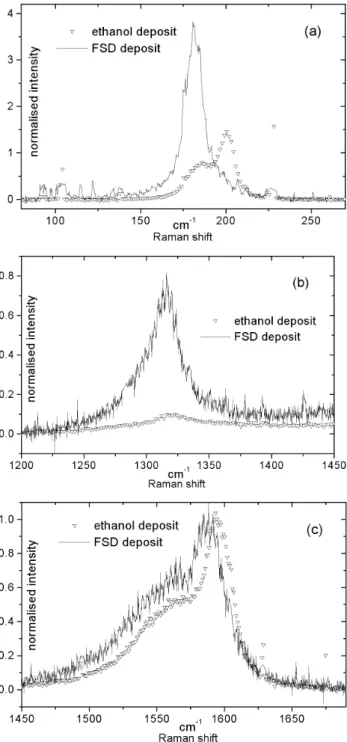
We expect to obtain small bundles or individual SWNTs on the SERS surface after the FSD deposit. In fig. 8a we see a strong increase in the intensity of one band at 180 cm-1, compared to
two bands at 180 cm-1 and 200 cm-1 for the classic deposit. This
proves again the bundle effect, mentioned before and shows at the same time the effectiveness of dispersion of the new FSD technique. When the defluorinated tubes D (fig. 5a) and the defluorinated deposited SWNTs (fig. 8a) are compared, we realise that the shoulder band at 194 cm-1 has vanished. The
sample D is indeed aggregated into small bundles whereas the defluorinated deposited SWNTs are rather isolated. It is interesting to point out that deposited fluorotubes cannot re-aggregate during the defluorination step since they remain stuck to the SERS surface.
In fig. 8b the D-band is much stronger in the case of the FSD deposit than the one observed for the classic deposit. One reason
is that the FSD process induces defaults, the second one is that very thin layers of SWNTs on rough surfaces increase the D-band too. The height of the D-D-band depends on the thickness of the layer. The thinner the layer is, the higher the D-band will be.20
Concerning the E2g band (fig. 8c) we cannot observe any
changes in the form but the band corresponding to the defuorinated tubes is downshifted of about 7 cm-1. This is an
effect generated by the SERS surface.
5 Conclusion
Determinig the stoichiometry by XPS is interesting as it can be more precise than EDX (Energy Dispersion X-ray analysis) and it is not destructive. The major drawback lies in the difficulty to find a pertinent standard and to limit contaminants containing carbon. The elemental analysis is an absolute determination but requires an important quantity of sample and is destructive. The two major features in the evolution of the Raman spectra of the fluorinated nanotubes are : i) the decrease of intensity of the RBM ; ii) the increase of intensity of the D-band. They are due to the formation of covalent bonds C−F on the sidewalls. It is interesting to point out that these evolutions were also both observed on the Raman spectra of carbon nanotubes electrochemically grafted (covalent bonds C−aryl).9 Further
quantitative studies should be carried out in order to be able to quantify the grafting degree from a Raman spectrum.
The aim of measuring the SERS spectrum of isolated carbon nanotubes (or, at least, of bundles as small as possible) led us to use fluorinated nanotubes since they can be isolated easily in heavy alcohols and a strong reductive agent (hydrazine) can give back the pristine nanotubes.
The bundle effect of agglomerated SWNTs could clearly been shown by a comparison between a rather classic deposit method on SERS substrates (sonicated dispersion of SWNTs in ethanol) and the new FSD method. The theoretical prediction of 20 cm-1
agrees well with our experiment data.
Fluorination is up to now the most interesting solubilisation method as it can provide very high grafting degrees, that are necessary for solvation. In order to access to the solution phase chemistry of SWNTs in other solvents besides alcohols, we are currently exploring the grafting of voluminous and/or charged groups by multi-step organic chemistry starting from fluorotubes,8 and the electrochemical method.9
Acknowledgements
Financial support from the CNRS and the Région Pays de Loire (PhD fellowship for P.R.M.) and from the Ministry of Education (PhD fellowship for J.S.) is gratefully acknowledged. We thank B. Vileno for participation in AFM experiments, C. Marhic for help in TEM observations, V. Fernandez for assistance in XPS measurements and A. Barreau for help in SEM observations. The work at the UMR 6502 has been carried out in the frame of the EU program COMELCAN HPRN-CT-2000-00128.
References
Fig. 8 Raman spectra at 676 nm of carbon nanotubes deposited on a
silver SERS surface using two different ways : i) the ethanol deposit ; ii) the FSD process.
1 M. S. Dresselhaus, G. Dresselhaus, P. Eklund, The science of
fullerenes and carbon nanotubes, Academic, 1996.
2 R. Saito, G. Dresselhaus, M. S. Dresselhaus, Physical properties of
carbon nanotubes, World Scientific, 1998.
3 P. J. F. Harris, Carbon Nanotubes and Related Structures : New
Materials for the Twenty-First Century, Cambridge University
Press, 1999.
4 J. Liu, A. G. Rinzler, H. Dai, J. H. Hafner, R. Kelley Bradley, P. J. Boul, A. Lu, T. Iverson, K. Shelimov, C. B. Huffman, F. Rodriguez-Macias, Y.-S. Shon, T. Randall Lee, D. T. Colbert, R. E. Smalley,
Science, 1998, 280, 1253-1256.
5 J. Chen, M. A. Hamon, H. Hu, Y. Chen, A. M. Rao, P. C. Eklund, R. C. Haddon, Science, 1998, 282, 95-98.
6 M. H. Hamon, J. Chen, H. Hu, Y. Chen, M. E. Itkis, A. M. Rao, P. C. Eklund, R. C. Haddon, Adv. Mater., 1999, 11, 834-840.
7 E. T. Mickelson, C. B. Huffman, A. G. Rinzler, R. E. Smalley, R. H. Hauge, J. L. Margrave, Chem. Phys. Lett., 1998, 296, 188-194. 8 P. J. Boul, E. T. Mickelson, C. B. Huffman, L. M. Ericson, I. W.
Chiang, K. A. Smith, D. T. Colbert, R. H. Hauge, J. L. Margrave, R. E. Smalley, Chem. Phys. Lett., 1999, 310, 367-372.
9 J. L. Bahr, J. Yang, D. V. Kosynkin, M. J. Bronikowski, R. E. Smalley, J. M. Tour, J. Am. Chem. Soc., 2001, 123, 6536-6542.
10 A. Thess, R. Lee, P. Nikolaev, H. Dai, P. Petit, J. Robert, C. Xu, Y. Hee Lee, S. Gon Kim, A. G. Rinzler, D. T. Colbert, G. E. Scuseria, D. Tománek, J. E. Fischer, R. E. Smalley, Science, 1996, 273, 483-487.
11 A. G. Rinzler, J. Liu, H. Dai, P. Nikolaev, C. B. Huffman, F. J. Rodríguez-Macías, P. J. Boul, A. H. Lu, D. Heymann, D. T. Colbert, R. S. Lee, J. E. Fischer, A. M. Rao, P. C. Eklund, R. E. Smalley, App. Phys. A, 1998, 67, 29-37.
12 M. Baibarac, M. Cochet, Synth. Met., 1998, 96, 63-70.
13 H. Hiura, T. W. Ebbesen, K. Tanigaki, Adv. Mater., 1995, 7, 275. 14 G. Nansé, E. Papirer, P. Fioux, F. Moguet, A. Tressaud, Carbon,
1997, 35, 175-194.
15 E. T. Mickelson, Novel Chemistry of Elemental Carbon : Graphite, Fullerenes, and Nanotube Chemistry ; Rice University, Texas ; 1999.
16 Single-wall nanotubes dispersed in an aqueous solution with a relatively high osmotic pressure may exhibit some upshift frequencies of the BRM up to 10 cm-1, and a decreasing of the relative intensity of the BRM up to 80 % (unpublished data, P. R. Marcoux).
17 N. Bendiab, E. Anglaret, J. L. Bantignies, A. Zahab, J. L. Sauvajol, P. Petit, C. Mathis, S. Lefrant, Phys. Rev. B, 2001, in press.
18 Y. Chen, R. C. Haddon, S. Fang, A. M. Rao, P. C. Eklund, W. H. Lee, E. C. Dickey, E. A. Grulke, J. C. Pendergrass, A. Chavan, B. E. Haley, R. E. Smalley, J. Mater. Res., 1998, 13, 2423-2431. 19 L. Henrard, E. Hernández, P. Bernier, A. Rubio, Phys. Rev. B, 1999,
60, R8521-R8524.
20 M. Baibarac, I. Baltog, S. Lefrant, O. Chauvet, J. Y. Mevellec, L. Vaccarini, P. Bernier, Proceedings of the MRS Fall Meeting, Boston 2000, in press.
21 E. T. Mickelson, I. W. Chiang, J. L. Zimmerman, P. J. Boul, J. Lozano, J. Liu, R. E. Smalley, R. H. Hauge, J. L. Margrave, J. Phys.