OATAO is an open access repository that collects the work of Toulouse
researchers and makes it freely available over the web where possible
Any correspondence concerning this service should be sent
to the repository administrator:
[email protected]
This is an author’s version published in: http://oatao.univ-toulouse.fr/20108
To cite this version:
Nouasse, Houda
and Chiron, Pascale
and Archimède,
Bernard
Transportation network model with time delay for flood
lamination strategy. (2013) In: 24th International Conference on
Information, Communication & Automation Technologies (ICAT),
31 October 2013 - 1 November 2013 (Sarajevo, Bosnia And
Herzegovina).
Transportation network model with time delay for
flood lamination strategy
Houda Nouasse, Pascale Chiron and Bernard Archimède
Laboratoire Génie de ProductionUniversité de Toulouse – INPT – ENIT Tarbes, FRANCE
[email protected], [email protected], [email protected]
Abstract— Flooding due to rivers overflowing have affected this year many countries in the world. The engendered problems, due to their intensity, are relative to goods and persons safety, and often cause a sharp increase of the insurance costs, which is no more tolerable in the actual economic context. To prevent these problems, it is necessary to limit water heights downstream the streams. In the literature, numerous described works were done on flows modelling and management. The work presented in this paper, is interested in the quantitative management by means of floods diversion areas placed along the river and for which location and sizing are known. A management method computing the height of gates opening at each time step is proposed. The strategy is based on a transportation network model of the flood diversion area system including the time transfer delays. It allows the computation of the water volumes to be stored in time. Simulation results for different flood episode are discussed.
Keywords—transportation networks; time delay; flood lamination; network modelling.
I. INTRODUCTION
The last decades violent natural phenomena have been observed on both sides of the planet, which according to experts are largely due to climate change [1]. Among these phenomena, we are interested in floods due to river overflowing, whose severity and magnitude are increasingly significant. Today, this is particularly manifest as attested by the floods in all Europe and particularly in central Europe where flooding of the Elbe and Danube were deadly and exceeded the record level of 2002. In fact, flooding due to excessive rainfall and surface runoff can cause significant damages, properties loss and injuries around the world. To prevent these problems, river systems are increasingly equipped with means for detecting floods and floodplains sized and positioned according to the topography. Flood management requires increased reactivity as compared to other management methods based on planning where the necessary data are known a priori. Indeed, given rapidity climatic phenomena at origin of the most of these floods, and difficulty of accurately assess their magnitude; managers must take important decisions quickly in an uncertain context. The integration of adapted digital tools to these crises is relevant and necessary to improve the decision-making [2], [3]. The
difficulty is related to the choice of the optimization model associated to management method, which depends on device characteristics, data availability, goals to achieve and constraints to be satisfied. In the literature, different optimization techniques are proposed to help flood management among which we can mention: the linear programming [4], nonlinear programming [5], [6], multiobjective optimization [7] or genetic algorithms [8]. Some heuristics are also used to deal with this management, notably algorithms for flows maximizing [9], [10], [11]. Unfortunately, the management methods based on algorithms for flows maximizing do not take into account the transfer time of water volumes. Thus, the objective of this paper is to describe a method for managing storage of volume displaced in expansion areas, which are available along of a watercourse in a river system. The proposed method is based on the transport networks with time delay. The paper is organized as follows. Section II describes the flood-diversion area system. Section III gives the main definitions of network flow modeling with time delay. A three-flood-diversion-area system modeling is detailed. In section IV, the simulation results during a flooding period are displayed and discussed. Finally, the conclusion summarizes the interest of the proposed flood lamination strategy combined to the 1D simulator and suggests some future works.
II. FLOODDIVERSIONAREASYSTEM
A flood-diversion-area (FDA) system consists of a series of FDAs distributed along the river. A FDA is a floodplain area equipped with controlled gate. The gate opening creates depression waves that interfere with the flood wave to reduce peak flood discharges. To illustrate our approach we use a simplified example, with , of a river as a benchmark.
A river reach provide with three lateral floodplain area ( , , ) is assumed (see Fig.1). The river and the floodplains are separated by levees everywhere except at certain points where they are connected through a gate, , . These vertical levees are high enough for avoiding overflow. For simulation purposes, this river is modeled using 1D Shallow water equations [12], [13]. We assume that is the transfer time from the gate to the following gate
!"#$% !"#&% !"#'%
($% (&% ('%
)$% )&% Fig. 1. River with three lateral floodplain.
III. TRANSPORTATIONNETWORKDESIGN INCLUDINGTIMEDELAY
In previous work [14], in order to model our benchmark, we proposed the use of a static transportation network, where we assume that and . The problem was formulated as a Min-Cost-Max-Flow problem that minimizes a linear cost function subject to the constraints of flow conservation and minimal and maximal capacities. In this formulation we tried to determine an optimal lamination flow that satisfies physical constraints required by a flood scenario
and the optimization method management parameters. However, the transfer time delays were not taken into account. Therefore, herein, in order to improve the management method, we propose to introduce time delay in the system through the use of a temporized transportation network. Thus, we will see some aspects of the impact of time delay on the studied river system.
For this purpose, we study the evolution of the state of our flood-diversion area system at each , in the
horizon , with , using the
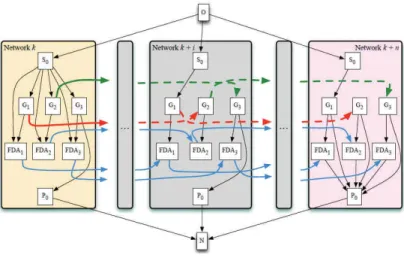
temporized transportation network given in Fig. 2. It can be seen as a dynamic flow network [15], [16] composed by interconnected static sub-networks. These connections allow for model temporization.
The network where is a set of
nodes defined as follows. The network layers are indexed through the use of exponent .
• represents the gate at , with ;
is the at ;
• is a source node corresponding to the fictive entry point of our FDAs system at ;
• is a sink node corresponding to the fictive exit point of our FDAs system at ;
• is an extra source node corresponding to the fictive entry point of our transportation network whatever the period is;
• is an extra sink node corresponding to the fictive exit point of our transportation network whatever the period is;
These nodes are associated to the set of valued arcs describing the following connections:
• Between the nodes and such as
with and
. It carries the delayed discharge that passes by between the gate and the gate . This kind of arc is designed as type 1 arcs in the following.
• Between and , with and
, it represents the flow downstream the exit point of our FDAs system when this discharge is not stored in the .
• Between and , with , it
represents the flow downstream the exit point of our FDAs system when this discharge is not stored in the
.
• Between nodes and , is the flow at the entry point that is always transferred towards the gate .
• Between nodes and , with and , it takes into account at initialization the flow upstream the gate in the FDAs system.
• Between nodes and , it takes into account the water volume already stored in the at the initialization.
• Between nodes and , the arc connects each gate with its FDA, and represents the flow crossing the gate towards the at the end of each period
.
• Between nodes and , with
, the arc indicates that the water stored in the at the end of the period is available at the beginning of period . This kind of arc is designed as type 2 arcs in the following. • Between nodes and , the arc respects
transportation network conservation flow rules.
In each sub-network there is no transfer time between the different nodes. Transfer times are introduced by connecting the different sub-networks with type 1 and type 2 arcs.
The use of such a model requires that transfer times are static from a layer to another in the set while they depend on the flow-rate, which changes over time. Moreover, this kind of model, depending on the size of the time horizon and the period , can lead to an oversize transportation network.
Herein, in order to overcome these two points we propose a reduced size model (see Fig. 3), which allows enhancing the temporized network: more dynamic and suitable for various river sections with variable transfer time.
This reduced transportation network is obtained by the conservation of nodes number of a sub-network, by the fusion of all the different sub-networks of our previous model and by eliminating arcs between sub-networks. In this reduced size model, link between layers are represented through a matrix and thus the transportation network communicates with this matrix where the values of delayed flow are stored. In Fig. 3, for each arc, its maximum capacity is written in blue, its minimum capacity is written in red and its cost is written in black.
Fig. 3. Dynamic reduced size network.
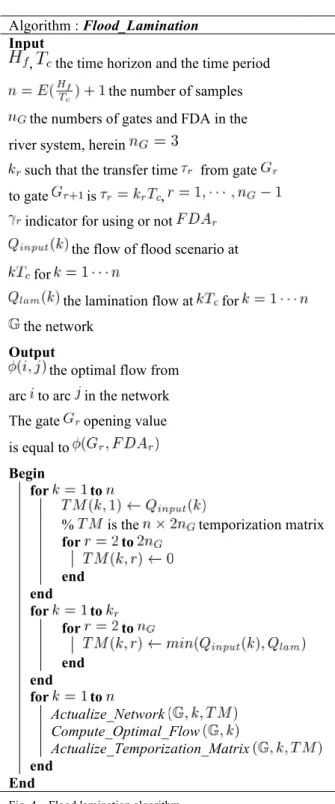
Algorithm : Flood_Lamination
Input
, the time horizon and the time period the number of samples the numbers of gates and FDA in the river system, herein
such that the transfer time from gate
to gate is ,
indicator for using or not
the flow of flood scenario at for
the lamination flow at for the network
Output
the optimal flow from arc to arc in the network The gate opening value is equal to
Begin
for to
% is the temporization matrix
for to end end for to for to end end for to Actualize_Network Compute_Optimal_Flow Actualize_Temporization_Matrix end End
The Flood-Lamination algorithm described in Fig.4 uses all these arc values in order to derive the gate opening set-point values. In the Flood-Lamination algorithm, after an initialization phase, at each , the network is actualized (see Fig. 5), the optimal flow is computed and the temporization matrix is actualized (see Fig. 6). In order to compute the optimal flow, the Min cost Max flow problem resolution for this reduced size temporized network is done, using a Linear Programming formulation (as described in Nouasse et al., 2012), according to our management objectives. In the algorithms:
• is the flow entering the network at . • is the maximum peak flow of flood scenario.
• is the maximum storage
capacity, depending on .
• is the maximal capacity on the arc between the gate
and the .
• is a strategy parameter with
• is the lamination flow chosen by the river system manager and defined as the flow level at which the river flow must be laminate, i.e. the hydraulic set point over the foreseen horizon Hf.
• is the minimum capacity on the arc
between the source and the . It corresponds to the amount of water already present in the .
The dynamic reduced size network has been connected to the 1D simulator (developed by [12], [13]), in order to update flow and water quantity stocked with measured values. The scheme used is given in Fig. 7 and the algorithm for actualization of temporized matrix is modified as given in Fig. 8.
Fig. 7. Dynamic reduced size network connected with 1D simulator
Algorithm : Actualize_Temporization_Matrix
Input
the numbers of gates
and FDA in the river system, herein the temporization matrix
the iteration number
such that the transfer time from gate to gate is
the network
Output
the temporization matrix
Begin for to end for to end End
Fig. 6. Actualization temporization matrix algorithm.
Algorithm : Actualize_Network
Input
the numbers of gates and FDA in the river system, herein
the temporization matrix
the iteration number
indicator for using or not the lamination flow at the network Output the network Begin for to end for to end for to end End
IV. COMPUTATIONALRESULTS
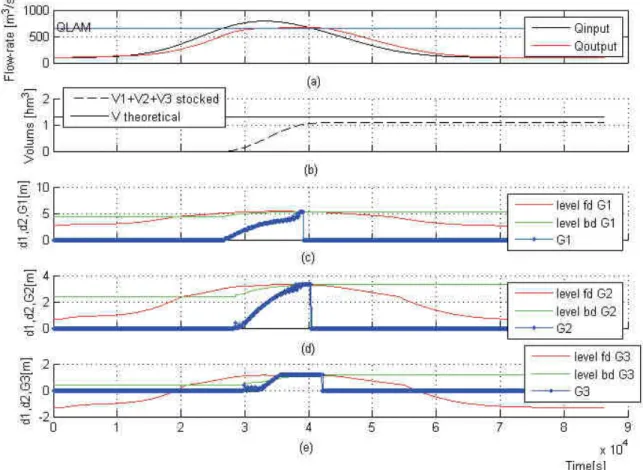
We present some results obtained using the method where our network model is connected with the 1D hydraulic simulator. The network model allows calculating the optimal flow-rate. This flow-rate value will be used for computing the opening height of each FDA gate. The computation algorithm involves a static inversion of the free flow open channel equations [17]. In Fig. 9 (a) is the inlet discharge. The is the outlet measured discharge when the flood lamination strategy is applied. The parameters of the network delay model are
, and .
The sum of the stored water volume in each FDA is plotted in Fig. 9 (b). The water volume to store in the FDAs is the volume such as is over . This volume is denoted in Fig. 9 (b), and approximated with the trapezoidal numerical integration of the flow-rate function above .
Fig. 9. Simulation results for , , water levels forward the gates (d1, fd) and backward the gates (d2, bd)
Algorithm : Actualize_Temporization_Matrix
Input
the numbers of gates
and FDA in the river system, herein the temporization matrix
the iteration number
such that the transfer time from gate to gate is
the network
Output
the temporization matrix
Begin for to end for to end End
In Fig 9. (c), (d) and (e) the gate opening values are displayed for gate 1, 2 and 3 respectively. In these figures, stands for the water level forward each gate and stands for the water level backward each gate.
The values of and were estimated by an empirical method for , however methods like the one developed in [18] can be used.
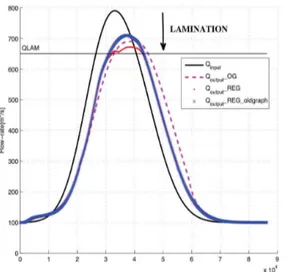
Simulations were done for the same input scenario (i.e. values
of displayed in black) and for for
three different regulation strategies. Results are given in Fig. 10, where obtained in case where the gates were always open is displayed in red dotted line ( ). In the case where the lamination strategy proposed in [14] was applied is displayed in blue crosses line
( ). Finally, when the lamination
strategy proposed here (with the network delay model) is displayed in red ( ). The peak flood discharge reduction is better in the latter case.
V. CONCLUSION
A flood lamination strategy based on a transportation network model including time delay was proposed. The strategy allows controlling a river system equipped with flood diversion areas. In order to avoid oversize in the transportation network and to include non-static transfer times, a reduced graph with temporization matrix was proposed. Results obtained with this strategy for water storage purpose were discussed. The strategy can be improved by modeling the release of water from the FDAs to the river. Furthermore, beyond a quantitative flood management an important problem to address is the quality of water in the river and in the FDAs. These extensions will be studied in future works.
AKNOWLEDGMENT
The authors want to thank Confederación Hidrográfica del Ebro for providing the case study used in this paper as well as
for sharing their hydrological management expertise and Fluid Mechanics, LIFTEC-EINA, University of Zaragoza for providing the 1D simulator.
REFERENCES
[1] M. J. Booij, “Impact of climate change on river flooding assessed with different spatial model resolutions,” Journal of Hydrology, vol. 303, no. 1–4, pp. 176–198, Mar. 2005.
[2] D. R. Kracman, D. C. McKinney, D. W. Watkins Jr., and L. S. Lasdon, “Stochastic Optimization of the Highland Lakes System in Texas,” Journal of Water Resources Planning and Management, vol. 132, no. 2, pp. 62–70, 2006.
[3] X. J. Wang, R. H. Zhao, and Y. W. Hao, “Flood Control Operations Based on the Theory of Variable Fuzzy Sets,” Water Resources Management, vol. 25, no. 3, pp. 777–792, Jan. 2011.
[4] J. T. Needham, D. W. Watkins Jr., J. R. Lund, and S. K. Nanda, “Linear Programming For Flood Control In The Iowa And Des Moines Rivers,” Journal Of Water Resources Planning And Management, vol. 126, no. 3, pp. 118–127, 2000.
[5] A. Bemporad, A. Casavola, and E. Mosca, “Nonlinear Control of Constrained Linear Systems via Predictive Reference
Management,” IEEE Transactions On Automatic Control, vol. 42, no. 3, pp. 340–349, 1997.
[6] C. A. Floudas, A. Aggarwal, and A. R. Ciric, “Global optimum search for nonconvex NLP and MINLP problems,” Computers & Chemical Engineering, vol. 13, no. 10, pp. 1117–1132, 1989. [7] G. Fu, “A fuzzy optimization method for multicriteria decision
making: An application to reservoir flood control operation,” Expert Systems with Applications, vol. 34, no. 1, pp. 145–149, Jan. 2008. [8] X. Cai, D. C. McKinney, and L. S. Lasdon, “Solving nonlinear
water management models using a combined genetic algorithm and linear programming approach,” Advances in Water Resources, vol. 24, no. 6, pp. 667–676, Jun. 2001.
[9] M. Gondran and M. Minoux, Graphs and Algorithms, 3rd ed. Eyrolles, Paris, France, 1995, p. 622.
[10] R. K. Ahuja, T. L.Magnanti, and J. B. Orlin, Network Flows: Theory, Algorithms, and Applications, 1st ed. Prentice-Hall, Inc.Upper Saddle River, NJ, USA, 1993, p. 864.
[11] D. P. Bertsekas, Linear Network Optimization. The MIT Press, Cambridge, Mass, USA., 1991, p. 373.
[12] P. Garcia-Navarro, P. Brufau, J. Burguete, and J. Murillo, “The shallow water equations: An example of hyperbolic system,” Monografias de la Real Academia de Ciencias de Zaragoza, vol. 31, pp. 89–119, 2008.
[13] M. Morales-Hernandez, P. García-Navarro, and J. Murillo, “A large time step 1D upwind explicit scheme (CFL>1): Application to shallow water equations,” Journal of Computational Physics, vol. 231, no. 19, pp. 6532–6557, Aug. 2012.
[14] H. Nouasse, P. Charbonnaud, P. Chiron, J. Murillo, M. Morales, P. Garcia-Navarro, and G. Perez, “Flood lamination strategy based on a three-flood-diversion-area system management,” in 2012 20th Mediterranean Conference on Control & Automation (MED), 2012, pp. 866–871.
[15] E. Köhler, K. Langkau, and M. Skutella, “Time-expanded graphs for flow-dependent transit times,” in Procceedings 10th Annual European Symposium on Algorithms, 2002, pp. 599–611. [16] V. Melkonian, “Flows in dynamic networks with aggregate arc
capacities,” Information Processing Letters, vol. 101, no. 1, pp. 30– 35, Jan. 2007.
[17] X. Litrico, P. Malaterre, J.-P. Baume, and J. Ribot-Bruno, “Conversion from Discharge to Gate Opening for the Control of
Irrigation Canals,” Journal of Irrigation and Drainage Engineering, vol. 134, no. 3, pp. 305–314, Jun. 2008.
[18] J. Romera, C. Ocampo-Martinez, V. Puig, and J. Quevedo, “Flooding management using hybrid model predictive control: application to the Spanish Ebro River,” Journal of