O
pen
A
rchive
T
OULOUSE
A
rchive
O
uverte (
OATAO
)
OATAO is an open access repository that collects the work of Toulouse researchers and makes it freely available over the web where possible.
This is an author-deposited version published in : http://oatao.univ-toulouse.fr/
Eprints ID : 10474
To cite this version : Loisel, Vincent and Abbas, Micheline and
Masbernat, Olivier and Climent, Eric Dynamics of laminar pressure-driven channel flows laden with neutrally buoyant finite-size particles. (2013) In: Euromech Colloquium 555 : Small-scale numerical methods for multi-phase flows, 28 August 2013 - 30 August 2013 (Bordeaux, France). (Unpublished)
Any correspondance concerning this service should be sent to the repository administrator: [email protected]
Relaminarization delay by neutrally buoyant finite-size particles in a transitional channel flow
Vincent Loisel1, Micheline Abbas1,3, Olivier Masbernat1,3, Eric Climent2, 3
1University of Toulouse – INPT-UPS-CNRS: Laboratoire de Génie Chimique, Toulouse, France 2University of Toulouse – INPT-UPS-CNRS: Institut de Mécanique des Fluides, Toulouse, France 3Fédération de recherche FERMaT CNRS, FR 3089 1, Allée du Professeur Camille Soula, 31 400
Toulouse, France
Relaminarization delay by finite Reynolds particles in a transitional channel flow.
Keywords: Particle-laden flows, transition to turbulence, numerical simulations
Abstract
Since the pioneering work of Reynolds (1883), much effort has been allocated on the topic of laminar-turbulent transition regime in a single-phase flow, with special focusing on the unstable and intermittent natures of this regime (Mullin, 2011). The transition regime of dispersed flows carried less attention even though dispersed flows are used in many industrial processes. As for suspensions of neutrally buoyant particles, Matas et al. (2003) observed changes in the values of the critical Reynolds numbers depending on both the solid volume fraction and the particle-to-pipe size-ratio. Typically, the transition occurs at lower Reynolds numbers when the flow carries macro-sized particles at dilute to moderate concentrations (up to 25%). On the contrary, the critical Reynolds numbers of the onset of transition is shifted towards greater values when particles are micro-sized and their concentration is higher.
In this work, we aim at understanding the mechanisms lying behind the shift of the laminar-turbulent transition regime down to lower critical Reynolds numbers in suspension flows of macro-sized particles. Fully-coupled numerical simulations are used to investigate the interactions between neutrally-buoyant finite-size particles and a transitional channel flow. To our knowledge, other than the simulations of Shao et
al. (2012) and Garcia-Villalba et al. (2012) performed in turbulent channel flows,
there are no direct numerical simulations performed on fluctuating suspension flows in channels or pipes with finite-size particles. The numerical method chosen for this work is the Force-Coupling Method (FCM) (Maxey and Patel, 2001, Lomholt and Maxey 2003). It is fully-resolved in the sense that the fluid equations are solved at a length-scale smaller than the particle radius.
In a first step, the laminarization process of a single-phase flow initially turbulent at Re=6000 is statistically characterized (Re is based on the average flow velocity, the channel height and the kinematic viscosity). In a second step, particles are randomly added to the fluctuating channel flow at a solid volume fraction of 5%, the size ratio of particle diameter to channel height being 1/16. The starting point of the calculation of the suspension flow is a snapshot taken from the single-phase flow case at Re=1625 (the smallest Reynolds number at which the flow does not relaminarize).
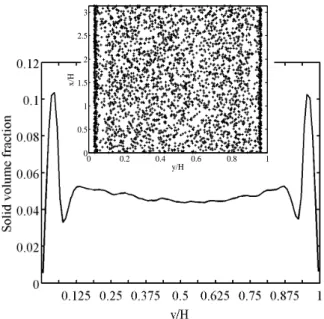
- The solid volume fraction profile in Figure 1 (averaged in time and in homogeneous directions) shows that the particles are homogeneously distributed in most of the channel flow (φ≈5%). The larger concentration in the near-wall region (φ≈5% in Figure 1) is mainly due to inertial particle lateral migration (Segré-Silberberg effect). The average velocity profile in the fluctuating suspension flow is almost unchanged compared to the single phase flow at the same Reynolds number (Figure 2).
- The profile of the root-mean-square of the streamwise velocity fluctuations (in Figure 3) is almost unchanged compared to the particle-free case. However, the wall-normal and spanwise velocity fluctuations are significantly changed compared to the single-phase flow case. They are larger in the wall-vicinity due to larger particle concentration in this region, and they are slightly larger in the channel core due to energy redistribution from the streamwise towards the transverse directions. Hence in the suspension flow, the particles are responsible for the significant agitation growth (in transverse directions) compared to the single-phase case.
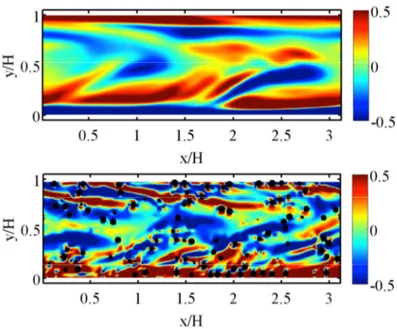
- The vorticity fluctuations in the vicinity of the particle surface and in the near-wall region are larger than anywhere else in the flow. This is mainly due to the interaction of the neutrally buoyant particles with the local shear rate. The particles are observed to break down the vortical structures present within the flow into smaller, thinner and more numerous ones (Figure 4).
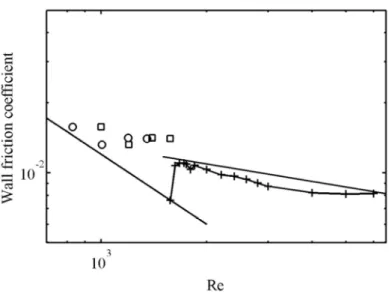
- When the Reynolds number is decreased in single phase flow simulations, the wall friction coefficient shows a fairly good agreement (in Figure 5) with Dean’s law (Cf=0.073Re-0.25) for the turbulent regime down to Re=1575 where the skin friction coefficient falls down abruptly to the laminar law (Cf=12/Re). In suspension flows, values of the friction coefficient are larger than in the single-phase case. The fluctuating flow exhibits a nearly constant friction coefficient in the transition regime whereas the friction coefficient increases when the Reynolds number is decreased below 1200. Substituting the Reynolds number by a mixture Reynolds number based on the effective suspension viscosity, the evolution of the friction coefficient almost collapses with the laminar law.
These results tend to show that compared to single-phase flow, even at low concentration, finite Reynolds particle flows relaminarize at lower Reynolds number, in accordance with previous experimental observations of Matas et al. Further calculations are needed to sustain this result.
References
Abbas, M., Climent, E., Simonin, O., Maxey, M. R., 2006. Dynamics of bidisperse suspensions under Stokes flows: Linear shear flow and sedimentation. Phys. Fluids 18.
Garcia-Villalba, M., Kidanemariam, A., Uhlmann, M., 2012. DNS of vertical plane channel flow with finite-size particles: Voronoi analysis, acceleration statistics and particle-conditioned averaging. Int. J. Multiphase Flow 46, 54-74.
Lomholt, S., & Maxey, M. R. 2003. Force-coupling method for particulate two-phase flow: Stokes flow. Journal of Computational Physics, 184, 381-405.
Matas, J.-P., Morris, J. F., Guazzelli, E., 2003. Transition to turbulence in particulate pipe flow. Phys. Rev. Lett. 90, 014501.
pipe flow. J. Fluid Mech. 621, 59–67.
Maxey, M. R., Patel, B. K., 2001. Localized force representations for particles sedimenting in Stokes flow. Int. J. Multiphase Flow 27, 1603–1626.
Mullin, T., 2011. Experimental studies of transition to turbulence in a pipe. Annu. Rev. Fluid Mech. 43, 1–24.
Segré, G., Silberberg, A., 1962. Behavior of macroscopic rigid spheres in Poiseuille flow. part I. Determination of local concentration by statistical analysis of particle passages through crossed light beams. J. Fluid Mech. 14, 115–135.
Shao, X., Wu, T., Yu, Z., 2012. Fully resolved numerical simulation of particle-laden turbulent ow in a horizontal channel at a low Reynolds number. J. Fluid Mech. 693,319-344.
0 0.2 0.4 0.6 0.8 1 0 0.5 1 1.5 2 2.5 3 y/H x /H
Figure 1: Solid volume fraction profile at Re=1575. Preferential positions are observed in the wall region due to inertial migration. Inset: Snapshot of the particles' centers positions (crosses) projected on a (yx) plane.
Figure 2: Average velocity profile of fluctuating flows at Re=1575 (thin line for single phase flow and square symbols for two-phase flow) and of laminar flows (solid line for single phase flow and circle symbols for two-phase flow).
0.125 0.25 0.375 0.5 0.625 0.75 0.875 1 0 0.05 0.1 0.15 0.2 y/H R .m .s . v el o ci ti es
Figure 3: Velocity component r.m.s. scaled by the average flow velocity at Re=1575. Symbols are for two-phase flow
profiles, in the flow , wall normal ∘ and spanwise ⋄ directions. Lines are for single-phase flow simulations in
the flow (solid), wall normal (dashed) and spanwise (thin line) directions.
Figure 4: 2D snapshots of spanwise vorticity fluctuations at Re=1575 in the median section of the simulation domain. The fluid is flowing from left to right. Particle-free flow (up), particle-laden flow (bottom).
Figure 4: Skin friction coefficient versus Reynolds number in a log-log plot. From left to right, the solid lines represent
the laminar law, and Dean's law (0.073Re1/4) for the turbulent regime, respectively. Results from single-phase
simulations are plotted with crosses. Squares are used for the two-phase flows results. Circles are for two-phase flow