OATAO is an open access repository that collects the work of Toulouse
researchers and makes it freely available over the web where possible
Any correspondence concerning this service should be sent
to the repository administrator:
[email protected]
This is an author’s version published in:
http://oatao.univ-toulouse.fr/24649
To cite this version:
Shao, Hui
and Lin, Zifeng
and Xu, Kui
and Taberna, Pierre-Louis
and Simon, Patrice
Electrochemical study of pseudocapacitive behavior of
Ti3C2Tx MXene material in aqueous electrolytes. (2019) Energy Storage
Materials, 18. 456-461. ISSN 2405-8297
Electrochemical study of pseudocapacitive behavior of Ti
3
C
2
T
x
MXene
material in aqueous electrolytes
Hui Shao
a,b, Zifeng Lin
a,b,c,⁎, Kui Xu
a,b, Pierre-Louis Taberna
a,b, Patrice Simon
a,b,⁎aCIRIMAT, Université de Toulouse, CNRS, INPT, UPS, 118, route de Narbonne, 31062 Toulouse cedex 9, France bReseau sur le Stockage Electrochimique de l’Energie (RS2E), FR CNRS 3459, France
cCollege of Materials Science and Engineering, Sichuan University, Chengdu 610065, PR China
A R T I C L E I N F O
Keywords: Pseudocapacitance Ti3C2TxMXene MUSCA Surface process Bulk processA B S T R A C T
In this paper, a multiple potential step chronoamperometry (MUSCA) technique is used to analyze the electrochemical behavior of pseudocapacitive Ti3C2TxMXene material. MUSCA allows for reconstruction of
cyclic voltammograms with considerably lower ohmic drop contribution. As such, the voltammogram current responses from the surface and bulk processes can be precisely deconvoluted at any given potentials, especially at high scan rates. An electrochemical kinetic analysis of the Ti3C2Tx electrode using the calculated
voltammograms showed that the surface process dominates at higher scan rate while the bulk process takes over at the low scan rate in both acidic and alkaline electrolytes. By minimizing the ohmic drops, the MUSCA method is presented to be a useful tool to study the natural electrochemical behavior of pseudocapacitive electrodes and to help designing better energy storage systems.
1. Introduction
Supercapacitors are electrochemical energy storage devices which are suited for high power delivery and energy harvesting [1]. High power performance of supercapacitors originates from fast adsorption/ desorption of electrolyte ions into the electrochemical double layer formed at porous surface, or, from redox reaction confined at the surface of pseudocapacitive materials [2]. Electrochemical reaction kinetics in pseudocapacitive materials are conventionally described as fast redox processes compared to intercalation reaction, which is kinetically limited by the ion diffusion into the bulk phase of host materials[3]. In pseudocapacitive materials, the total stored charge can be conventionally separated into two parts, namely surface (or outer) and bulk (or inner) processes. The surface process involves the electrochemical double layer capacitance with or without a fast faradaic redox reaction so that there is no diffusion limitation. Although there is no kinetically limiting step, at high current density, ion migration is still limited within the electrolyte, which becomes much more severe for electrolytes with lower ion concentrations. On the other hand, the bulk process is primarily limited by mass transfer and/or ohmic drops at high current density.
So far, there have been numerous methods reported in the literature for deconvoluting surface and bulk electrochemical processes in energy storage electrodes[4 9]. Trasatti et al. proposed to distin
guish between‘outer’ surface redox and ‘inner’ redox contributions by considering that the outer surface charge qoas independent from the
scan rate v and that the total charge qtin the bulk of electrode changes
linearly with the square root of the potential scan rate v-1/2 [4]. In addition, Conway et al. analyzed the different electrochemical processes by examining peak current (ip) change with potential sweep
rate (v): ipincreases linear with v, for a surface process, while ip
changes with v1/2for a diffusion controlled process[5,6]. Dunn et al.
generalized Conway's method and proposed the deconvolution of the current into surface capacitive contribution (current changes with v) and diffusion controlled intercalation process (changing with v1/2) at
any given potential (V), leading to Eqs.(1)and(2):
i V v( , ) = k (V) + k (V)1 v 2 v1/2 (1)
i(V, )/v v1/2= k (V)v + k (V)
1 1/2 2 (2)
where k1and k2are two potential dependant constants, i the current
(A/cm²) and v the potential scan rate (V/s). k1and k2can be calculated
by using Eq.(2)by plotting the current versus v1/2and the capacitive
(k1.v) and diffusion limited contributions (k2.v1/2) can be obtained at
each potential at various scan rates [7]. Above equations are then broadly used by many groups as a standard measure to evaluate the kinetics of energy storage materials[10 16]. However, as mentioned before, Eq.(2)might not be valid at high scan rates when ohmic drop (iR) cannot be neglected because of high current; this brings another
⁎Corresponding authors at: CIRIMAT, Université de Toulouse, CNRS, INPT, UPS, 118, route de Narbonne, 31062 Toulouse cedex 9, France.
E-mail addresses:[email protected](Z. Lin),[email protected](P. Simon).
in DI water, followed by a sonication treatment in an ice bath for 1 h. Then, the resulting mixture was centrifuged at 3500 r.p.m for 1 h. The dark supernatant was collected carefully and used for preparing the freestanding Ti3C2Txdryfilm by a vacuum filtering process.
Activated porous carbon (YP50F) films were used as counter
electrode [22]. Typically, 95 wt% YP50F and 5 wt% Poly
tetrafluoroethylene (PTFE) solution were mixed to prepare a freestanding carbonfilm and then dried overnight in the vacuum oven.
2.2. Characterizations
X ray diffraction (XRD) patterns of Ti3C2Txfilms were recorded with
a Bruker D4 (Bruker, Germany) diffractometer using a Cu Kα radiation (λ = 0.154 nm) in the range 2θ = 5 50° at a step rate of 0.06° s-1.
Scanning electron microscope (SEM) observations of the Ti3C2Tx
films were made using a FEG SEM (Jeol JSM 6700F, Japan). Electrochemical tests were achieved using 2 electrode set up in Swagelok cells using 2 mm diameter disks of Ti3C2Txdryfilms (mass
loading of 2.2 mg cm-2) as working electrode and an over capacitive YP50Ffilm (≈ 20 times) as a counter electrode. The electrochemical stability of the counter electrode has been checked in a separate series of experiments (see Supplementary information). 3 M H2SO4,
1 M KOH and 0.5 M K2SO4 were used as electrolytes. A VMP3
potentiostat (Biologic) was used to run the electrochemical tests. All the cells were pre cycling at 20 mV/s for 50 cycles.
2.3. Multiple step chronoamperometry
MUSCA tests were carried out using various potential step of 25, 50, and 100 mV, with afix step duration of 120 s. For a typical MUSCA characterization of Ti3C2Txwith a step size of 100 mV, the working
electrode wasfirstly held at 0 V vs. YP50F to reach equilibrium. Then series of potential steps of 100 mV amplitude with a duration of 120 s was applied to the working electrode to explore the cathodic potential range until reaching the negative potential limit defined as 0.9 V vs. YP50F. Afterward, similar process with a step size of +100 mV was applied to scan the anodic potential range back to 0 V vs. YP50F. As shown inFig. 1a, the resulting current was monitored as a function of time at each potential step. The mean current (blue line) offirst 1 s at each potential step is given according to:
∫
i idt Δt = t 0 ∆ (3) whereΔt is the selected time, and i is the response current.For a step size of 100 mV, the potential range of 0.0 to 0.9 V (vs. YP50F) gives only a few data points for the one discharge/charge cycle which is not enough to rebuild a CV plot. In that case, five measurements were done starting at different initial potentials (0.0, 0.02, 0.04, 0.06 and 0.08 V vs. YP50F) to collect more data points at more potentials, to calculate the CV plots.
3. Results and discussion
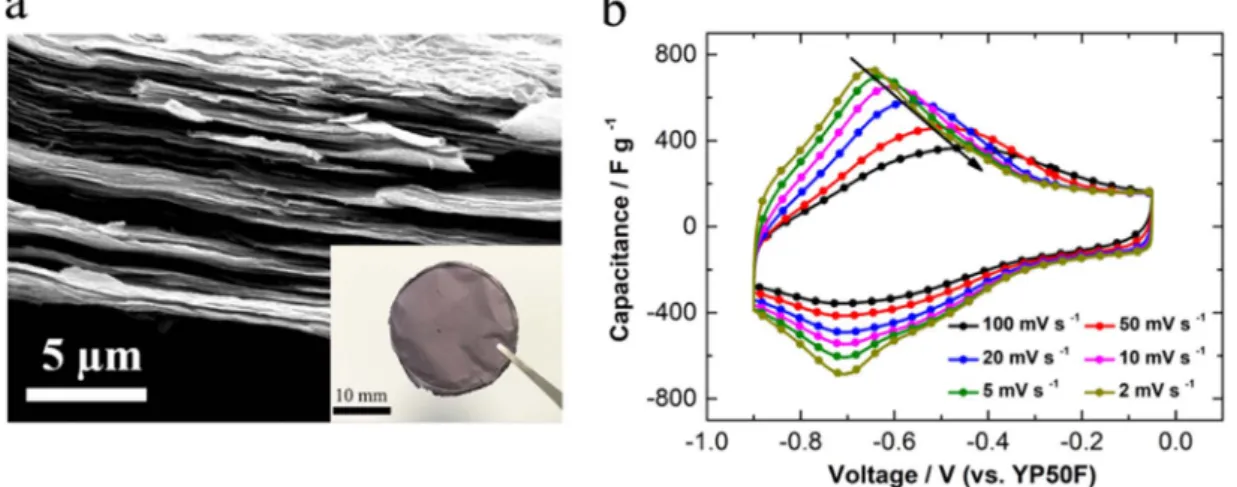
The inset ofFig. 2a shows an image of a binder free Ti3C2Txdryfilm
obtained by the vacuumfiltered process. The scanning electron micro scope (SEM) image of the cross sectional view (Fig. 2a) of this freestanding Ti3C2Txfilm shows a layer by layer structure composed
of 2D stacked MXene sheets. X ray diffraction (XRD) pattern of MXene freestanding film is shown in Fig. S1 and compared to the parent Ti3AlC2 MAX phase. The XRD pattern obtained for Ti3C2Tx is
consistent with previous reports [21,23]. A clear diffraction peak at limitation in addition to the electrochemical kinetics, leading to
distorted cyclic voltammograms [6,17]. Therefore, these previous electrochemical methods get far less accurate when an ohmic drop is not negligible anymore. Besides cyclic voltammetry based method, Long et al. recently suggested another interesting electrochemical technique to analyze the relative contributions of total charge by extracting frequency dependent information from electrochemical im pedance spectroscopy measurements. A three dimensional Bode plot analysis allows for deconvolving the capacitance change vs. frequency and potential, thus offering an interesting way to distinguish between capacitive processes (double layer and pseudocapacitive) and diffu sion limited processes (battery like) in the LiMn2O4 material [8].
Recently, another method called SPECS (for Step Potential Electrochemical Spectroscopy) was proposed by Donne et al. to separate the diffusion limited process from electrical double layer contribution [9]. An equation combining diffusion limited redox current (id), surface related capacitive current (iDL1), porous surface
area capacitive (iDL2) and residual current (iR) contributions was
proposed to fit the current response resulting from each potential step. The contributions of both capacitive, diffusion limited and parasitic redox reactions (residual current) can be identified, thus making SPECS an interesting tool to study redox reactions and charge storage mechanisms. However, the important number of variables makes the resolution of equation complex, with the possibility of a non unique solution. Also, these theoretical equations are often not enough to consider the complex electrochemical answer, which leads to even more intricate equation [18]. Although the SPECS technique offers an interesting and promising approach to study the charge storage mechanisms of faradic and capacitive electrodes, further efforts are needed to build up the connection between the physical process and mathematical model.
Inspired by the SPECS method developed by Donne et al. [9,19,20], we propose in the present paper a general qualitative method called MUltiple Step ChronoAmperometry (MUSCA) which is intended to minimize ohmic drop contribution, thus allowing the electro chemical kinetic study of a pseudocapacitive electrode. In this paper, Ti3C2Tx MXene material was selected as the working electrode and
electrochemically characterized in aqueous electrolyte. Ti3C2Tx MXene
electrodes prepared from filtration of delaminated samples have shown high volumetric (1500 F cm-3) and areal (2 F cm-2) capacitance,
together with high power capability [11]. Those unique features make Ti3C2Tx MXene an interesting model material for demonstrating the
interest of the MUSCA method.
Indeed, using MUSCA method, ohmic drop corrected cyclic voltammograms of a Ti3C2Tx MXene electrode were calculated at
various potential scan rates. Then, the surface process and bulk process current contributions were successfully extracted using Dunn's meth odology[7]by plotting i v curves with a reduced ohmic drop at various scan rates.
2. Experimental 2.1. Electrode materials
Ti3C2Tx MXene materials were synthesized by selectively etching of
Al from Ti3AlC2 (Carbon Ukraine) in a mixture solution of hydrochloric
acid (HCl) and lithium fluoride (LiF) [11]. Specifically, 2 g Ti3AlC2
powder was added gradually to 40 mL of the etchant which is composed of 40 ml 9 M HCl (Fisher, Technical) and 2 g LiF powder (Fisher, Technical). After stirring 24 h at 35 ℃, the Ti3C2Tx suspension
was centrifuged and washed with the DI water until the pH value of the supernatant reached 6. Afterward, the Ti3C2Tx sediment was dispersed
around 2θ = 7° corresponding to the (002) peak is visible. This high intensity of this (002) peak indicates a restacking of Ti3C2Txflakes,
which is consistent with the SEM image.
Fig. 2b presents the experimental cyclic voltammetry plots recorded from 2 mV/s to 100 mV/s between 0.9 V/ref and OCV ( 0.05 V/ref), which are similar to previously reported results in the same electrolyte. The pair of redox peaks visible at 0.7 V originate from the pseudoca pacitive behavior of MXene based on the redox activity of Ti[11,24], which explains the slow kinetic at 0.7 V as well.
A key feature of the CV plots is the drift of the anodic current peak to higher potential with increasing scan rates; no such behavior is observed for the cathodic peak. This peak shift with increasing potential scan rate in CV plots can be ascribed to slow intrinsic electrochemical kinetics of the electrode or/and to ohmic limitation, since increasing the potential scan rate results in a current increase. Such a situation makes difficult to study the electrochemical kinetics by itself[18,25]. The advantage of the MUSCA technique is to minimize the ohmic contribution since each new potential step is achieved after reaching the full steady state at minimum current.
In most of the modern commercial potentiostats available today, basic cyclic voltammetry experiment is achieved by using a staircase ramping potential (Fig. S3). It consists of small amplitude potential steps during a very short time for instance, 0.1 mV step for 5 ms corresponding to 20 mV/s[26]. A similar linear increase of both the potential step and time step sizes should not change the scan rates (v = dE/dt). Differently from classical CV, a very large step time of 120 s is used in MUSCA technique instead of tiny changing time scales whatever the potential step was (25, 50, 100 mV). Therefore, within a
single potential chronoamperometry measurement, the current corre sponding to the potential step can be calculated at different scan rates according to Eq.(4)and equation:
v= ∆ /∆V t (4)
where ΔV is potential step amplitude, Δt is the selected time. For example, a 100 mV potential step for a duration of 120 s offers a minimum scan rate of 0.83 mV/s or larger like 10 mV/s, if we consider only thefirst 10 s.
Potential step amplitude is the most crucial factor for the MUSCA technique, so to select the best potential step amplitude, MUSCA measurements were carried out during both cathodic and anodic sweeps between 0.9 V/ref and 0 V/ref using various potential steps of 25, 50 and 100 mV. We then selected a potential value where only capacitive (double layer) electrochemical signature was observed, that is 0.2 V/ref (Fig. 2b), and calculated current at this potential at various scan rates according to the following procedure as previously described by Donne et al.[9].
The mean currents and scan rates were calculated according to Eqs. (3)and(4)and plotted inFig. 3a. The relationship between current and the scan rate can be described by:
i b v a
log = log +log (5)
where a and b are adjustable parameters.
As observed inFig. 2b, at 0.2 V/ref the current is purely capacitive and should change linearly with the potential scan rate (b = 1)[3]: this is what is observed inFig. 3a for all potential steps in a narrow scan rate range between 1 and 10 mV/s. Interestingly,Fig. 3a also shows Fig. 2. (a) Cross-section SEM image of Ti3C2Txdryfilm. The inset shows an optical image of a 42 mm-diameter Ti3C2Txdryfilm obtained by vacuum filtration; (b) cyclic
voltammograms plots of a Ti3C2TxMXenefilm in 3 M H2SO4electrolyte at various scan rates. The potential refers to the over-capacitive YP50F porous carbon counter electrode.
that the shift to linearity is different from a potential step to the other, as a consequence of the calculation of the potential scan rate. Best results were obtained for the higher potential step (100 mV), with a linear behavior preserved up to 100 mV/s. It should be noted that potential step size larger than 100 mV can be better but would give a limited number of data points within a potential window of 1 V. Therefore, a potential step size of 100 mV was selected as the best compromise to run the MUSCA experiments and calculate back the CV plots.
Fig. 1a presents a typical MUSCA measurement for Ti3C2TxMXene
electrode in 3 M H2SO4electrolyte, during both cathodic and anodic
sweeps with a potential step of 100 mV. The current change was recorded as a function of time for each potential step during 120 s that is until a constant current was reached.Fig. 1b shows an example of the current change with time during potential steps at 0.2 V/ref and 0.7 V/ref; both current response decay to nearly zero. A faster current decrease was observed at 0.2 V than at 0.7 V, indicating a smaller time constant at 0.2 V.
Eqs.(3)and(4)were used to calculate the mean current at various potentials and the resulting CV plots using MUSCA technique are shown inFig. 3b. The key difference with experimental CV plots from Fig. 2b is the small peak shift with the potential scan rate in the calculated CV plots: in MUSCA measurements, the use of long step time (120 s) enables response current decay to close to 0 before moving to next chronoamperometry step, with shallow residual current from the previous potential step and minimize ohmic polarization. Differently, these residual currents present in conventional CV experi ments (Fig. 2b) greatly enhance the ohmic polarization at high scan rates and contribute to the current peak shift (seeFig. S3).
A one dimensional (1D) diffusion model was considered in this work because both electricfield and electrolyte concentration gradients are assumed to be perpendicular to the electrode at the macroscopic and time scales of the measurements (1 to 100 s). According to Eq.(1), deconvoluting the values of k1 and k2 at each potential allows for
splitting the total current into the surface (linear change with v) and bulk (linear change with v1/2) processes contributions. As mentioned
earlier, real CV experiments suffer from the presence of ohmic polarization, especially at high scan rates (e.g., 100 mV/s). This issue can be avoided by using the calculated CV plots obtained from the Fig. 3. (a) Mean current versus scan rate at -0.2 V vs ref. (capacitive region,Fig. 2b) with potential step sizes of 25, 50 and 100 mV, respectively; (b) calculated CV plots obtained from MUSCA measurements with a potential step size of 100 mV. All data collected in 3 M H2SO4electrolyte.
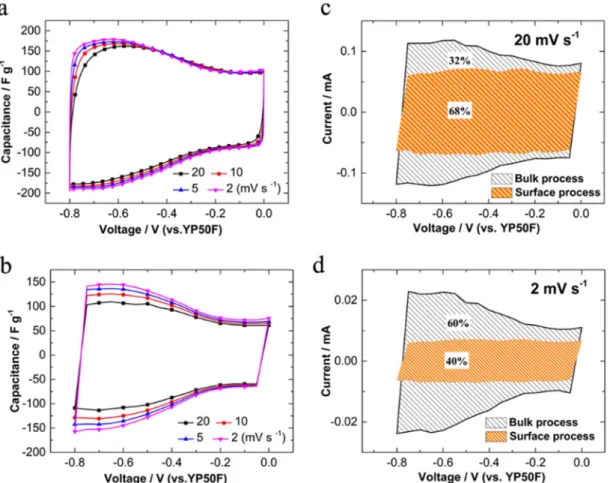
Fig. 4. Surface and bulk current contributions to the total charge at potential scan rates of (a) 20 mV/s and (b) 2 mV/s. The data were collected and calculated from MUSCA measurement in 3 M H2SO4electrolyte.
Fig. 5. Summary of surface and bulk process contributions to the total current in 3 M H2SO4electrolyte at various scan rates.
MUSCA method with minimized ohmic drops, as shown inFig. 3b. As observed, the anodic peak drift with the increasing scan rates has been drastically decreased so that a corrected cyclic voltammogram is allowed to be achieved making the further kinetic analysis more reliable. By determining k1and k2from Eq.(1), the fraction of the
current corresponding to k1v and k2v1/2 at each potential can be
calculated. Surface process (orange shaded area) and bulk process (black line shaded area) currents are calculated at 2 mV/s and 20 mV/s, as shown inFig. 4. The surface process contributed 67%, and 39% of the total charge at 20 mV/s and 2 mV/s, respectively.
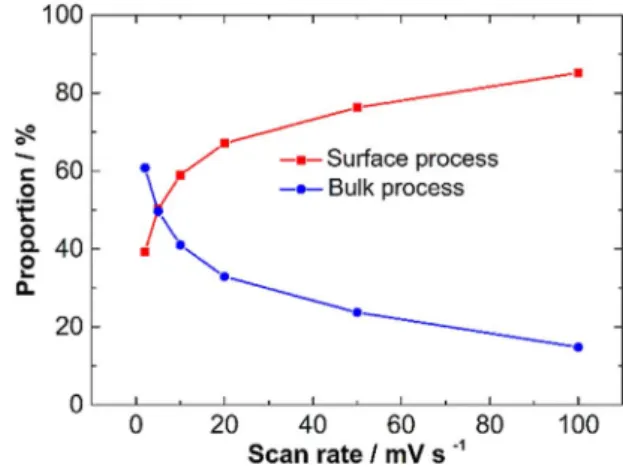
The proportion of surface versus bulk processes at various scan rates is presented inFig. 5. As expected, the capacitive charge storage dominates at higher scan rate, while the bulk process charge storage predominates at the low scan rate.
Similar MUSCA procedure was also achieved using Ti3C2Txelec
trode in 1 M KOH electrolyte. Experimental and calculated CV plots from MUSCA (Fig. 6a and b) show similar shapes. The total charge can be divided into two parts according to Eq.(1).Fig. 6c and d show the contributions of the surface process (no kinetic limitations) and bulk process (kinetic limitations) at scan rates of 20 mV/s and 2 mV/s.
Fig. 7 summarizes the ratio of the contributions of the two processes versus the potential scan rates. Interestingly, similar trends were observed in 1 M KOH and 3 M H2SO4while the electrochemical
reactions in Ti3C2TxMXene materials were found to be quite different
in acidic and alkaline electrolytes. The Ti3C2TxMXene specific capa
citance reaches 360 F g-1 in 3 M H
2SO4 and 135 F g-1 in 1 M KOH
(calculated from experimental CV plot at the scan rate of 2 mV/s), respectively. High capacitance in sulfuric acid is achieved thanks to the electrochemical redox reaction involving the change of titanium
oxidation state accompanied by protonation of oxygen functional groups [24,27]. The current increase at the low potential in alkaline electrolyte suggests that part of the charge is stored by redox reaction involving Ti atoms. Similar MUSCA procedure was also employed with MXene electrode in the neutral electrolyte (seeSupplementary information). The electrochemical signature (Fig. S4) shows a major contribution of the electrochemical double layer to the charge storage mechanism in agreement with the high k1/k2ratio (about 9) at 20 mV/s. The MUSCA method is thus
an efficient tool to analyze the electrochemical kinetics of MXene electrode in aqueous electrolytes.
Fig. 6. (a) Cyclic voltammograms plots from the realistic CV experiment; (b) calculated CV plots form the MUSCA measurement. The proportion of surface process and bulk process contributions to the total charge at scan rates of 20 mV/s (c) and 2 mV/s (d). All data collected in 1 M KOH electrolyte.
Fig. 7. Contributions of the surface process and bulk process contributions to the total charge, versus the potential scan rates in 1 M KOH electrolyte.
The authors declare no conflict of interest. Appendix A. Supporting information
Supplementary data associated with this article can be found in the online version atdoi:10.1016/j.ensm.2018.12.017.
References
[1] P. Simon, Y. Gogotsi, Nat. Mater. 7 (11) (2008) 845.
[2] V. Augustyn, P. Simon, B. Dunn, Energy Environ. Sci. 7 (5) (2014) 1597 1614. [3] H. Lindström, S. Södergren, A. Solbrand, H. Rensmo, J. Hjelm, A. Hagfeldt,
S.E. Lindquist, J. Phys. Chem. B 101 (39) (1997) 7717 7722.
[4] S. Ardizzone, G. Fregonara, S. Trasatti, Electrochim. Acta. 35 (1) (1990) 263 267. [5] B.E. Conway, D.C.W. Kannangara, J. Electrochem. Soc. 134 (1987) 906 918. [6] T.C. Liu, W.G. Pell, B.E. Conway, S.L. Roberson, J. Electrochem. Soc. 145 (1998)
1882 1888.
[7] J. Wang, J. Polleux, J. Lim, B. Dunn, J. Phys. Chem. C 111 (2007) 14925 14931. [8] A.J. Gibson, S.W. Donne, J. Power Sources 359 (2017) 520 528.
[9] J.S. Ko, M.B. Sassin, D.R. Rolison, J.W. Long, Electrochim. Acta 275 (2018) 225 235.
[10] H.-S. Kim, J.B. Cook, H. Lin, J.S. Ko, S.H. Tolbert, V. Ozolins, B. Dunn, Nat. Mater. 16 (2017) 454 460.
[11] M.R. Lukatskaya, S. Kota, Z. Lin, M.-Q. Zhao, N. Shpigel, M.D. Levi, J. Halim, P.-L. Taberna, M.W. Barsoum, P. Simon, Y. Gogotsi, Nat. Energy. 2 (2017) 17105. [12] J. Wang, H. Tang, L. Zhang, H. Ren, R. Yu, Q. Jin, J. Qi, D. Mao, M. Yang, Y. Wang,
P. Liu, Y. Zhang, Y. Wen, L. Gu, G. Ma, Z. Su, Z. Tang, H. Zhao, D. Wang, Nat. Energy. 1 (2016) 16050.
[13] J. Niu, R. Shao, M. Liu, J. Liang, Z. Zhang, M. Dou, Y. Huang, F. Wang, Energy Storage Materials. 12, 2108, pp. 145 152.
[14] L.F. Que, F.D. Yu, Z.B. Wang, D.M. Gu, Small 14 (2018) 1704508. [15] L. Kong, C. Zhang, J. Wang, W. Qiao, L. Ling, D. Long, ACS Nano 9 (2015)
11200 11208.
[16] Z. Jian, V. Raju, Z. Li, Z. Xing, Y.S. Hu, X. Ji, Adv. Funct. Mater. 25 (2015) 5778 5785.13.
[17] R.G. Compton, C.E. Banks, World Sci. (2011).
[18] A.J. Bard, L.R. Faulkner, Electrochem. Methods 2 (2001) 482. [19] M.F. Dupont, S.W. Donne, Electrochim. Acta 167 (2015) 268 277. [20] M.F. Dupont, S.W. Donne, J. Power Sources 326 (2016) 613 623.
[21] M. Naguib, M. Kurtoglu, V. Presser, J. Lu, J. Niu, M. Heon, L. Hultman, Y. Gogosti, M.W. Barsoum, Adv. Mater. 23 (2011) 4248 4253.
[22] J. Chmiola, G. Yushin, Y. Gogotsi, C. Portet, P. Simon, P.L. Taberna, Science 313 (5794) (2006) 1760 1763.
[23] M. Alhabeb, K. Maleski, B. Anasori, P. Lelyukh, L. Clark, S. Sin, Y. Gogotsi, Chem. Mater. 29 (18) (2017) 7633 7644.
[24] M. Hu, Z. Li, T. Hu, S. Zhu, C. Zhang, X. Wang, ACS Nano 10 (12) (2016) 11344 11350.
[25] C.H. Hamann, A. Hamnett, W. Vielstich, New York, 2007.
[26] C. Batchelor-McAuley, M. Yang, E.M. Hall, R.G. Compton, J. Electroanal. Chem. 758 (2015) 1 6.
[27] M.R. Lukatskaya, S.M. Bak, X. Yu, X.Q. Yang, M.W. Barsoum, Y. Gogotsi, Adv. Energy Mater. 5 (15) (2015) 1500589.
4. Conclusions
In this paper, a multiple potential step chronoamperometry (MUSCA) method was proposed to calculate cyclic voltammogram plots of MXene materials at various scan rates in aqueous electrolytes. MUSCA allows for building back the CV plots by minimizing the effect of ohmic drops arising from high currents at the high potential scan rate. The calculated CV plots of Ti3C2TxMXene in aqueous electrolytes
using the MUSCA method show similar shape compared to experi mental ones, allowing kinetics study of the charge storage mechanism. The contributions of the surface and bulk processes to the total charge in MXene electrode were obtained by determining k1 (surface process)
and k2 (bulk process) constants. As expected, the surface process
dominates at higher scan rate while the bulk process takes over at the low scan rate. Also, the nature of the electrolyte affects the capacitance, the electrochemical kinetics as well as the charge storage mechanism. As a result, the proposed MUSCA method can be used as an efficient tool to develop advanced materials for electrochemical energy storage devices.
Acknowledgements
H. S and K. X were supported by China Scholarship Council (No. 201608370077 and No. 201606160046). Z. L, P. S. and PL. T thank the ANR Labex Storex for support.