Quebec 2018, a failure of the polls or else? Claire Durand,
Professor, dept of sociology, Université de Montréal [email protected] Dept. de sociologie, Université de Montréal, C.P. 6128, Succursale Centre-Ville, Montréal, H3C 3J7 André Blais,
Professor, dept. of political science, Université de Montréal [email protected]
Dept. de science politique, Université de Montréal,
C.P. 6128, Succursale Centre-Ville, Montréal, H3C 3J7
Quebec 2018: A Failure of the Polls? Canadian Journal of Political Science CLAIRE DURAND, ANDRÉ BLAIS
DOI: 10.1017/S0008423919000787
Abstract
The polls of the 2018 Quebec election forecasted a close race between the two leading parties. The result, a clear victory of the Coalition Avenir Québec (CAQ) over the Parti Libéral du Québec (PLQ) was clearly at odds with the polls. We argue that when the polls get it wrong, it is important to determine whether it is a polling miss, that is, the
discrepancy is due to changing voter behaviour, or a poll failure, that is, the problem
stems from polling methodology. Our post-election poll shows that changing voter behaviour -- last minute shifts and the vote of non-disclosers -- explains most of the discrepancy. These movements varied by region. We conclude that the Quebec 2018 election was among the worse polling misses in history but not necessarily a major poll failure.
Les sondages de l’élection Québécoise de 2018 avaient annoncé une lutte serrée entre les deux principaux partis. Le résultat, une victoire décisive de la Coalition Avenir Québec (CAQ) aux dépens du Parti Liberal du Québec (PLQ), n’était clairement pas ce qui avait été anticipé. Nous soutenons que, lorsque les sondages se trompent, il est important de déterminer si l’écart entre les estimations des sondages et le vote est dû à un changement dans le comportement des électeurs ou à un échec des sondages eux-mêmes attribuable à la méthodologie utilisée. Notre sondage post-électoral montre que des changements dans le comportement des électeurs – changements de préférences de dernière minute et vote des discrets – expliquent la majeure partie des écarts dans cette élection. Ces mouvements varient toutefois selon les régions. Nous concluons que l’élection québécoise de 2018 se situe historiquement parmi les pires écarts entre les sondages et le vote mais ne peut pas être considérée comme un échec majeur des sondages eux-mêmes.
Acknowledgements:
We wish to thank the reviewers for their very relevant comments and suggestions that greatly helped improve this paper. We also wish to thank Ipsos Canada for their professional and financial contribution. The SSHRC, grant 435-2014-0077, and the Faculté des Arts et des Sciences, Université de Montréal, also contributed financially to this research. Finally, we wish to thank Philippe J. Fournier (Qc125) for his
The results of the Quebec election held on October 1st 2018 came as a shock. All the polls
conducted during the last week before the election had shown a close race between the Liberal Party of Quebec (PLQ – Parti Libéral du Québec) and the Coalition Avenir Québec (CAQ). The three main pollsters – Ipsos, Léger and Mainstreet -- estimated the difference between these parties at two percentage points or less. Three polls from other pollsters conducted during the last days of the campaign, two of them with small samples (n=500), had shown a larger margin (2.6-5 points). However, none of them came close to the election result, that is, a margin of 12.6 points. Therefore, media and academics alike spoke of the “worst score in the history of electoral polls in Quebec”. This would also be ranked among the worst in the world, including in recent elections in western countries (Jennings and Wlezien 2018), if we take only the polls conducted during the last week before the election.
In this article, we make a distinction between polling miss and poll failure. We propose that three criteria need to be present to conclude to a poll failure. Using these criteria, we determine whether the Quebec 2018 election was indeed a poll failure. In order to do so, we rely on two sources of data. First, we analyze the estimates of the polls conducted during the campaign in order to assess the global performance of the polls. Second, we use the results of a re-contact survey conducted among respondents of the last pre-electoral survey conducted by Ipsos in order to understand whether changes in voter behaviour may explain the performance of the polls. We analyze this poll both at the national and regional level in order to assess whether voter behaviour is similar across regions and contexts.
Polling miss or poll failure?
“Poll failures” are not new. Some well-known cases have led to in-depth analyses that have been published in reports and major journals, starting with the U.S. 1948 election (Mosteller, 1949). More recently, the 1992 U.K. election (Jowell et al., 1993) and the 2002 French Presidential election (Durand, Blais and Larochelle, 2004), in particular, were considered major shocks. Other cases – like the 1998 Quebec election (Durand and Blais, 1999; Durand, Blais and Vachon, 2001, 2002), the 2002 Hungarian election (Bodor, 2012) and the 2006 Italian election (Callegaro & Gasperoni, 2008) -- were less publicized.
What are the common grounds that lead observers to conclude that there is a poll failure? There are two clear cases. First, and this is the most common situation, the winning side is not the one that the polls forecasted to win (U.S., 1948 and 2016, see Mosteller, 1949 and Kennedy et al., 2016, 2017; Brexit, 2016, see Dunford and Kirk, 2016 and Duncan, 2016; France 2002 1st round, see Durand et al., 2004; Australia, 2019, see Lewis, 2004). Second, the story told by the polls was not the one that occurred in the end, that is, the polls predicted a close race and the reverse happened or vice-versa (Quebec, 1998, see Durand et al., 2001, 2002; UK, 1992 and 2015, see Jowell et al., 1993 and Sturgis et al., 2016, 2018; Hungary, 2002, see Bodor, 2012; Italy, 2006, see Callegaro and Gasperoni, 2008; Chili, 2017, see Durand et al., 2018). However, in some of these cases, analyses show no significant difference between the polls and the vote (Australia, 2019, U.S. 2016, Brexit, 2016, for example). In other situations where the discrepancy between the polls and the vote is significant (UK 1997, see Curtice, 1997; France 2007, see Durand,
2008a, 2008b), the polling miss go undetected because the winner was accurately forecasted and the “story” corresponded to the results (Prosser and Mellon, 2018).
These recent “failures” may have given the impression that polls have become less reliable. According to Jennings and Wlezien (2018) and Puleston (2017), this is not the case. In analyses of over 330 elections in more than 40 countries, they show that, on the contrary, poll error has decreased over the years.
But what exactly is a poll failure? We suggest that the first criterion is that the polls significantly – statistically -- err in their prediction of the vote -- that is, the election results lie outside the polls’ margin of error or credibility interval (see: Baker et al., 2013, who suggest to use the term “credibility interval” when applying the traditional formula for the margin of error to polls conducted using non-probability samples).
The “story” told by the polls leads to a second criterion. All or almost all the polls have to err in the same direction and at a similar level. This latter criterion is essential since it is because all the polls are telling the same story that the polls are blamed for having misled the population.
We need a third criterion to conclude to a poll failure. The source of the error has to lie with the polls themselves, that is, their samples, methodology, weighting, likely voter models, question order, etc., which means that we have to rule out the possibility of a last minute shift among voters. Voter behaviour may indeed explain discrepancies. First, voters may change their mind late, after the last polls were conducted. Second, people who do not reveal their preferences -- the “discrete” or non-disclosers -- may
disproportionately vote for the party that appears underestimated by the polls. Third, those who finally do not show up to vote may disproportionately be supporters of the party that is overestimated by the polls. If we can show that such behaviour occurred at a level that explains the discrepancy, we cannot dismiss the possibility that the polls were right when they were conducted. Therefore, if we cannot rule out the possibility that voter
behaviour is responsible for the discrepancy, we cannot conclude that the polls failed.
If only the first criterion is met, that is, there are significant differences between some polls – but not all or most of them -- and the vote, we would call it a pollster failure and look for possible house or mode effects. If the two first criteria are met, that is, there is systematic poll bias (Prosser and Mellon, 2018), we conclude to a polling miss and we need to look for possible explanations, first in terms of voter behaviour. Finally, a poll
failure is a systematic poll discrepancy that cannot be explained by voter behaviour.
How can we determine whether voter behaviour is responsible for a polling miss? Our claim is that only post-electoral surveys among respondents of pre-election surveys can tell whether a late swing or differential non-response or turnout occurred. This type of analysis has been carried out in the UK 2015 (Sturgis et al., 2016, 2018) and Quebec 1998 (Durand, Blais and Vachon, 2001) elections. In these cases, the authors concluded that voter behaviour did not significantly contribute to error and therefore went on looking for methodological explanations. Only in the UK 1970 election was a late campaign swing large enough to be considered the main reason for the polling
discrepancy (Prosser and Mellon, 2018). In this paper, we examine whether the Quebec 2018 election was a poll failure, that is, a situation where the three criteria – significant difference, generalized bias, absence of differential voter behaviour -- are met.
The 2018 Quebec election: A poll failure or a polling miss?
We first examine the two criteria necessary to conclude to a polling miss, that is, a) whether there is a significant difference between the polls and the vote and b) whether all the polls erred in the same direction. We then use a re-contact survey to examine whether the third criterion is met, that is, whether late changes in voter behaviour or differential turnout explain the discrepancy.
What do the campaign polls tell us?
Figure 1 shows the evolution of vote intentions for the four main parties over the course of the campaign, as estimated using a local regression (Cleveland and Devlin, 1988; Loader, 1999; Jacoby, 2000). Support for the first three parties did not change much during the campaign. Movement occurred mostly for the fourth party, Québec Solidaire (QS), which increased its share of the vote from around 12 per cent to 17 per cent during the campaign. In addition, the distance between the two main parties appeared to
Figure 1. Support for the main political parties during the campaign.
The polls forecasted the support for the CAQ at 33 per cent while it received 37.4 per cent of the vote. On the opposite, they estimated the support for the PLQ at 30 per cent and the party received 24.8 per cent of the vote. This was an unexpected result since, based on historical evidence, pollsters and researchers alike had come to expect an underestimation of the PLQ vote (Durand, 2002). However, support for the two other parties was almost perfectly estimated. This rings a bell since, if methodological factors were at play, we would need to explain why the error occurred only for the two main parties.
The polls conducted during the last week of the campaign
Six polls were conducted during the last week of the campaign and five of them – the exception is the Angus Reid poll -- were published during the campaign. The methods used are diverse. Léger and Angus Reid use their own web panels. Ipsos uses a mix of
telephone interviews (32%) and web (68%), relying on three different sources for the web sample. Mainstreet and Forum use Interactive Voice Response (IVR). Research Co. uses a web panel with samples provided by the Lucid platform.
A number of measures have been proposed to summarize the level of discrepancy between the polls and the vote. Mosteller (1949) proposed eight different measures for the U.S. 1948 presidential election. Following Mitofsty (1998)’s recommendation, most researchers make sure to present the average of the absolute error (AAE) between the polls and the vote for the main candidates, M3 in Mosteller’s terms, for comparative purposes. More recently, Martin, Traugott and Kennedy (2005) proposed a new measure, “A”, which is the log of the odds ratio of the estimated vote share of the two leading parties or candidates over their vote share in the election. This measure has two interesting properties: It is comparable between elections and it is signed in a way that gives an indication of the political bias of the polls (Martin et al., 2005; Callegaro and Gasperoni, 2008; Durand, 2008; Arzheimer and Evans, 2013; Wright, Farrar and Russel, 2014). Besides, it may be generalized for multiple parties/candidates (A’, see Durand, 2008; Arzheimer and Evans, 2013; Wright, Farrar and Russel, 2014).
Table 1 shows that the five polls published during the last week of the campaign estimated the difference between the two leading parties, the CAQ and the PLQ, at 2.6 points on average. There is no difference according to the methodology used. However,
Start End Mode N total N disclosers CAQ PLQ PQ QS Others Diff CAQ-PLQ M3 A CAQ-PLQ A' for CAQ Léger 24.09.2018 27.09.2018 Web 1502 1338 32.0 30.0 19.0 17.0 2.0 2.0 3.35 -0.346 -0.239
Ipsos 26.09.2018 28.09.2018 Tel & web 1250 1042 32.0 31.0 18.0 16.0 3.0 1.0 3.15 -0.379 -0.239
Mainstreet 26.09.2018 28.09.2018 IVR 2637 2501 30.7 28.7 19.8 17.1 3.7 2.0 3.58 -0.343 -0.299 Research.co 28.09.2018 30.09.2018 Web 625 550 33.0 30.0 18.0 16.0 3.0 3.0 2.65 -0.316 -0.193 Forum 30.09.2018 30.09.2018 IVR 1845* 1716 33.0 28.0 20.0 17.0 2.0 5.0 2.85 -0.247 -0.193 Average 24.09.2018 30.09.2018 Mean 1429 32.1 29.5 19.0 16.6 2.7 2.60 3.12 -0.326 -0.233 Angus-Reid 25.09.2018 30.09.2018 Web 635 502 32.0 25.0 18.0 20.0 5.0 7.0 2.60 -0.164 -0.239 Election results 01.10.2018 37.4 24.8 17.1 16.1 4.6 12.6
* estimated from information provided by the firm.
the two polls conducted during the last week-end of the campaign forecasted a larger gap, that is, 3 per cent and 5 per cent, respectively. The Angus Reid poll estimated the gap at 7 points and its estimation of the PLQ vote is perfect. The election results showed a 12.6-point gap, significantly larger than any of the polls’ estimates. However, the fact that the last polls forecasted a larger gap may hint at possible movements at the end of the campaign.
In order to compare likes with likes, we compare with elections where polls were conducted during the last week before the election. In the Quebec 2018 election, M3 varies between 2.8 and 3.3 for an average of 3.1. In the 2015 U.K. election, considered a major polling miss, the average M3 statistic for the last week was 2.1 (Sturgis, 2016, 2018). If we compare within Quebec, the statistic was 2.9 in 1998, a well-known poll failure (Durand and Blais, 1999; Durand et al., 2001, 2002).
If we now turn to A– the log odds for CAQ over PLQ in the polls and in the election – it varies from -0.25 to -0.38 with a mean of -0.33. All measures are highly significant and they are all signed in the same direction, confirming the poll bias against the CAQ. Comparing with similar elections and taking only the polls conducted during the last week of the campaign, it was -0.17 for the Conservatives over Labour in the U.K. 2015 election as well as for the PLQ over the PQ in the Quebec 1998 election.
The A’ measure – the log odds of CAQ vs all the others – also shows a significant difference between the polls and the election outcome, against the CAQ. It varies between -.19 and -.30 for an average of -.23. In comparison, it was -.18 for the
performance of A’ in 2018 is better than that of the Quebec 1998 election because support for two of the four major parties was well estimated in 2018.
In summary, all the measures lead to conclude to a major and significant error of the polls. This error is more substantial for the two leading parties and it is constant across polls. Therefore, our two first criteria, that is, the presence of a significant difference between the polls and the outcome and the fact that all the polls err in the same direction are met. We can conclude that we have a polling miss. We now need to check whether changing voter behaviour explains the discrepancy, that is, whether we have a poll failure.
What does the re-contact survey tell us?
Ipsos Canada conducted its last poll of the campaign between September 26 and 28 among 1250 respondents using a data collection method combining web surveys (n=850) and telephone interviews (n=400). Following the election, Ipsos cooperated with the authors to conduct a re-contact survey among respondents to the pre-election survey. The survey was short, with only 10 questions pertaining to voting behaviour, to the timing of the decision and to the reasons for vote choice. Two-thirds (67.4%) of the pre-election respondents completed the survey, for a total of 842 respondents, 250 from the telephone survey -- a cooperation rate of 62.5% -- and 492 from the web surveys (69.6%). The surveys were weighted separately according to age group, sex, region (post-stratified), years of schooling and mother tongue. Table A1 in the appendix compares unweighted and weighted pre and post-election respondents. It shows that, as in many surveys, the less educated and younger respondents were more difficult to reach. Younger respondents were even harder to contact in the post-election survey, which may have implications for
the estimation of the vote. However, these differences do not translate into a major
difference between the unweighted and weighted samples in terms of voting intention and there is no significant difference between the post and pre-election surveys for any of the variables. The ratio of the highest to the lowest weight is rather high -- 16.9 and 17.3 in the pre and post electoral polls respectively. Part of it is due to the necessity to
compensate for regional stratification.
o Does changing voting behaviour explain the difference between the polls
and the vote?
Table 2 compares the pre-election estimates for the total and the post electoral samples with the election results and the post-election reported vote. While Ipsos, similarly to all other pollsters, anticipated a close race between the two leading political parties (see Table 1) in its last pre-election poll, its post-election re-contact poll estimates are much closer to the results. They give an exact estimation of the distance between the two leading parties and the estimates of the vote share within the margin of error, except for QS.
We use these data to combine respondents’ answers to the pre-election and post-election surveys. Table 3 shows these pre-post patterns. Overall, 63 per cent of the respondents reported having voted for the party they intended to vote for. This is 78 per cent of all voting respondents. These stable respondents are distributed almost equally between CAQ voters, PLQ voters and voters for the other parties. We now turn to the three possible explanations relative to voter behaviour that may explain the polling
discrepancy. First, 8.2 per cent of the respondents changed their mind and voted for a different party than the one they intended to vote for. More than half of those (56%) reported having voted for CAQ, that is, 4.6 per cent of the respondents (5.7% of voters).
Pre-electoral vote intention
Election
Results Reported vote All respondents
Post-election respondents
Post-election respondents Sept. 26-28 Sept. 26-28 Oct. 1st Oct. 12-19
CAQ 31.9% 30.3% 37.4% 39.7% PLQ 31.1% 31.6% 24.8% 28.0% PQ 17.5% 17.5% 17.1% 15.1% QS 16.4% 15.5% 16.1% 12.4% Others 3.1% 5.0% 4.6% 4.7% Weighted n 1015 686 673
Second, 9.6 per cent of the respondents did not disclose any preference in the pre-election poll but declared a vote for a party after the election. Again, the majority (55%) of these respondents reported having voted for CAQ. This is 5.3 per cent of the respondents (6.6% of the voters).
Finally, the third possible explanation is differential turnout. Using aggregated data at the local level, Durand (2018) showed that turnout was particularly low in the ridings in the West Island of Montreal, where there is a concentration of non-French speakers and PLQ voters. However, the re-contact survey does not show that PLQ voters were more likely to stay home on election day.
This suggests that last minute change of mind and the voting behaviour of non-disclosers explains in good part the discrepancy between the polls and the outcome. More than 30 per cent of all declared CAQ voters (in the post-election survey) had reported a
preference for another party or were undecided or discrete in the pre-election poll. Mtl Île Mtl Couronne Qc RMR ROQ
Total Voters only
Stable 64.1 59.9 77.1 59.5 62.9% 78.0% - CAQ 21.8% 27.1% - PLQ 19.4% 24.1% - Others 21.7% 27.0% Move to CAQ 2.0 9.5 2.9 2.5 4.6% 5.7% Discrete to CAQ 1.5 6.0 1.9 8.6 5.3% 6.6%
Move to other parties3.5 4.8 1.9 3.2 3.6% 4.5%
Discrete to other parties4.0 5.2 1.9 4.7 4.3% 5.3%
Non-discrete twds no vote15.2 7.1 7.6 13.3 11.2%
Discrete twds no vote9.6 7.5 6.7 8.2 8.2%
Weighted n 833 672
Unweighted n 835 705
Turnout in election60.1 69.5 71.1 65.9 66.4%
Therefore, we can conclude that there was seemingly a large movement towards that party in the last days of the campaign.
o Are respondents’ answers reliable?
Could it be that people are not telling the truth and just pretend to have rallied behind the winner? This is a common explanation for polling discrepancies. Four pieces of
information allow us to probe the reliability of our findings. We examine the
respondents’ answers in the pre-election survey about how certain/uncertain they were about their vote choice as well as their expectations about who would win the election. We also look at their answers in the post-election survey about the timing of their decision and the reasons they give for their vote.
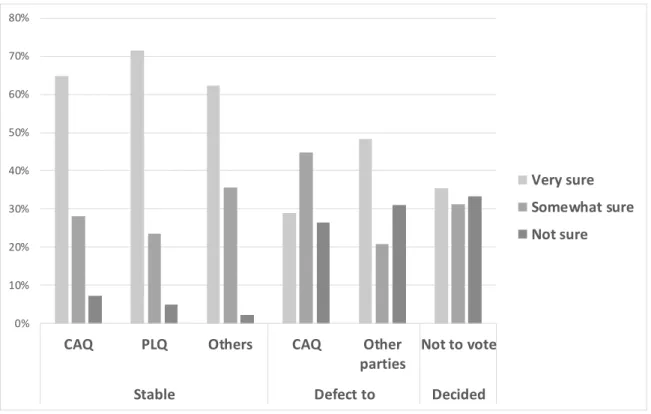
Figure 2. Behaviour on Election Day According to Pre-electoral Certainty of Choice
0% 10% 20% 30% 40% 50% 60% 70% 80%
CAQ PLQ Others CAQ Other
parties
Not to vote
Stable Defect to Decided
Very sure Somewhat sure Not sure
The first question that comes to mind is whether the respondents who declare having changed their mind were unsure about their decision when surveyed before the election. Only those who revealed a preference for a party get to answer this question. Over all, 87.7% were absolutely (58.2%) or fairly (29.4%) sure of their choice in the pre-election poll. This is 89% among the respondents of the post-election poll. Figure 2 shows the answers to this question according to patterns of declaration. Shifting respondents and non-voters were much more likely to state that they were not sure of their choice (χ2 (10)
= 108.1, p<.000). Between 3 and 7 per cent of stable voters for the different parties were not sure of their choice. On the contrary, defectors, whether to CAQ or to another party and decided respondents who did not vote, were not sure of their choice in proportions varying from 26 to more than 34 per cent. Therefore, those who changed were indeed more uncertain about their decision, which makes sense.
Figure 3. Behaviour on election day according to perception of who is likely to win
The pre-election survey also asked the Web respondents which party they thought would win the election. Close to two respondents out of five (38.8%) anticipated that CAQ would win the election. This is similar (39.6%) among post-election respondents. There are significant differences in expectations about who is likely to win (χ2 (16) = 344.8, p<.000), but this difference shows mostly among stable voters for the two leading parties who are more likely to think that their preferred party is going to win. Figure 3 shows that those who defected to CAQ were not more likely to think that CAQ would win the
election than those who defected to other parties. The non-disclosers who decided for a party, whether CAQ or another party, are more likely to have said that they did not know who would win.
0% 10% 20% 30% 40% 50% 60% 70% 80% 90% C A Q P LQ O th er s C A Q O th er s C A Q O th er s N o t d is cr et e D is cr et e
Stable Defect to Discrete to Non -voter
PLQ will win CAQ will win Don't know/others
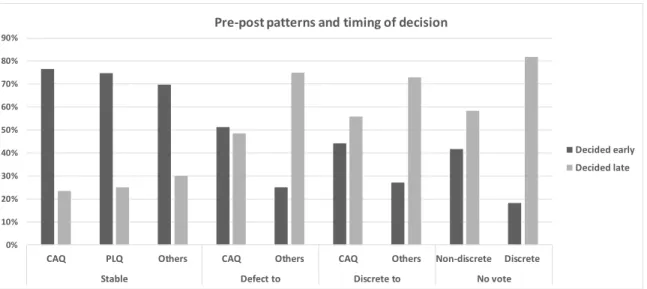
Figure 4. Pre-post patterns and timing of decision
We also examined whether those who changed their minds or moved from discrete to a specific vote choice made their decision later than stable respondents. Over all, 21% of the respondents declared having decided during the last week-end before the election and 15% on election day or even in the booth. We consider these respondents as late deciders. There is a significant difference between shifting and stable respondents (χ2 (8) = 86.1, p<.000). As illustrated in Figure 4, shifting respondents, non-disclosers who decided to vote and non-voters were all more likely to report having made their decision late. Among stable respondents, only 20 to 30 per cent decided late while among other respondents the proportion varies between 49 and 82 per cent.
0% 10% 20% 30% 40% 50% 60% 70% 80% 90%
CAQ PLQ Others CAQ Others CAQ Others Non-discrete Discrete
Stable Defect to Discrete to No vote
Pre-post patterns and timing of decision
Decided early Decided late
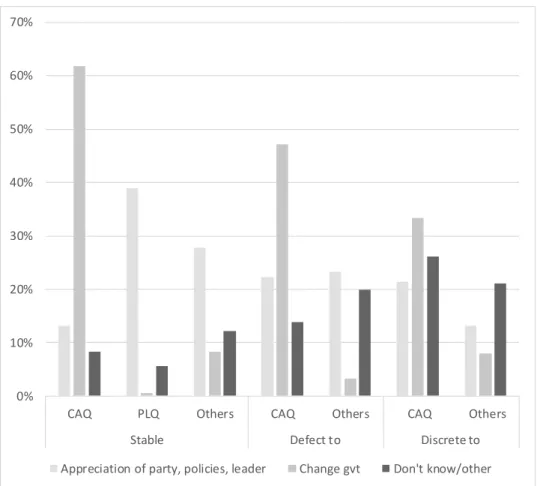
Figure 5. Reasons for reported vote according to pre-post patterns
Finally, respondents were asked, in an open-ended question, what was the main reason for their vote. These answers were first coded by Ipsos and then verified by the authors. We focus on three categories: general appreciation of the party – I like the leader, the policies and so forth --, change government – get rid of the PLQ, time for change – and no answer/other reasons. The Chi square test for the difference between all the answers and behaviour is highly significant (χ2 (72) = 466, p<.000). Figure 5 illustrates that the main reason for the CAQ vote is undoubtedly appetite for change. However, stable CAQ voters were more likely to give this reason for their vote than the shifters or the non-disclosers who finally voted for CAQ.
0% 10% 20% 30% 40% 50% 60% 70%
CAQ PLQ Others CAQ Others CAQ Others
Stable Defect to Discrete to
All these tests indicate that the answers given by our respondents are consistent and reliable, that their reported vote is not the bare illustration of social desirability or willingness to declare having voted for the winner.
Is changing voter behaviour similar in all regions?
This section aims at better understanding and validating whether changing voter behaviour is responsible for the polling discrepancy. We examine whether the pre-post patterns of change are the same in the different regions of Québec. The election results at the regional level are estimated using the data available at the Directeur Général des Élections du Québec (DGEQ) with the same regional divisions used by the pollsters, that is: Island of Montreal, Montreal suburbs, Quebec City region and Rest of Quebec (ROQ). The Montreal Island is the metropolis. It is characterized by high urban concentration and cultural and ethnic diversity. The Montreal Suburbs constitute the rest of the greater Montreal region. Residents are mostly French-speaking. The Quebec City region is the seat of government. It is an urban area characterized by high homogeneity of French- speaking residents. Finally, the Rest of Quebec includes all the regions outside the two major cities. It is also mostly French-speaking.
The Island of Montreal voted quite differently than the other regions. It is the only region where the PLQ received the plurality of the votes (43%) and it is also the region where QS got the largest proportion of the vote (22%). In all the other regions, the CAQ was first with more than 40 per cent of the vote, the PLQ received around 20 per cent, and QS between 14 per cent and 17 per cent. The PQ received around 12 per cent of the vote on the Montreal Island and in the Quebec City region and around 20 per cent elsewhere.
Turnout on the Island of Montreal (60%) and in the rest of Quebec (66%) was lower than in the Montreal Suburbs (69%) and in the Quebec City region (71%).
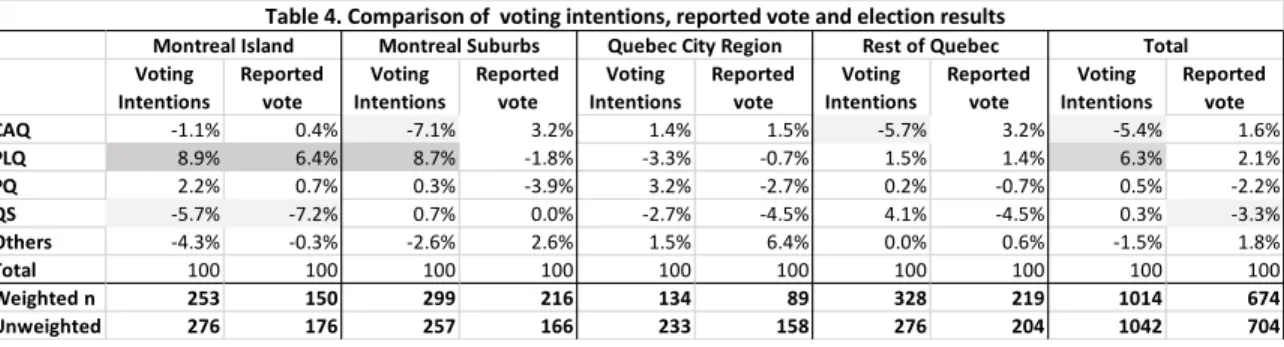
Table 4 shows the difference between voting intentions and reported vote on one side and the actual outcome on the other side, by region. It shows that the underestimation of CAQ comes solely from the suburbs of Montreal and the rest of Quebec. In both regions, there is a significant difference between voting intentions for CAQ and actual vote. As for the PLQ, its overestimation is concentrated in the greater Montreal area, that is, the Montreal Island and suburbs. The reported vote corrects the underestimation of the CAQ vote in the Montreal suburbs and in the rest of Quebec as well as the overestimation of the PLQ vote in the Montreal Suburbs. It does not correct the discrepancy between the estimates and the outcome on the Montreal Island. The underestimation of the QS vote in the post-election poll is present in three out of four regions, which may be related to the difficulty to reach young voters. Finally, in the Quebec City region, the vote was well estimated in the pre-election and post-election surveys.
What does this mean for movements between parties and from non-disclosers? As expected, there is a significant difference between regions (χ2 (24) = 104.4, p<.000).
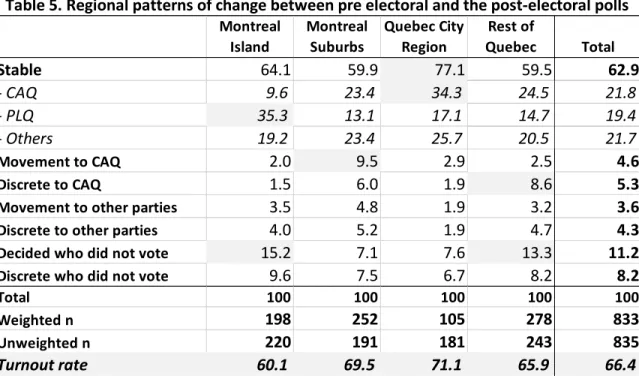
Given the sample size, only some of the differences are significant. Table 5 shows that Voting Intentions Reported vote Voting Intentions Reported vote Voting Intentions Reported vote Voting Intentions Reported vote Voting Intentions Reported vote CAQ -1.1% 0.4% -7.1% 3.2% 1.4% 1.5% -5.7% 3.2% -5.4% 1.6% PLQ 8.9% 6.4% 8.7% -1.8% -3.3% -0.7% 1.5% 1.4% 6.3% 2.1% PQ 2.2% 0.7% 0.3% -3.9% 3.2% -2.7% 0.2% -0.7% 0.5% -2.2% QS -5.7% -7.2% 0.7% 0.0% -2.7% -4.5% 4.1% -4.5% 0.3% -3.3% Others -4.3% -0.3% -2.6% 2.6% 1.5% 6.4% 0.0% 0.6% -1.5% 1.8% Total 100 100 100 100 100 100 100 100 100 100 Weighted n 253 150 299 216 134 89 328 219 1014 674 Unweighted n 276 176 257 166 233 158 276 204 1042 704
Table 4. Comparison of voting intentions, reported vote and election results
stability between voting intentions and the vote cast was higher in the Quebec City area, in favour of the CAQ, and on the Montreal Island, in favour of the PLQ.
Movements towards the CAQ are more frequent in the Montreal suburbs and shifts from non-disclosers to vote for the CAQ were more likely in the rest of Quebec.
We conclude that the patterns that we have seen at the national level do not translate in the same way in the different regions. The polls failed mostly in the regions where there were disproportionate movements towards the CAQ from decided or discrete
respondents, that is, in the Montreal suburbs and the Rest of Quebec. In the Quebec City region, the polls were right from the beginning and on the Montreal Island they were wrong and stayed wrong. The bad estimation on the Montreal Island is not explained by movement and therefore could be due to methodological features, possibly differential
Montreal Island Montreal Suburbs Quebec City Region Rest of Quebec Total Stable 64.1 59.9 77.1 59.5 62.9 - CAQ 9.6 23.4 34.3 24.5 21.8 - PLQ 35.3 13.1 17.1 14.7 19.4 - Others 19.2 23.4 25.7 20.5 21.7 Movement to CAQ 2.0 9.5 2.9 2.5 4.6 Discrete to CAQ 1.5 6.0 1.9 8.6 5.3
Movement to other parties 3.5 4.8 1.9 3.2 3.6
Discrete to other parties 4.0 5.2 1.9 4.7 4.3
Decided who did not vote 15.2 7.1 7.6 13.3 11.2
Discrete who did not vote 9.6 7.5 6.7 8.2 8.2
Total 100 100 100 100 100
Weighted n 198 252 105 278 833
Unweighted n 220 191 181 243 835
Turnout rate 60.1 69.5 71.1 65.9 66.4
turnout. It goes in the same direction as the conclusion reached by Mellon and Prosser (2017) for the UK 2015 election concerning missing non-voters.
Overall, we end up with three different situations. In the Quebec City region, there is no error of the polls. In the Montreal suburbs and in the rest of Quebec, there is a polling miss but no poll failure. However, the polling misses seem due to different shifts in voter behaviour in the two regions. Finally, on the Montreal Island, we conclude to a poll failure: both the pre-election and the post election polls show a significant discrepancy between the polls and the vote and no shift in the voter behaviour explains the difference.
Conclusion
Every polling error teaches us something about the polls’ possible biases and about the dynamics of electoral campaigns. Since polling methodology currently undergoes a major transformation and diversification (Prosser and Mellon, 2018), it is even more important to understand what happened in Quebec, whether the polls themselves or voter behaviour are the culprit for the polling error.
We have shown that the Quebec 2018 election is a polling miss since the two essential criteria – a significant difference between the polls and the vote and a systematic bias from all the pollsters – are met. However, contrary to other elections (Quebec 1998 and UK 2015) where re-contact surveys were conducted to assess whether voter behaviour may explain the discrepancy, the Quebec 2018 election does not globally qualify as a poll failure. The difference between the polls and the vote is mostly explained by last minute movements towards the underestimated party combined with a tendency of
are regional differences in these movements. This is a unique contribution since, to our knowledge, no other analysis of polling errors has examined regional patterns. These patterns lead to conclude that changing voter behaviour in two specific regions, outside the two major cities, explain most of the polling discrepancy. However, the estimates for the Montreal Island are off target before and after the election, which leads to think that methodological factors are at play, that is, the polls failed on the Montreal Island.
The answers that respondents gave to other questions regarding the certainty and timing of their decision as well as the reasons for their reported vote choice corroborate our analyses. A will for change indeed characterized this election after 15 years of almost continuous PLQ government and the CAQ came to represent, especially in the last moments of the campaign, the vehicle for change.
There are some limits to this analysis. First, we would have liked to have multiple re-contact surveys in order to confirm our results. Sturgis et al. (2016, 2018), for example, could count on five re-contact surveys for their analysis of the UK 2015 election. However, the re-contact survey conducted by another firm, Leger360, is consistent with our findings (Léger, 2018). Second, a larger sample size and a better cooperation rate would also have been preferable.
In a world of voter volatility, it seems that voters may decide on their vote at the last minute. We may of course attribute these changes to various events that occurred during the last days of the campaign, but this is a posteriori speculation. In such an environment, what are the pollsters supposed to do? How can they forecast the vote? The last Quebec election is full of lessons. First, pollsters should poll later in the campaign. Second,
pollsters and the media alike should inform the public that voter behaviour has become more difficult to predict.
Finally, researchers have a dual responsibility. On the one hand, they need to stress that the polls are right most of the time, that they usually accurately forecast the outcome of an election. However, they also need to remind people that errors do occur, that polls should be trusted, but with a good dose of scepticism.
References:
Arzheimer, Kai and Jocelyn Evans. 2014). “A New Multinomial Accuracy Measure for Polling Bias.” Political Analysis, 22 (1): 31-44. doi:10.1093/pan/mpt012Baker, Reg, Brick, J. Michael, Bates, Nancy A., Battaglia, Mike, Couper, Mick P., Dever, Jill A., Gile, Krista J. and Roger Tourangeau. 2013. Report of the AAPOR Task Force on Non-Probability Sampling. https://www.aapor.org/Education-Resources/Reports/Non-Probability-Sampling.aspx, retrieved on February 22, 2019.
Bodor, Tamas. 2012. “Hungary's “Black Sunday” of Public Opinion Research: The Anatomy of a Failed Election Forecast.” International Journal of Public Opinion Research 24 (4): 450–471, https://doi.org/10.1093/ijpor/edr039
Callegaro, Mario and Giancarlo Gasperoni. 2008. “Accuracy of Pre-Election Polls for the 2006 Italian Parliamentary Election: Too Close to Call.” International Journal of Public Opinion Research 20 (2): 148–170. https://doi.org/10.1093/ijpor/edn015
Cleveland, William S. and Susan J. Devlin. 1988. “Locally Weighted Regression: An Approach to Regression Analysis by Local Fitting.” Journal of the American Statistical Association 83 (403): 596-610.
Curtice, John. 1997. “So How Well Did They Do? The Polls of the 1997 Election.” Journal of the Market Research Society 39: 449-461.
Dunford, Daniel & Ashley Kirk. 2016. “How right or wrong were the polls about the EU referendum?” The Telegraph, June 20 2016.
https://www.telegraph.co.uk/news/2016/06/24/eu-referendum-how-right-or-wrong-were-the-polls/
Duncan, Pamela. 2016. “How the pollsters got it wrong on the EU referendum.” The Guardian, June 24 2016, https://www.theguardian.com/politics/2016/jun/24/how-eu-referendum-pollsters-wrong-opinion-predict-close
Durand, Claire and André Blais. 1999. “Why did the polls go wrong in the 1998 Quebec Election? The answer from post election polls.” Bulletin de méthodologie sociologique (BMS) 62: 43-48.
Durand, Claire, Blais, André and Sébastien Vachon. 2002. “Accounting for Biases in Election Surveys: The Case of the 1998 Quebec Election.” Journal of Official statistics 18 (1): 25-44.
Durand, Claire, Blais, André and Sébastien Vachon. 2001. “A Late Campaign Swing or a Failure of the Polls? The Case of the 1998 Quebec Election.” Public Opinion Quarterly 65 (1): 108-123.
Durand, Claire. 2002. “Are Quebec polls biased against Liberals?” Policy options / Options politiques March 2002: 51-56.
Durand, Claire, Blais, André and Mylène Larochelle. 2004. “The polls in the 2002 French presidential election: An autopsy.” Public Opinion Quarterly 68 (4): 602–622.
Durand, Claire. 2008a. “La Méthodologie des sondages électoraux de l'élection présidentielle française de 2007, chroniques d'un problème récurrent. ” Bulletin de méthodologie sociologique (BMS) 97: 5-17.
Durand, Claire. 2008b. “The polls of the 2007 French presidential campaign: Were lessons learned from the 2002 catastrophe?” International Journal of Public Opinion Research 20 (3): 275–298.
Durand, Claire, Johnson, Timothy, Moreno, Alejandro and Michael Traugott. 2018. “Report of the WAPOR Committee Reviewing the Pre‐election Polls in the 2017 Presidential Election in Chile.” https://wapor.org/wp-content/uploads/Final-WAPOR-Report-on-Chile-2017-Election.pdf
Durand, Claire (2018). “Quebec 2018: A Tough Night for Pollsters.” Policy Options/Options politiques October 24, 2018.
https://policyoptions.irpp.org/magazines/october-2018/quebec-2018-a-tough-night-for-pollsters/
Jacoby, William G. 2000. “Loess: a nonparametric, graphical tool for depicting relationships between variables.” Electoral Studies 19: 577-613.
Jennings, Will and Christopher Wlezien. 2018. “Election polling errors across time and space.” Nature Human Behaviour 2: 276-283.
Jowell, Roger, Hedges, Barry, Lynn, Peter, Farrant, Graham and Anthony Heath. 1993. “The 1992 British election: The failure of the polls.” Public Opinion Quarterly 57 (2): 238–263.
Kennedy, Courtney, Blumenthal, Mark, Clement, Scott, Clinton, Joshua D., Durand, Claire, Franklin, Charles, McGeeney, Kyley, Miringoff, Lee, Olson, Kristen, Rivers, Douglas, Saad, Lydia, Witt, C. Evans and Christopher Wlezien. 2018. “An Evaluation of 2016 Election Polls in the U.S.”. Public Opinion Quarterly 82 (1): 1-33.
https://doi.org/10.1093/poq/nfx047.
Kennedy, Courtney, Blumenthal, Mark, Clement, Scott, Clinton, Joshua D., Durand, Claire, Franklin, Charles, McGeeney, Kyley, Miringoff, Lee, Olson, Kristen, Rivers, Douglas, Saad, Lydia, Witt, C. Evans and Christopher Wlezien. 2017. “An Evaluation of 2016 Election Polls in the U.S. Report of the AAPOR Adhoc committee of 2016 election polling.” https://www.aapor.org/Education-Resources/Reports/An-Evaluation-of-2016-Election-Polls-in-the-U-S.aspx
Léger, Jean-Marc (2018). “Que s’est-il vraiment passé? ” Journal de Montréal, 6 octobre 2018.
Lewis, Peter. 2019. “As pollsters, we are rightly in the firing line after the Australian election. What happened?” The Guardian, May 21, 2019.
https://www.theguardian.com/commentisfree/2019/may/21/as-pollsters-we-are-rightly-in-the-firing-line-after-the-australian-election-what-happened
Loader, Clive. 1999. Local Regression and Likelihood: New York: Springer.
Martin, Elizabeth A., Traugott, Michael W. and Courtney Kennedy. 2005. “A Review and Proposal for a New Measure of Poll Accuracy.” Public Opinion Quarterly 69 (3): 342-369.
Mellon, Jonathan and Christopher Prosser. 2017. “Missing Nonvoters and Misweighted Samples: Explaining the 2015 Great British Polling Miss.” Public Opinion Quarterly 81 (3): 661-687.
Mitofsky, Warren J. 1998. “Was 1996 a worse year for polls than 1948?” Public Opinion Quarterly 62 (2): 230–249.
Mosteller, Frederick. 1949. Measuring the error. In Mosteller, Frederick, Hyman,
Herbert, McCarthy, Philip J., Marks, Eli S. and David B. Truman (Eds.) The pre-election polls of 1948. Report to the committee on analysis and pre-election polls and forecast. New York: Social Science Research Council: 54-80.
Prosser, Christopher and Jonathan Mellon. 2018. “The Twilight of the Polls? A Review of Trends in Polling Accuracy and the Causes of Polling Misses.” Government and Opposition 53 (4): 757-790. doi:10.1017/gov.2018.7
Puleston, Jon. 2017. “Are we Getting Worse at Political Polling?” ESOMAR Publications Series Volume Congress 2017. https://www.esomar.org/uploads/public/events-and-
awards/events/2017/congress/documents/ESOMAR-Congress-2017_185446_61_Puleston.pdf
Sturgis, Patrick, Baker, Nick, Callegaro, Mario, Fisher, Stephen, Green, Jane, Jennings, Will, Kuha, Jouni, Lauderdale, Benjamin E. and Patten Smith. 2016. Report of the Inquiry into the 2015 British general election opinion polls. Published by the British Polling Council and the Market Research Society, London, March 2016.
Sturgis, Patrick, Kuha, Jouni, Baker, Nick, Callegaro, Mario, Fisher, Stephen, Green, Jane, Jennings, Will, Lauderdale, Benjamin E. and Patten Smith. (2018). “An assessment of the causes of the errors in the 2015 UK general election opinion polls.” Journal of the Royal Statistical Society A 181: 757-781. doi:10.1111/rssa.12329
Wright, Malcolm J., Farrar, David P. and Deborah F. Russell. 2014. “Polling Accuracy in a Multiparty Election.” International Journal of Public Opinion Research, 26 (1): 113– 124, https://doi.org/10.1093/ijpor/edt009
Appendix 1. Comparison of the pre and post electoral surveys
Unweighted Weighted Unweighted Weighted
n= 1250 1250 842 842 Mode CATI_line 16.8 17.1 16.2 15.8 CATI_cell 15.2 16.4 12.2 13.9 WEB 68.0 66.5 71.6 70.4 Region Montreal Island 25.2 23.7 26.1 23.6
Montreal rest of CMA 25.4 30.1 22.8 30.2
Quebec Region 21.7 12.5 21.6 12.5
South of St-Lawrence River 21.6 23.3 23.2 23.3
North of St-Lawrence River 6.2 10.4 6.3 10.4
Mother tongue French 79.8 79.0 79.1 79.0 English 14.6 15.7 16.2 16.8 Other 5.4 5.3 4.6 4.1 Age Group 18-34 years old 19.7 26.0 16.7 26.0 35-54 years old 36.2 33.0 37.4 33.0
55 years old and over 44.1 41.0 45.8 41.0
Years of schooling
Less than HS diploma 5.6 11.2 4.5 8.6
HS diploma 15.4 29.8 16.7 32.4 Technical or college 34.4 27.0 33.1 26.8 University diploma 44.3 31.8 45.2 31.9 Income Less than 20 000 $ 7.8 10.2 7.6 9.0 20 000 $ - 40 000 $ 17.3 21.9 18.8 23.7 40 000 - 60 000 $ 17.0 17.8 18.4 19.6 60 000 - 80 000 $ 13.7 12.9 13.1 11.8 80 000 - 100 000 $ 11.2 9.8 10.3 9.4 100 000 $ - 150 000 $ 14.3 11.5 14.0 11.2 150 000 $ and over 6.8 5.0 6.5 4.9 Non response 12.0 10.8 11.3 10.4
Children less than 18 years old 26.2 25.7 25.8 25.4
Vote intention including leaning
Coalition Avenir Québec (CAQ) 25.4 25.9 26.4 25.8
Parti libéral du Québec (PLQ) 26.5 25.2 27.2 24.7
Parti Québécois (PQ) 13.8 14.2 13.9 14.3
Québec solidaire (QS) 13.7 13.3 12.9 12.6
Another party 4.1 2.5 4.4 4.1
Would not vote/would cancel 5.0 5.8 5.2 6.7
Do not know, not sure 11.6 13.0 10.0 11.8
Weight Min 0.26 0.31
Weight Max 4.39 5.38
Max/Min 16.88 17.35
Post-electoral Pre-electoral
Table A1. Comparison between pre-electoral and post-electoral respondents - recontact survey