HAL Id: hal-02316359
https://hal.archives-ouvertes.fr/hal-02316359
Submitted on 25 Oct 2019
HAL is a multi-disciplinary open access
archive for the deposit and dissemination of
sci-entific research documents, whether they are
pub-lished or not. The documents may come from
teaching and research institutions in France or
abroad, or from public or private research centers.
L’archive ouverte pluridisciplinaire HAL, est
destinée au dépôt et à la diffusion de documents
scientifiques de niveau recherche, publiés ou non,
émanant des établissements d’enseignement et de
recherche français ou étrangers, des laboratoires
publics ou privés.
Comparison of two time reversal schemes using circular
UWB measurements
Patrice Pajusco, Pascal Pagani
To cite this version:
Patrice Pajusco, Pascal Pagani. Comparison of two time reversal schemes using circular UWB
mea-surements. PIMRC 2007 : 18th International Symposium on Personal, Indoor and Mobile Radio
Communications, Sep 2007, Athens, Greece. pp.1 - 5, �10.1109/PIMRC.2007.4394726�. �hal-02316359�
COMPARISON OF TWO TIME REVERSAL SCHEMES USING CIRCULAR
UWB MEASUREMENTS
Patrice Pajusco Pascal Pagani France Télécom France Télécom Belfort, France Cesson Sévigné, France
ABSTRACT
Time Reversal is a promising technique for the improvement of future telecommunication systems. It may increase throughput while reducing receiver complexity. A better understanding of this capability requires more investigation on measured channels. This study used circular array propagation measurements. These measurements are efficient to estimate space-time focusing characteristics simultaneously. Because the delay spread parameter is inappropriate, a new parameter is introduced to study time focusing. Focusing parameters of two time reversal schemes are investigated. Time Reversal improves the data rate by a factor of three and increases the received power using the entire FCC bandwidth. The one-bit time reversal scheme improves space focusing but provides smaller gain on other focusing parameters. The trend is the same with smaller bandwidth, but the benefits are reduced. The optimal bandwidth should be close to 3 GHz.
I. INTRODUCTION
Time Reversal [1] has been studied for many years. It was initially investigated in the field of acoustics and more recently in the field of electromagnetics. Basically, Time Reversal (TR) consists in using channel state information at the transmitter. The channel impulse response is time reversed and complex conjugated. This calculation is equivalent to a matched filter applied at the transmitter. The perceived transmission channel becomes the autocorrelation of the propagation channel, which induces a channel hardening effect. The second and unexpected property is the spatial focusing. If the antenna is placed at some distance from the intended receiver, the peak of the perceived channel disappears. These two focusing properties are very promising for communication systems. TR may increase throughput while reducing the receiver complexity. Spatial focusing may enable space division multiple access, simultaneous streams towards a single user using antenna array or more confidential communications. TR requires a propagation channel with a large delay spread value. Such channels appear in rich scattering environments. Reciprocal and stationary channels are also needed.
TR was successfully used in underwater acoustic communication [2]. MIMO transmission schemes were also achieved [3]. Capabilities of TR with electromagnetic waves were investigated recently in [4]. UWB channel measurements were used to demonstrate the strength of TR using channel reciprocity. Other investigations were done in the same way for outdoor mobile wireless access at 2 GHz [5], fixed wireless access at 5 GHz [6] and short range applications [4, 7, 8]. TR of wideband microwaves were
experimentally demonstrated in reverberant rooms [9, 10]. UWB and acoustic waves have many similarities. UWB appears to be the most appropriate technology to combine with TR because of the success of TR in the field of acoustics. This paper presents the capability of two Time Reversal schemes using propagation measurement data. TR is introduced in section II and the two schemes are presented. Thereafter, the parameters used in the analysis are discussed in section III. A UWB propagation experiment is detailed in section IV. Statistical results are analyzed in section V. Finally, conclusions are drawn in section VI.
II. TIME REVERSAL
A. Principle
A radio link between an access point and a portable device is considered. The access point is stationary and defines the origin of the space. We assume a reciprocal channel which is true in linear medium. Thus, the channel impulse response is the same regardless of the direction of the radio link. Hence, the channel impulse response of the propagation channel between the access point and a terminal will be simply expressed by
h r
,
where
denotes the excess delay andr
the location of the terminal.
The intended receiver is located at the location
r
0 . TRconsists in estimating the channel impulse response at the transmitter. For example, the intended receiver can transmit a pulse which is sampled by the transmitter. Basically, the channel estimate is time reversed and complex conjugated, but other schemes are possible. Each of them has its own space-time focusing properties. The signal derived from the channel estimate
g
TR
r
0,
is used as a coding waveform and transmitted back to the receiver. The transmitted power is normalized to the unitary power to enable comparison between different schemes. At any locationr
, the perceived channel impulse response will be:
0 2 0,
,
,
,
TR per TRg
r
h
r
h r
g
r
d
(1)where
g
TR
r
0,
denotes the reversed signal of a time reversal scheme and the convolution with respect to the delay
.B. Basic Time Reversal scheme
The channel estimate is time reversed and complex conjugated. This operation is similar to a phase conjugation in the frequency domain. The time reversed signal can be expressed by :
*
0
,
0,
TR Simple
g
r
h r
(2)Where
r
0 denotes the location of the receiver andh r
,
the channel impulse response at locationr
.C. One-bit Time Reversal scheme
One-bit time reversal scheme was introduced in [11]. The signal transmitted back is expressed by
1 0 0 0,
sgn
,
sgn
,
TR bitg
r
h r
j
h r
(3)Where sgn denotes the sign function and
h
and
h
denote the real and imaginary part ofh
respectively.The use of one-bit digital converter may reduce costs and enable higher sampling rates. The definition of the start and the end of the channel impulse response is very important for the noise removal. In fact, each reversed tap has the same weight. The boundaries of the channel impulse response were obtained with a 20 dB threshold below the peak of the channel impulse response.
III. ANALYSIS PARAMETERS
A. Temporal focusing parameters 1) Delay spread
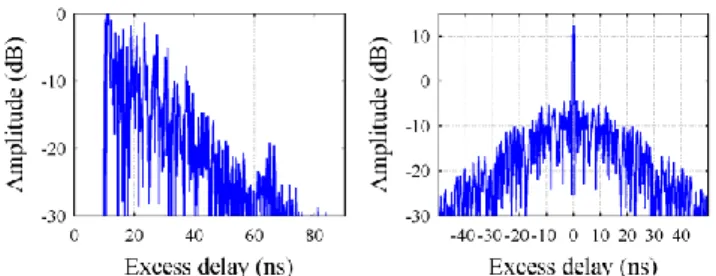
Delay Spread (DS) parameter is widely used to study wideband channels. It is often related to the achievable data rates. It is computed with the second moment of the average power delay profile. This parameter characterizes the spreading of the channel impulse response. A typical indoor channel was simulated using the Saleh & Valenzuela (SV) model [12]. It is represented on the left of Fig. 1. The perceived channel is plotted on the right. A Hanning window was used to reduce sidelobes and compute DS value. Table 1 shows the results for different threshold values.
Figure 1: Simulation of TR with SV model
Table 1: Influence of threshold on delay spread values
DS parameter is very sensitive to the cut-off threshold, especially with the perceived channel impulse response. Depending on the cut-off level, TR can reduce or increase the DS value. Moreover, this parameter does not show improvement of TR. Such a parameter is not appropriate to qualify time focusing of TR. To avoid biased results, a new parameter is introduced in the next section.
B. Signal to interference ratio
When the level of the received signal is sufficiently high, the bitrate is only limited by the Inter Symbol Interference (ISI). In this noise-free configuration, if the bitrate and the channel impulse response are known, the average ISI can be evaluated. An Equivalent Signal to Interference Ratio parameter denoted by ESIR is introduced to characterize the improvement of TR accurately. It corresponds to the average SIR for a given symbol rate R. The intended signal is assumed to be at the peak of the channel impulse response. Transmitted symbols are supposed independent. Multi-path interference are supposed equivalent to a gaussian noise. Considering this hypothesis, the average level of interference is the sum of the power of each interferer. The parameter is defined by:
2 max 10 2 max 0 10 log / h k h k k h ESIR R h k R
(4)This parameter provides the average SIR of the received signal at the sampling instant. An estimate of the maximal symbol rate in noise-free configuration is:
k dB k dB
R with ESIR R k (5) Considering a static channel and a simple uncoded BPSK modulation scheme, a SIR of 10.5 dB is required to achieve 10-6 bit error rate [13]. Hereunder, the parameter
10.5
R
will be computed to evaluate the upper bitrate of a basic receiver structure.C. Spatial focusing parameters 1) Peak to Peak Gain
A simple receiver structure estimates data by sampling the peak of the received signal. In order to study the improvement of TR, the Peak to Peak gain parameter is used. This parameter corresponds to the ratio between the strongest path
Threshold (dB) Channel Ds (ns) TR channel 15 7.1 0.1 20 8.0 3.2 30 9.4 8.0 40 9.8 9.6 50 9.9 10
of the channel impulse response and the strongest path of the perceived channel impulse response. It is defined by:
2 0 10 2 0 max , 2 10 log max , per h r p p h r (6)where
r
0denotes the target location2) Total received power gain
Advanced receiver structures are able to capture all the power carried by the channel impulse response. In order to evaluate potential gain of TR, the total received power gain is defined by:
2 0 10 2 0 , 10 log , per h r d h r d
(7)3) Spatial focusing gain
Spatial focusing may transmit streams simultaneously towards nearby users. To evaluate interference between users, the spatial focusing gain parameter is defined by:
2 10 2 0 max , 10 log max , per per h r r h r (4)IV. UWB PROPAGATION CHANNEL MEASUREMENTS
A. Circular array measurements
A better understanding of TR capability requires more investigation on measured channels. An efficient way to characterize space-time characteristic simultaneously was presented in [14],. The principle consists in using a virtual circular array. This particular configuration provides many combinations of angles and distances from each possible target along the circle. It enables reliable computation of the average focusing gain. The 2D focusing area can be also obtained. The experiment is briefly discussed hereafter for the purpose of this study.
A sounding technique in the frequency domain was used. The entire FCC frequency band for indoor UWB applications was probed. CMA 118 antennas were used at each side of the radio link. The schematic diagram of the experiment is depicted in Fig. 2. PC VNA - HP 8510 CMA 118 CMA 118 P1 P2 RS232 GPIB Long cable LNA LNA LNA
Figure 2 Schematic diagram of the measurement device The transmitting antenna was mounted on a trolley to simplify the displacement to the different location points. A
step motor, controlled using a RS232 link, enabled the rotation of the transmitter antenna. For each measurement, 90 complex channel impulse responses were sampled along a circle of 40 centimeters in diameter.
The receiving antenna was placed on a wall at a height of about 2 meters above the floor. Due to the asymmetry of the antenna pattern, the antenna was mounted upside down. This antenna was placed next to the VNA to minimize the loss of the received signal. A LNA was used to improve the link budget and the signal to noise ratio. The other input of the VNA was connected to the TX antenna with a long, low-loss cable. The maximum distance was limited to 20 m.
The UWB propagation channel was measured using the VNA HP8510C. The channel impulse responses were obtained using standard S21 parameter measurements. The propagation channel was sampled over 4005 equally spaced frequency tones between 3.1 and 11.1 GHz. This setup allowed a maximum excess delay of ~500 ns and a time resolution of ~125 ps. The entire measurement process was automated using the GPIB and RS232 links with MatlabTM software.
B. Measurement experiment setup
Two indoor office configurations were investigated. In the first scenario, the fixed antenna was located in a meeting room (h = 2.19m). In the second scenario, the fixed antenna was located in a corridor (h = 2.45m). In both cases, Line-Of-Sight (LOS) and Non Line-Of-Line-Of-Sight (NLOS) measurements were performed. The distance between transmitter and receiver ranges from 1 meter to 18 meters. More than 120 location points were measured corresponding to just under to 11 000 UWB channel impulse responses.
Figure 3 Floor plan of the two measurement areas
V. STATISTICAL RESULTS
A. Statistical analysis on the entire bandwidth 1) Basic time reversal scheme
The wider the bandwidth, the greater the benefit of TR. As an upper limit, the entire UWB frequency band between 3.1 and 10.6 GHz is considered to study focusing parameters. The statistical results of the basic TR scheme are presented on the left of Table 2. The LOS and NLOS configurations are reported. Considering the same transmitted power, TR increases the received power. In NLOS, the peak power of the perceived channel impulse is about 12 dB higher than the peak of the channel impulse response. In the same configuration, the total received power is also 7 dB higher. Such a gain can improve the link budget and the coverage of
an UWB system. A path loss model was defined in [15] using the same measurements. Using this path loss model in NLOS configuration, the 7 dB gain on the received power increases the cell radius by 65% and the coverage area by 172%. TR also reduces the Inter Symbol Interference. According to the parameter
R
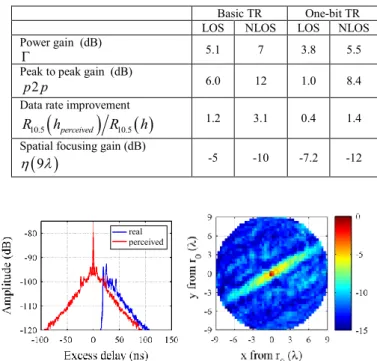
10.5, the data rate can be triple in NLOS using a basic receiver structure. At a distance of 9 from the intended receiver, a loss of 10 dB is observed at the peak of the perceived channel impulse response. This highlights a good spatial focusing capability. TR reduces interference level between close users and enables simultaneous transmissions. In LOS, the trend is the same but the gains are much smaller. To illustrate the behaviour of a simple TR scheme, a typical file was selected. The measurement file was chosen so that their focusing parameters were close to the average values. The results of this typical file are depicted in Fig. 4. On the left, the power delay profile of the 90 measured and perceived channel impulse responses are represented. The gain on the strongest path is about 12 dB and the total power gain is 7 dB. On the right, the focusing area is depicted. It is elongated and is directed inline with the transmitter location. The average focusing gain far from the intended centre is -10 dB.2) One-bit time reversal scheme
The statistical results of the one-bit TR scheme are reported on the right of the Table 2. One-bit scheme reduces the interference between users from -10.3 to -11.9 dB. The focusing area is two times smaller and may facilitate the transmission of simultaneous streams to the same user. Unfortunately, all the other gains are reduced. In NLOS, the average achievable bitrate is only multiplied by 1.4 instead of 3.1 with basic TR scheme. In LOS configuration, the achievable bitrate is worse with one-bit TR than without TR. One-bit TR scheme was applied on the previous typical example. The results are depicted in Fig. 5. On the left of the figure, the peak is not as high and the side lobe levels are higher than those depicted in Fig. 4. As a result, the ISI is bigger and explains the decrease in the bitrate. On the right of Fig. 5, the focusing area is depicted. The area is two times smaller than the basic TR scheme.
B. Statistical analysis versus bandwidth
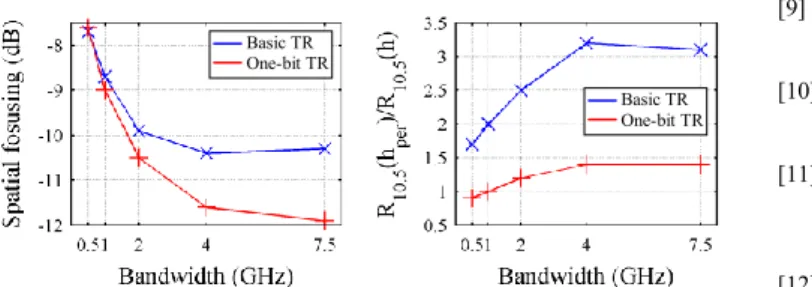
In a real communication system, the use of the entire bandwidth is not possible. Technology constraints limit the transmitted bandwidth to a few GHz. In order to obtain more relevant results, the statistical analysis was repeated using smaller bandwidth values. These values range from 0.5 to 7.5 GHz. The behavior of the received power is depicted in Fig. 6. On the left, the total power gain is depicted. The wider the bandwidth, the greater the gain in received power. One-bit TR scheme is not efficient enough to improve received power level. The gain is about 1.5 dB lower. On the right, the peak to peak gain is depicted. The bandwidth is represented on a log scale. An acceptable linear dependence is found on both schemes. The gain with one-bit scheme is about 3 dB lower. In a basic TR scheme, the transfer function of the transmitted
signal is the complex conjugate of the channel impulse response. Thus, more power is allocated on frequencies which are less attenuated. Considering the same transmitted power, the received power is increased. With a flat transfer function with Rayleigh fading, the gain is 3dB. When the bandwidth increases, the upper band is much more attenuated than the lower band. This explains that the gain increases with bandwidth. However, this scheme may need to reduce the transmitted power to fulfill transmit UWB requirements.
Table 2: Statistical of focusing parameters
Figure 4 : Typical NLOS measurement (basic TR scheme)
Figure 5 : Typical NLOS measurement (One-bit TR scheme)
Figure 6 : Received power gain function of bandwidth (NLOS configuration)
Basic TR One-bit TR LOS NLOS LOS NLOS Power gain (dB)
5.1 7 3.8 5.5
Peak to peak gain (dB) 2
p p 6.0 12 1.0 8.4
Data rate improvement
10.5 perceived 10.5
R h R h 1.2 3.1 0.4 1.4
Spatial focusing gain (dB)
9 -5 -10 -7.2 -12 real perceived real perceived Basic TR One-bit TR Basic TR One-bit TRIn the previous section, the improvement of spatial focusing of the one-bit TR scheme was presented. However, this gain is reduced when the bandwidth is smaller. The value tends to be the same as basic TR schemes.
Figure 7 : Spatial focusing and bitrate gain function of bandwidth in the NLOS configuration
The last parameter is the R10.5. This parameter estimates the
achievable bitrate. The R10.5 ratio between the perceived
channel and the measured channel provides an estimate of the improvement of bitrate on a basic receiver. Results are depicted on the right of Fig. 7. Basic TR scheme increases bitrate whatever the bandwidth. The wider the bandwidth, the greater the improvement. However, above 3 GHz the gain remains stable. The optimal bandwidth should be close to 3 GHz.
VI. CONCLUSION
This study investigated TR capability using extensive circular array propagation measurements. A new parameter was introduced to study time focusing because of the weakness of the delay spread parameter. The advantages and drawbacks of two TR schemes were presented. Over the entire FCC bandwidth, TR improves the data rate by three and increases the received power. The one-bit TR scheme improves spatial focusing but provides less gain on the other focusing parameters.
REFERENCES
[1] A. Derode, P. Roux, and M. Fink, "Acoustic time-reversal through high-order multiple scaterring," IEEE ultrasonics symposium, pp. 1091-1094, 1995.
[2] G. F. Edelmann, T. Akal, W. S. Hodgkiss, S. Kim, W. A. Kupperman, and H. C. Song, "An initial demonstration of underwater acoustic communication using time reversal," IEEE journal of oceanic engineering, vol. 27, 2002.
[3] H. C. Song, W. S. Hodgkiss, P. Roux, W. A. Kuperman, T. Akal, and M. Stevenson, "Coherent MIMO time reversal communications in shallow water," 2004.
[4] S. M. Emami, J. Hansen, A. D. Kim, G. Papanicolaou, A. J. Paulraj, D. Cheung, and C. Prettie, "Predicted time reversal performance in wireless communication using channel measurements," IEEE communication letters, vol. XX, 2002. [5] H. T. Nguyen, J. B. Andersen, and G. F. Pedersen, "The potential
use of time reversal techniques in multiple element antenna systems," IEEE communication letters, vol. 9, pp. 40-42, 2005. [6] P. Kyritsi, G. Papanicolaou, P. Eggers, and A. Oprea, "MISO time
reversal and delay-spread compression for FWA channels at 5 GHz," Antennas and Wireless Propagation Letters, vol. 3, pp. 96, 2004.
[7] A. E. Akogun, C. R. Qiu, and N. Guo, "Demonstrating Time Reversal in Ultra-wideband Communications using Time Domain
Measurements," presented at International Instrumentation Symposium, Knoxville, Tennessee, 2005.
[8] R. C. Qiu, C. J. Zhou, N. Guo, and J. Q. Zhang, "Time reversal with MISO for ultrawideband communications: experimental results," Antennas and Wireless Propagation Letters, vol. 5, pp. 269, 2006.
[9] G. Lerosey, J. De Rosny, A. Tourin, A. Derode, G. Montaldo, and M. Fink, "Time Reversal of electromagnetic waves," Physical Review Letters, 2004.
[10] G. Lerosey, J. de Rosny, A. Tourin, A. Derode, and M. Fink, "Time reversal of wideband microwaves," Applied Physics Letters (154101), 2006.
[11] A. Derode, A. Tourin, and M. Fink, "Ultrasonic pulse compression with one-bit time reversal through multiple scattering," Journal of applied physics, vol. 85 (9), pp. 6343-6352, 1999.
[12] A. Saleh and R. Valenzuela, "A Statistical Model for Indoor Multipath Propagation," Selected Areas in Communications, IEEE Journal on, vol. 5, pp. 128, 1987.
[13] J. G. Proakis, Digital Communications, McGraw-Hill ed, 2000. [14] P. Pajusco and P. Pagani, "Characterization of UWB Time
Reversal using circular array measurements," ECWT, 2007. [15] P. Pagani and P. Pajusco, "Experimental Analysis of the Ultra
Wideband Propagation Channel over the 3.1 GHz - 10.6 GHz Frequency Band," presented at PIMRC, Helsinki, 2006.
Basic TR One-bit TR
Basic TR One-bit TR