Estimating the availability of trace elements from
mining activities in the Ouje-Bougoumou region by
measuring their concentrations in sediments and in
sediment-dwelling animals
Presented to:
Ministère du Développement durable, de l’Environnement et des Parcs Ministère des Ressources naturelles et de la Faune
Campbell Resources Inc.
by
Isabelle Proulx and Landis Hare
INRS – Eau Terre Environnement 490 rue de la Couronne (Quebec City, QC) G1K 9A9
ii
ACKNOWLEDGEMENTS
We thank Dominic Ponton for his participation in the field sampling and Pierre-Luc Fortin, Lise Lamarche and Lorenzo Perozzi for their assistance with the rapport.
iii
Table of contents
1. Summary ... 1
2. Introduction ... 2
2.1. Evaluating the availability of sedimentary metals to sediment-dwelling animals usingthe [SEM]-[AVS] model ... 2
2.2. Evaluating metal availability by measuring metal concentrations in animals ... 3
2.3. Objective... 3
3. Choice of sites and sediment-dwelling animals ... 5
3.1. Choice of sites... 5
3.2. Choice of invertebrates ... 6
4. Methods ... 12
4.1. Collection and preparation of sediment and invertebrate samples ... 12
4.1.1. Sediments ... 12
4.1.2. Invertebrates ... 12
4.2. Chemical analyses ... 12
4.2.1. Trace elements in sediments ... 12
4.2.1.1. As, Ag, Ba, Be, Cd, Cr, Cu, Mn, Mo, Ni, Pb, Sb, Se, Sn, Tl and Zn ... 13
4.2.1.2. Hg ... 13
4.2.2. Acid volatile sulfides (AVS), simultaneously extracted metals (SEM) and fraction of organic carbon (foc) in sediments ... 13
4.2.2.1. Acid Volatile Sulfides (AVS) ... 13
4.2.2.2. Simultaneously Extracted Metals (SEM) ... 14
4.2.2.3. Fraction of organic carbon (foc) ... 14
4.2.3. Trace elements in invertebrates... 14
4.2.3.1. As, Ba, Cd, Cr, Cu, Mn, Ni, Se and Zn ... 14
4.2.3.2. Hg ... 14
4.3. Data analyses ... 15
5. Results ... 16
5.1. Concentrations of trace elements in sediments ... 16
5.1.2. Comparison of sedimentary trace element concentrations at upstream and downstream sites ... 16
iv 5.2. Concentrations of Acid Volatile Sulfide (AVS) and Simultaneously Extracted
Metals (SEM) in sediment ... 19 5.2.2. Bioavailability of sedimentary metals according to the SEM-AVS and the
SEM-AVS/foc approaches ... 19 5.3. Invertebrate trace element concentrations ... 21
5.3.1. Comparaison of trace elements concentrations measured in invertebrates collected at upstream and downstream sites ... 21
6. Discussion ... 28
6.1. Overview of differences in trace element concentrations at sites upstream and downstream of potential sources of contamination... 28 6.2. Why do trends in trace element concentrations in sediments disagree with
those for sediment-dwelling invertebrates? ... 31 6.3. Critical evaluation of trace element concentrations in invertebrates in
Oujé-Bougoumou ... 31
7. References ... 36
List of figures
Figure 1 Location of study areas (details of insets given in Figures 1A and 1B) ... 7
Figure 1-A Location of study sites in Lakes Aux Dorés and Chibougamau ... 8 Figure 1-B Location of study sites in the Nemenjiche River ... 9
List of tables
Table 1 Location and characteristics of sampling sites in our study. ... 6 Table 2 Identity, form, habitat and behaviour of invertebrates chosen for study ... 10 Table 3 Mean concentrations (nmol/g; n = 3 ± standard deviation) of sedimentary trace
elements ([M]) upstream and downstream of mining activities in Lakes Chibougamau and Aux Dorés. Values followed by the same letter are not significantly different (P > 0.05) ... 17 Table 4 Mean concentrations (nmol/g; n = 3 ± standard deviation) of sedimentary trace
elements ([M]) upstream and downstream of mining activities in the Nemenjiche River. Values followed by the same letter are not significantly different (P > 0.05) ... 18
v Table 5 Concentrations of Simultaneously Extracted Metals (*SEM+). Σ*SEM+.
concentrations of Acid Volatile Sulfide ([AVS]). as well as [SEM]-[AVS] values in Lake Chibougamau. Lake Aux Dorés and Nemenjiche River. Also given is the percentage of organic carbon (% oc) in sediment and a correction for the influence of this additional metal-binding phase (([SEM]-[AVS])/foc). Values for [Ag] are not reported because they were below the detection limit . ... 20 Table 6 Mean (± standard deviation) concentrations (nmol/g) of trace elements
measured in invertebrates collected from Lakes Chibougamau and Aux Dorés at sites upstream and downstream from mining activities. For a given element and invertebrate. values that do not differ significantly (P > 0.05) are followed by the same letter. The symbol « - » indicates that too few invertebrates were collected for analysis ... 22 Table 7 Mean (± standard deviation) concentrations (nmol/g) of trace elements
measured in invertebrates collected from the Nemenjiche River at sites upstream and downstream from mining activities. For a given element and invertebrate values that do not differ significantly (P>0.05) are followed by the same letter. The symbol « - » indicates that too few invertebrates were collected for analysis ... 26 Table 8 Summary of trends in trace element concentrations ([M]) in sediments and in
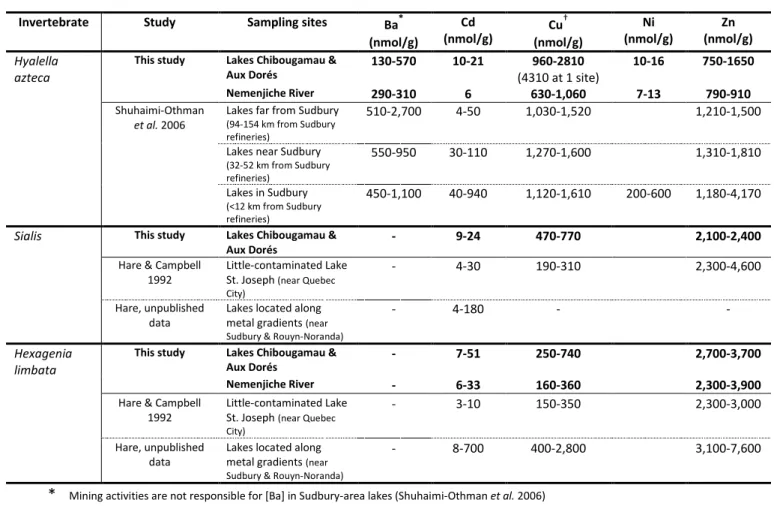
invertebrates. as well as values of SEM-AVS. at sites upstream and downstream from mining activities ... 29 Table 9 Concentration ranges for trace elements in invertebrates collected in the
Ouje-Bougoumou region compared to those for the same types of invertebrates collected elsewhere in Quebec or Ontario ... 32 Table 10 Comparison between the range of trace element concentrations ([M]) in
Hyalella azteca collected in the Ouje-Bougoumou region and those that are
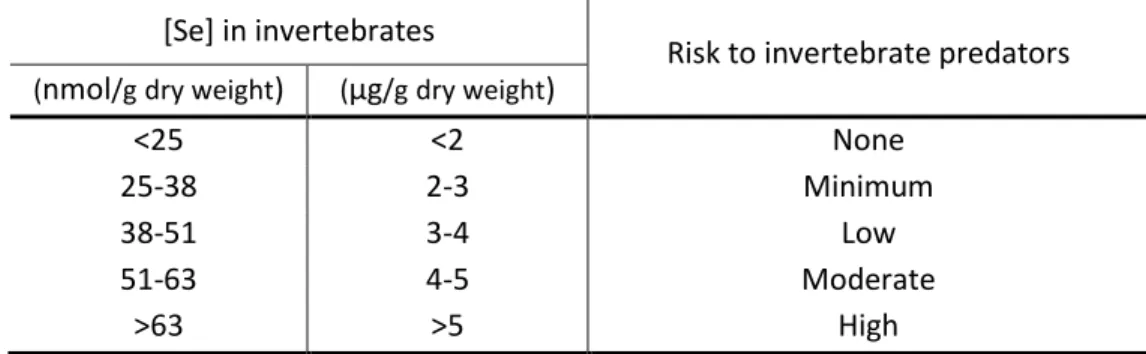
reported to produce 25% mortality (LBC25; calculated using a saturation model) ... 33 Table 11 Risk of toxicity or reproductive effects in fish and aquatic birds feeding on
invertebrates having various concentrations of Se (Lemly 2002) ... 34 Table 12 Mean (± standard deviation. n=3) concentrations (in mg/kg) of trace elements
([M]) in sediments collected upstream and downstream of mining and processing activities in Lakes Chibougamau and Aux Dorés. There is no significant difference (P > 0.05) between means for the same element when values are followed by the same letter ... 41
vi Table 13 Mean (± standard deviation. n=3) concentrations (mg/kg) of trace elements
([M]) in sediments from the Nemenjiche River upstream and downstream of activities related to the Joe Mann mine. There is no significant difference (P > 0.05) between means for the same element when values are followed by the same letter ... 42 Table 14 Mean (± standard deviation) concentrations (mg/kg) of trace elements
measured in invertebrates collected from Lakes Chibougamau and Aux Dorés at sites upstream and downstream from mining activities. For a given element and invertebrate values that do not differ significatly (P > 0.05) are followed by the same letter. The symbol «-» indicates that too few invertebrates were collected for analysis ... 43 Table 15 Mean (± standard deviation) concentrations (mg/kg) of trace elements
measured in invertebrates collected from the Nemenjiche River at sites upstream and downstream from mining activities. For a given element and invertebrate. values that do not differ significantly (P > 0.05) are followed by the same letter. The symbol « - » indicates that too few invertebrates were collected for analysis ... 47
List of annexes
Annex 1 Detection limits for trace elements in sediments as well as a comparison of certified and measured values in the reference materials Mess 3 and CRM 7100 C513 ... 39 Annex 2 Detection limits for trace elements in invertebrates as well as a comparaison of
certified and measured values in the reference materials TORT-2 and Bovine Liver 1577 ... 40 Annex 3 Trace element concentrations (mg/kg) in sediments and invertebrates collected
1
1. Summary
The objective of our study was to evaluate the availability to animals of trace elements in the sediments upstream and downstream from past and present mining activities near Lake Aux Dorés, Lake Chibougamau and the Nemenjiche River. To achieve this goal we measured trace elements in sediments (Ag, As, Ba, Be, Cd, Cr, Cu, Hg, Mn, Mo, Ni, Pb, Sb, Se, Sn, Tl, Zn) and sediment-dwelling invertebrates (As, Be, Cd, Cr, Cu, Hg, Mn, Ni, Se, Zn).
Lakes Chibougamau and Aux Dorés
Concentrations of most sedimentary trace elements at a site in Lake Chibougamau were similar to those at a site upstream from mining activities in Lake Aux Dorés (with the exception of Pb and Sn). In contrast, in the sediments of at least one of the two downstream sites in Lake Aux Dorés, trace element concentrations were higher than at the reference site (with the exception of Cr). The SEM-AVS model predicted that certain sedimentary trace metals (Cd, Cu, Ni, Pb, Zn) should be more available for uptake by animals at the downstream sites than at the reference site. However, this prediction was not fulfilled since the concentrations of most trace elements were not higher in invertebrates collected at the downstream sites in Lakes Aux Dorés and Chibougamau.
Nemenjiche River
The concentrations of many trace elements were higher in sediments collected downstream from mining activities than those collected upstream of these activities. However, the SEM-AVS approach predicted that some trace metals (Ag, Cd, Cu, Ni, Pb, Zn) should not be available to animals living in sediments at either site. Measurements in sediment-dwelling animals suggest that bioavailable concentrations of arsenic, copper, nickel and selenium were higher downstream from mining operations.
Conclusion
Overall, our results suggest that high trace element concentrations in sediments downstream from mining activities do not necessarily mean that these contaminants are in a form that can be taken up by animals living in these sediments. Even when we took into account the concentrations of sediment phases such as AVS and organic carbon that are known to sequester in part some of the trace metals that we studied (Ag, Cd, Cu, Ni, Pb, Zn), relationships between sediment and invertebrate trace metal concentrations were not usually stronger. We suggest that measurements of trace elements in sediment-dwelling invertebrates provide a more direct means of assessing the bioavailability of these contaminants. Overall, measurements in sediment-dwelling invertebrates indicate that the concentrations of many elements (As, Ba, Cd, Cr, Cu, Mn, Ni, Se and Zn) are higher at some downstream sites compared to upstream sites. On the one hand, downstream values for some of these elements (Ba, Cd, Ni and Zn) fall within the range of those reported for little-contaminated sites in other regions of Quebec and Ontario, which suggests that these elements are not problematic at our study sites. On the other hand, Cu and Se in some invertebrate samples were higher than published reference values suggesting that further study of these elements is warranted. Lastly, we assessed the probability that trace elements could be having toxic effects on one invertebrate species by comparing published toxicity-threshold concentrations for As, Cd, Cr, Mn and Ni in
Hyalella azteca to the concentrations that we measured in this species; none of our measured
concentrations exceeded the toxicity thresholds for these elements, which suggests that they are not toxic to this crustacean.
2
2. Introduction
According to a report from the “Ministère du Développement Durable, de l’Environnement et des Parcs” (MDDEP 2008), mining activities near the Principale and Copper Rand mines have increased the concentrations of trace elements (especially arsenic, copper, nickel and zinc) in the sediments of Lakes Aux Dorés and Chibougamau. Likewise, activities related to the Joe Mann mine have contaminated sediments in the nearby Nemenjiche river with, among others, arsenic, copper and mercury. From an environmental point of view, the question is: are these trace elements taken up by animals living in these contaminated sediments?
2.1. Evaluating the availability of sedimentary metals to sediment-dwelling animals using the [SEM]-[AVS] model
Measuring trace metals in sediments is relatively simple. The problem comes when we attempt to relate such measurements to environmental effects such as metal accumulation in animals or toxic effects. One of the reasons for this is that metals in sediments can be bound to components (such as organic matter, iron oxides, and iron sulfides) that make them unavailable for uptake by animals (Luoma 1989).
The US Environmental Protection Agency has suggested that since the availability of many metals in the oxygen-free (anoxic) water between sediment particles (interstitial waters or pore water) is mainly controlled by sulfides, measuring sulfides and the metals (Ag, Cd, Cu, Ni, Pb, Zn) associated with them can allow sediments to be classified according to the likelihood that will be toxic to animals (Swartz et al. 1985; Ankley et al. 1996; Di Toro et al. 2005). Sulfides are produced in sediments when bacteria reduce sulfate in interstitial water to obtain energy. In sediments not contaminated with trace metals, much of this sulfide is bound to iron. However, when trace metals are added, they tend to take the place of the iron because they are less soluble in water than are the iron sulfides. Because metal sulfides are extracted from sediments by digesting them in acid (cold 1N hydrochloric acid), they are referred to as “Acid Volatile Sulfides (AVS)” and the metals released with them are called “Simultaneously Extracted Metals (SEM)”. From an environmental point of view, the idea is that if the sum of the concentrations of these metals, [SEM], does not exceed that of AVS, [AVS], then toxic effects are unlikely, whereas if the opposite is true then toxic effects might occur (depending on the sensitivity of the animals and the metal involved); that is,
if [SEM] – [AVS] > 0 = sediments are potentially toxic (1) if [SEM] – [AVS] < 0 = sediments are non-toxic (2)
It stands to reason then that the greater the value of [SEM]-[AVS], the greater the likelihood of toxic effects (Hare et al. 1994).
3 If we consider that metals act in a competitive manner when binding to AVS, it becomes possible to estimate which metals are most likely to form insoluble sulfides and which ones are more likely to remain potentially available to organisms in interstitial anoxic waters. In theory, metals that have the lowest solubility product with sulfur (KAg2S < KCuS < K PbS < KCdS < KZnS < KNiS)
are the ones that form the most stable compounds. With this in mind, when [SEM] exceeds [AVS], the binding order of metals to [AVS] will be [SEMAg] followed by the [SEMCu], [SEMPb],
[SEMCd], [SEMZn] and [SEMNi] until all of the AVS is exhausted. For example, suppose 2 moles of
AVS is present with 1 mole of SEMAg, 4 moles of SEMCu, 0.1 mole of SEMPb, 0.1 mole of SEMCd, 2
moles of SEMZn and 1 mole of SEMNi. The least soluble metal sulfide (of the six metals considered
above) is silver sulfide (Ag2S). Since [SEMAg] < [AVS], all the SEMAg should be bound to AVS with 1
mole of AVS remaining ([AVS] – [SEMAg] = 2 moles – 1 mole = 1 mole). The second least soluble
sulfide metal is copper sulfide (CuS). However, since [SEMAg] + [SEMCu] > [AVS], all the AVS is
exhausted by Cu. In theory, this indicates that a portion of SEMCu as well as most of the other
simultaneously extracted metals (Pb, Cd, Zn and Ni) should be in excess and thus largely dissolved in anoxic interstitial waters.
Since organic matter can also bind metals, the [SEM]-[AVS] model has recently been amended to include the fraction of organic carbon in sediment (foc); the revised form of the model being
([SEM]-[AVS])/foc (Di Toro et al. 2005).
In spite of the fact that the [SEM]-[AVS] approach has been successful in predicting metal toxicity in the laboratory, and thus has gained credence for use in ecological risk assessments (especially in the USA), its use remains controversial (Campbell et al. 2006). This is due in part to the fact that it tends to be poor at predicting metal accumulation by sediment-dwelling animals (Hare et al. 2001). For example, Jonge et al. (2009) have shown that sediment-dwelling animals accumulate trace metals even where AVS concentrations exceed those of SEM.
2.2. Evaluating metal availability by measuring metal concentrations in animals
Because of the limitations of many indirect approaches for predicting metal bioavailability, some scientists and environmental agencies have opted for a more direct approach; that of measuring metals in animals exposed to contaminated media (Phillips and Rainbow 1993). This approach has been used successfully to predict cadmium (Hare et al. 2008) and nickel (Ponton and Hare 2009) bioavailability in lakewater based on measurements of these metals in larvae of the phantom midge Chaoborus.
2.3. Objective
The objective of our study was to estimate the availability of trace elements to animals living in sediments at sites above (upstream) and below (downstream) mining and processing activities in Lakes Aux Dorés and Chibougamau as well as the Nemenjiche River. We first characterised the sites under study by measuring sediment concentrations of the trace elements silver (Ag), arsenic (As), barium (Ba), beryllium (Be), cadmium (Cd), chrome (Cr), copper (Cu), manganese (Mn), molybdenum (Mo), nickel (Ni), lead (Pb), antimony (Sb), selenium (Se), tin (Sn), thallium
4 (Tl) and zinc (Zn). To achieve this goal we digested sediments with moderately strong reagents (nitric acid and hydrogen peroxide) to release trace elements that should be available in part for uptake by sediment-dwelling animals. Secondly, we used the SEM-AVS approach (described above) to estimate the likelihood that sedimentary Cd, Cu, Ni, Pb and Zn would be available for uptake by animals that are in contact with sediment pore-waters. Lastly, we measured trace elements (As, Ba, Cd, Cr, Cu, Hg, Mn, Ni, Se, Zn) in several types of invertebrates living in, and in some cases feeding on, sediments. The first two approaches are indirect ways of estimating the concentrations of trace elements available for uptake by sediment-dwelling animals, whereas the third approach measures these contaminants directly in the animals.
5
3. Choice of sites and sediment-dwelling animals
3.1. Choice of sites
The locations of our study sites in Lakes Chibougamau and Aux Dorés are shown in Figure 1A, whereas those in the Nemenjiche River are shown in Figure 1B. Following discussions with the MDDEP, our study sites were chosen on the basis of the following criteria:
- direction of water flow and the proximity of mining residues;
- trace element concentrations in sediments (total digestions; MDDEP 2008);
- sampling sites previously chosen for environmental effects monitoring (Alliance Environnement 2006a, b);
- presence of large numbers of sediment-dwelling animals of adequate size.
Note that we collected sediment samples at several sites in Lake Aux Dorés (for example, near Merrill Island, Campbell Point and the decantation basin close to Principale Mine), where trace element concentrations (As, Cd, Cu, Ni and Zn) are reported to be very high (MDDEP 2008). However, visual inspection of the sediments at these sites showed that they were unusual in that they were hard and contained a great deal of clay or sand or both (likely due to mining activities). Animals were very rare in these substrates, likely because most benthic animals require soft muddy sediments containing at least a few percent of organic matter in which they can burrow and which they can consume as food (either directly, or indirectly in the case of predators).
Because Proulx Bay (Figure 1A) is located upstream from mining and processing activities, we used it as a reference site for Lakes Chibougamau and Aux Dorés. The impacted sites in Lake Aux Dorés are located downstream from the Copper Rand and Principale Mines, whereas the site at Lake Chibougamau is situated downstream from mining wastes in Eaton Bay. It is likely that at these downstream sites both the sediments and the animals associated with them are contaminated with metals from mining activities upstream (Figure 1A). Sites in the Nemenjiche River are situated above and below the Joe Mann mine (Figure 1B). Characteristics of all sampling sites are given in Table 1.
6
Table 1
Location and characteristics of sampling sites in our study.
Sites Coordinates pH Type of substrate Depth
(m)
UTM Cartesian
Lake Aux Dorés
Upstream 554125 x
5531064 y
49o55.769’N
074o14.752’O 7.2 Mud and organic debris 2 Downstream-1 549502 x 5524296 y 49o52.142’N 074o18.669’O 7.5 “ 4.5 Downstream-2 547534 x 5522552 y 49o51.210’N 074o20.324’O 7.5 “ 1.5 Lake Chibougamau Upstream 554307 x 5527483 y 49o53.836’N 074o14.631’O 7.5 “ 3-5 Nemenjiche River Upstream 539541 x 5482003 y 49o29.363’N 074o27.242’O 7.1
Sand, mud & aquatic
plants <1
Downstream 540086
5483377
49o30.102’N
074o26.781’O 7.1 “ <1
3.2. Choice of invertebrates (see Table 2)
Our objective was to find, at each sampling site, at least 3 types of invertebrates that met the following criteria:
- presence at upstream reference site and at least one contaminated site; - invertebrates identifiable to genus and preferably to species;
- invertebrates that are relatively sedentary so that their trace element concentrations will be correlated with those in their surroundings;
- invertebrates that are large enough to allow measurements of trace elements;
- a variety of invertebrates (in terms of their feeding and burrowing behaviours) that represent the range of contaminant exposures possible;
- a variety of invertebrates representing the range of trace element concentrations to which fish might be exposed in their diet.
7
8
9
10
Table 2 Identity, form, habitat and behaviour of invertebrates chosen for study. Identity
Form†
Benthic habitat¥ Benthic behaviour¥§ Particles eaten¥
Class Order Family
*
«common name»
Genus*(species)
«common name»
Insect Ephemeroptera Ephemeridae
«common burrowers» Ephemera (simulans) «brown drake», «chocolate dun» Lake or river (sand & gravel
substrate) Endobenthic: burrower (builds tubes) Sediment Hexagenia (limbata) «burrowing mayfly», «giant Michigan mayfly», «great
olive-winged drake», «Michigan spinner» Lake or river (muddy substrate) Endobenthic: burrower (builds tubes) Sediment Litobrancha (recurvata) «brown drake», «dark green drake»,
«drakefly», «great dark green drake»
River Endobenthic: burrower (builds tubes)
Sediment
Caenidae «small square-gills»
Caenis Lake or river EPIBENTHIC:
crawls and climbs
Detritus / Algae
* Common names in east and central North America according to McCafferty (1981). † Photos by Isabelle Proulx of invertebrates collected at the study sites.
¥ Charbonneau & Hare (1998), McCafferty (1981), Merritt et al. (2008), Wang et al. (2004). § Epibenthic: lives on a substrate / Endobenthic: lives within a substrate.
11 (Table 2 continued)
Identity
Form† Benthic habitat¥ Benthic behaviour¥§ Particles eaten¥
Class Order Family
* «common name» Genus*(species) «common name» Megaloptera Sialidae «alderfly»
Sialis Lake or river Endobenthic: burrower (builds tubes)
Invertebrates
Trichoptera Polycentropidae «trumpnet»,
«tube-making caddisfly»
Phylocentropus Lake or river Endobenthic: burrower (builds tubes)
Algae
Crustacea Amphipoda Hyalellidae
«scud»
Hyalella (azteca) «tiny olive scud»,
«tiny yellow», «tiny gray», «Aztecan scud»
Lake or river Epibenthic Detritus / Algae
* Common names in east and central North America according to McCafferty (1981). † Photos by Isabelle Proulx of invertebrates collected at the study sites.
¥ Charbonneau & Hare (1998), McCafferty (1981), Merritt et al. (2008), Wang et al. (2004). § Epibenthic: lives on a substrate / Endobenthic: lives within a substrate.
12
4. Methods
4.1. Collection and preparation of sediment and invertebrate samples
All samples were collected between the 23rd and the 28th of September 2008. 4.1.1. Sediments
Prior to collecting invertebrates, 3 sediment samples were collected using an Ekman grab sampler (9" x 9" surface area) at each site. The grab was hoisted carefully in the boat so as not to disturb the sediments within. Water lying above the sediments was allowed to drain passively and a 2.5 cm diameter plastic syringe (open at both ends) was inserted into the sediments to a depth of 5 cm. In this manner, 2 sediment cores were collected in each grab sample: one for measurement of trace elements (using a partial digestion method) and the other for measurement of AVS and SEM. These samples were placed into Whirl-Pak bags that were closed carefully to eliminate as much air as possible. They were then inserted into a large sack containing anoxic sediment collected locally and held at 4 oC until analysis.
4.1.2. Invertebrates
Sediments were collected using an Ekman grab sampler (9" x 9" surface area) at each site and sieved using a net (mesh size 0.5 mm) to eliminate fine sediment and retain invertebrates. Invertebrates were sorted and identified under a microscope using the works of McCafferty (1975 for mayflies; 1981 for other invertebrate groups) and Merritt et al. (2008) then held for 1-3 days in containers filled with water from their collection site to allow them to empty their gut contents. Exceptionally, the mayfly Hexagenia limbata did not empty its gut completely and so we removed sediment by dissection (Hare et al. 1989; except for those used for measurement of Hg). Invertebrates were then placed on a piece of Teflon sheeting in 1.5 mL plastic microcentrifuge tubes (previously cleaned in 15% HNO3 and rinsed in ultra-pure water) and
frozen at -20 oC. Our objective was to obtain 5 pooled samples of each invertebrate type at each sampling. The number of individuals in a pooled sample varied from 1 to 15 depending on the number of individuals available at a given site and the size of the animal.
4.2. Chemical analyses
Laboratory material used for trace element analyses (with the exception of Hg) was held in a solution of 15% HNO3 (vol/vol) for at least 1 day, rinsed 7 times in ultra-pure water and then
dried under a laminar-flow hood. In the case of Hg, sample containers (nacelles) were first cleaned with a brush then held for at least 1 hour in an oven at 700 °C.
4.2.1. Trace elements in sediments
13 4.2.1.1. As, Ag, Ba, Be, Cd, Cr, Cu, Mn, Mo, Ni, Pb, Sb, Se, Sn, Tl and Zn
From each sample, we used a plastic spatula to remove 13-15 mg of dry sediment that was placed on a piece of Teflon sheeting. This sub-sample was weighed then transferred (with the Teflon piece) to a 15 mL Corning polypropylene tube. For each mg of sediment present, we added 100 µL of HNO3 (Fisher Scientific, trace metal grade) then, after 5 days in this solution, we
added 40 µL of H2O2 (Fluka Analytical, trace select ultra for trace analysis) and, after a further 3
days, we added sufficient ultra-pure water to obtain a final volume of 1 mL. A similar mass of certified reference material was digested in the same way to verify the efficacy of the digestion method (see Annex 1). Following digestion, the sub-samples were centrifuged (without the Teflon piece) at 7,000 rpm for 3-5 minutes. The supernatant was transferred to another graduated polypropylene tube for later analysis.
Concentrations of As, Ag, Ba, Be, Cd, Cr, Mo, Ni, Pb, Sb, Se, Sn and Tl were measured by inductively coupled plasma mass spectrometry (ICP-MS: Thermo Electron Corp., model X7) using calibration standards and rhodium as an internal standard. Measurements of As, Cd and Se were made by collision cell. Concentrations of Cu, Mn and Zn were measured by inductively coupled plasma atomic absorption spectroscopy (ICP-AES; Varian Vista AX) using calibration standards and yttrium as an internal standard. Data were corrected for signal drift. Every 10-15 samples, we measured values in analysis blank (values were below the detection limit; Annex 1) and in a certified standard (900Q30, Environment Canada inter-laboratory study) as a means of quality control. Since digestion blanks were contaminated with Ag, values for this metal were corrected using Ag concentrations in blanks.
4.2.1.2. Hg
From 50 to 130 mg of dried sediment was used for Hg measurement by thermal decomposition and analysis by UV photometry (DMA-80 Direct Mercury Analyser). For external calibration we used samples of several certified reference materials, that is, MESS-3 (marine sediment reference material, National Research Council of Canada (NRCC), Ottawa), Apple (National Institute of Standards & Technology (NIST), Gaithersburg, MD, USA) and Montana Soil (NIST). Every 10 samples, we measured values in analysis blanks (values were below the detection limit; Annex 1) and in a certified standard (MESS-3, NRCC, Annex 1) as a means of quality control. 4.2.2. Acid volatile sulfides (AVS), simultaneously extracted metals (SEM) and fraction of organic
carbon (foc) in sediments
4.2.2.1. Acid Volatile Sulfides (AVS)
To convert sulfides to gaseous H2S, we digested 0.5 g of wet sediment in 10 mL of 6 N HCl in a
N-purged reaction cell containing 50 mL of demineralised water and 200 µL of 1 N NaOH. The H2S was trapped in two tubes filled with 50 mL of 0.25 N degassed NaOH. After 45 minutes, the
solution of H2S and NaOH was coloured with methylene blue and the S concentration was
measured by atomic absorption spectrophotometry at 670 nm. The spectrophotometer was calibrated using sulfide standards.
14 4.2.2.2. Simultaneously Extracted Metals (SEM)
Following H2S release, the acidified mixture was filtered (0.45 µm) and metals in this solution
(SEM) were measured by ICP-AES (Varian Vista AX) using external standards and yttrium as an internal standard. Filtration blanks were close to or below the limit of detection. Control samples were also used to verify measurement reliability (900-Q30: Inter-laboratory study by Environment Canada).
4.2.2.3. Fraction of organic carbon (foc)
Approximately 0.5 g of dried sediment was digested in 50 mL of 0.1 N H2SO4 and the mixture
was shaken for 15 minutes to allow loss of carbonates. The solution was filtered through a preweighed 42.5 mm glass-fibre filter (GF/C 1.2 m) and the filter along with the sediment retained was dried at 55 °C. The dried sediment was removed by scraping and organic carbon was measured in a CHN analyser (Peco, model CHNS-932) (method 86.09/305 – N 2.1 of the ministère de l’Environnement du Québec). Instrumental blanks were under the detection limit and the values of standards (OAS, sediment standard – high organic content, Isomass Scientific Inc.; PACS-2, marine sediment, NRCC) were within the certified limits.
4.2.3. Trace elements in invertebrates
Invertebrates were dried and weighed on a microbalance. 4.2.3.1. As, Ba, Cd, Cr, Cu, Mn, Ni, Se and Zn
Samples were digested in the same manner as for the sediments (described in section 4.2.1). Digestion of similar-sized samples of certified reference materials showed that the digestion method was efficient for all trace elements except Cr of which 40% was liberated during digestion (Annex 2). Although Cr concentrations in invertebrates are underestimates, they should be adequate for comparisons among sampling sites. Since there is no certified standard available for Ba, we could not verify the efficacy of the digestion method for this element. Samples were analysed by ICP-MS (Thermo Electron Corp., model X7) using external calibration standards and rhodium as an internal standard. Data were corrected for signal drift. Trace element concentrations in digestion and analysis blanks were below the detection limit (Annex 2). Every 15-20 samples, we measured an analysis blank, a calibration standard (standard 4) and a control sample (PT 89-9: Inter-laboratory study, Environment Canada).
4.2.3.2. Hg
Mercury was measured by thermal decomposition without prior digestion (DMA-80 Direct Mercury Analyser). External calibration was achieved using the following certified reference materials: MESS-3 (CNRC), Apple (NIST) and Montana Soil (NIST). Every 10 samples, we measured Hg in an analysis blank and in a certified reference material (TORT-2 and Bovine liver; Annex 2). Blanks were below the detection limit (Annex 2). At some sampling sites we did not collect sufficient numbers of invertebrates to measure their Hg content.
15
4.3. Data analyses
Statistical tests were conducted using Sigma Stat 3.5. When comparing two means we used either the t-test, when data satisfied the criteria for a parametric test, or the non-parametric Mann-Whitney Rank Sum test when this was not the case. Likewise, when comparing more than two means, we used an ANOVA, when data satisfied the criteria for a parametric test, or the Kruskal Wallis non-parametric test, followed by Dunn’s test, if this was not the case. We noted that for all of these tests the sample number should ideally exceed 15, whereas our sample sizes were less than 8. When we had only a single sample for a given type of invertebrate at a given site, it was not included in the statistical tests.
16
5. Results
5.1. Concentrations of trace elements in sediments
Sedimentary concentrations of Ag, As, Ba, Be, Cd, Cr, Cu, Hg, Mn, Mo, Ni, Pb, Sb, Se, Sn, Tl and Zn are given in Table 3 (in nmol/g) and Table 12 (in mg/kg) for Lakes Chibougamau and Aux Dorés or in Table 4 (in nmol/g) and Table 13 (in mg/kg) for the Nemenjiche River. A summary of these data is presented in Table 8. Variability among sediment samples at a given site was minimal, judging from the small coefficients of variation (standard deviation/mean Χ 100 = <15%) for these data.
5.1.2. Comparison of sedimentary trace element concentrations at upstream and downstream sites
Lake Chibougamau (Table 3 (in nmol/g), Table 12 (in mg/kg) and Table 8 (summary))
At the downstream site in Lake Chibougamau, only Pb and Sn were present in sediments at higher concentrations than at the reference site (upstream site in Lake Aux Dorés).
Lake Aux Dorés (Table 3 (in nmol/g), Table 12 (in mg/kg) and Table 8 (summary))
At the two downstream sites in Lake Aux Dorés, the concentrations of Ag, As, Ba, Cd, Cu, Mn, Pb, Sn and Zn were significantly higher than at the upstream site. Concentrations of Be, Hg, Sb, Se and Tl were higher than those at the reference site only at downstream site 1, whereas those of Mo and Ni were higher only at downstream site 2. Chromium was the only trace element that was not present in higher concentrations in sediments at the downstream sites. The highest trace element concentrations measured in lake sediments were at the two downstream sites in Lake Aux Dorés, and the ratios of downstream to upstream trace element concentrations at these sites were highest for Ag, As, Cu and Mo.
Nemenjiche River (Table 4 (in nmol/g), Table 13 (in mg/kg) and Table 8 (summary))
There was no significant difference between the upstream and downstream concentrations of sedimentary Ba, Cd, Mn, Pb and Sb, whereas those of Ag, As, Be, Cr, Cu, Hg, Mo, Ni, Sn, Se, Tl and Zn were higher at the downstream station than upstream. Ratios of concentrations between the downstream and upstream stations were highest for Ag, As, Cu, Mo and Se.
17
Table 3 Mean concentrations (nmol/g; n = 3 ± standard deviation) of sedimentary trace elements ([M]) upstream and downstream of mining activities in Lakes Chibougamau and Aux Dorés. Values followed by the same letter are not significantly different (P > 0.05). Lake Sites Ag ¥ (nmol/g) As (nmol/g) Ba (nmol/g) Be (nmol/g) Cd (nmol/g) Cr¥ (nmol/g) Cu (nmol/g) Hg (nmol/g) upstream 0.0 ± 0.0a 104 ± 31a 195 ± 5b 13.7 ± 1.0b 6.6 ± 0.3a 896 ± 6c 1,510 ± 80a 0.48 ± 0.01c Chibougamau (C) downstream 0.0 ± 0.0a 117 ± 10a 138 ± 19a 13.1 ± 1.9b 4.6 ± 1.1a 448 ± 33ab 1,550 ± 330a 0.32 ± 0.02a
Aux Dorés (AD) downstream-1 5.2 ± 0.4
b
255 ± 6b 300 ± 13d 17.8 ± 0.6c 10.7 ± 1.1b 485 ± 11b 9,080 ± 440b 0.79 ± 0.01d downstream-2 11.4 ± 0.4c 618 ± 39c 261 ± 14c 9.3 ± 0.3a 10.6 ± 0.8b 414 ± 4a 12,120 ± 220c 0.41 ± 0.01b [M] significantly higher at downstream
sites? Yes: downstream 1 and 2 (AD) Yes: downstream 1 and 2 (AD) Yes: downstream 1 and 2 (AD) Yes: downstream 1 (AD) Yes: downstream 1 and 2 (AD) No Yes: downstream 1 and 2 (AD) Yes: downstream 1 (AD) Ratio of highest downstream [M] to
upstream [M] - 6 2 1 2 - 8 2 Lake Sites Mn (nmol/g) Mo (nmol/g) Ni¥ (nmol/g) Pb¥ (nmol/g) Sb¥ (nmol/g) Se (nmol/g) Sn (nmol/g) Tl (nmol/g) Zn (nmol/g) upstream 2,800 ± 300a 6.2 ± 0.3ab* 490 ± 10b* 70 ± 2a <0.8 ± 0.0a 20.3 ± 1b 2.4 ± 0.2a 0.16 ± 0.02a 1,200 ± 310a Chibougamau (C) downstream 3,600 ± 600a 4.8 ± 0.6a 350 ± 30a 124 ± 22b <0.8 ± 0.0a 11.3 ± 1.6a 3.1 ± 0.2b 0.17 ± 0.03a 960 ± 110a
Aux Dorés (AD) downstream-1 7,000 ± 1,100
b
12.0 ± 1.3b 630 ± 30b 215 ± 19d 1.7 ± 0.1b 29.0 ± 2.0c 5.0 ± 0.2c 0.28 ± 0.01b 1,870 ± 40b downstream-2 7,500 ± 1,200b 65.4 ± 3.9c 2,040 ± 70c 152 ± 2c <0.8 ± 0.03a 22.8 ± 1.4b 3.2 ± 0.1b 0.17 ± 0.01a 3,490 ± 220c [M] significantly higher at downstream
sites? Yes: downstream 1 and 2 (AD) Yes: downstream 2 (AD) Yes: downstream 2 (AD) Yes Yes: downstream 1 (AD) Yes: downstream 1 (AD) Yes Yes: downstream 1 (AD) Yes: downstream 1 (AD) and downstream (C) Ratio of highest downstream [M] to
upstream [M] 3 11 4 3 - 1 2 2 3
¥ In spite of the fact that these data did not meet the criteria for using a parametric test, we compared them using a Tukey test because the non-parametric Dunn’s test lacked sufficient power.
18
Table 4 Mean concentrations (nmol/g; n = 3 ± standard deviation) of sedimentary trace elements ([M]) upstream and downstream of mining activities in the Nemenjiche River. Values followed by the same letter are not significantly different (P > 0.05).
Sites Ag¥ (nmol/g) As¥ (nmol/g) Ba (nmol/g) Be (nmol/g) Cd (nmol/g) Cr (nmol/g) Cu¥ (nmol/g) Hg (nmol/g) upstream 0.0 ± 0.0a 70 ± 20a 270 ± 80a 5.7 ± 0.1a* 2.5 ± 0.1a 157 ± 4a 155 ± 6a 0.10 ± 0.01a downstream 2.9 ± 0.4b 1,150 ± 610b 260 ± 10a 6.6 ± 0.3b 3.7 ± 0.6a 314 ± 5b 7,195 ± 873b 0.44 ± 0.02b [M] significantly higher at downstream site?
Yes Yes No Yes No Yes Yes Yes
Ratio of downstream [M] to upstream [M] - 16 - 1.2 - 2 46 4 Sites Mn (nmol/g) Mo (nmol/g) Ni (nmol/g) Pb (nmol/g) Sb (nmol/g) Se (nmol/g) Sn (nmol/g) Tl (nmol/g) Zn (nmol/g) upstream 17,600 ± 7,100a 2.2 ± 0.9a 127 ± 8a 22.5 ± 2.2a <0.8 ± 0.0a 4.5 ± 0.1a 1.0 ± 0.1a 0.22 ± 0.02a 490 ± 50a downstream 15,100 ± 2,900a 14.6 ± 1.2b 534 ± 30b 19.6 ± 0.6a <0.8 ± 0.0a 65.5 ± 11.0b 4.4 ± 0.9b 0.34 ± 0.03b 1,300 ± 200b [M] significantly higher at downstream site?
no yes yes no no yes yes yes yes
Ratio of downstream [M] to upstream [M]
- 7 4 - - 15 4 2 3
¥ Means were compared using the Tukey test (despite the fact that these data did not satisfy the criteria for a parametric test) because the non-parametric Dunn’s test was not sufficiently powerful.
19
5.2. Concentrations of Acid Volatile Sulfide (AVS) and Simultaneously Extracted Metals (SEM) in sediment
Concentrations of AVS and SEM are presented in Table 5 for all study sites.
In Lake Chibougamau, values of [SEM] ([SEM]Ag + [SEM]Cu + [SEM]Pb + [SEM]Cd + [SEM]Zn +
[SEM]Ni) were similar to those at the upstream reference site. In both Lake Aux Dorés and the
Nemenjiche River, SEM values were higher at the downstream sites than at the upstream sites. These results are similar to those obtained for sediments digested using HNO3 and H2O2 (see
section 5.1.). At all sites, metals that contribute most to the SEM values are Cu and Zn.
AVS concentrations were in general higher at the downstream site in the Nemenjiche River than at the other study sites. Comparisons among the other sites are limited by the variability in AVS values at individual sites, which suggests substantial intra-site spatial variations in AVS values as reported by previous investigators (Ankley et al. 1994; Morse and Rickard 2004). Likewise Warren et al. (1998) showed that [AVS] can vary from 0 to 5 µmol/g in going from the sediment-water interface to a depth of 5 cm in the sediments.
5.2.2. Bioavailability of sedimentary metals according to the SEM-AVS and the SEM-AVS/foc approaches
At all upstream and downstream sites in Lakes Chibougamau and Aux Dorés, [SEM] exceeded [AVS] (Table 5). As mentioned in the introduction (p. 2-3), when [SEM] > [AVS], it is possible to evaluate which metals are potentially available to organisms in the anoxic porewater. To achieve this goal, [SEMAg] is subtracted from [AVS] followed by the [SEMCu], [SEMPb], [SEMCd], [SEMZn],
[SEMNi] until all of the AVS has been exhausted. At all lake sites, [SEMAg] were negligible
whereas, [SEMCu] exceeded [AVS]. This indicates that a portion of Cu as well as Pb, Cd, Zn and Ni
are not bound to AVS and thus are potentially present in anoxic interstitial water at all sites in Lakes Chibougamau and Aux Dorés. However, there are other metal-binding phases present in sediments such as organic carbon and thus the [SEM]-[AVS] values can be normalised by dividing them by the fraction of the sediment that is organic carbon. According to Di Toro et al. (2005), and supported by toxicity studies on Zn by Burton et al. (2005), sediments having ([SEM]-[AVS])/foc values below 150 µmol/g should not be toxic. It should be noted that these researchers did not suggest a threshold value for metal bioaccumulation. In our study, ([SEM]-[AVS])/foc values were below this threshold at all sites with the exception of the downstream-2 site in Lake Aux Dorés (450 µmol/g). Thus sediments at this site could in principle exert chronic toxicity to benthic animals, although Di Toro et al. (2005) suggest that much higher values are needed to produce acute toxicity (>3,400 µmol/g).
In the Nemenjiche River, [SEM]-[AVS] values (Table 5) were consistently negative, which suggests that sedimentary metals considered in SEM should not be bioavailable at this site.
20
Table 5 Concentrations of Simultaneously Extracted Metals (SEM), concentrations of Acid Volatile Sulfide (AVS), as well as [SEM]-[AVS] values in Lake Chibougamau, Lake Aux Dorés and Nemenjiche River. Also given is the percentage of organic carbon (% oc) in sediment and a correction for the influence of this additional metal-binding phase (([SEM]-[AVS])/foc). Values for [Ag] are not reported because they were below the detection limit.
Lake/ River Site S a m p l e
SEMCd SEMCu SEMNi SEMZn SEMPb
SEM (µmoles/g)
(∑*SEMAg], [SEMCu], [SEMPb],
[SEMCd], [SEMZn], [SEMNi])
AVS (µmoles/g) [SEM]-[AVS] (µmol/g) Sedimentary metals potentially bioavailable? % oc‡ (n=3) [SEM]-[AVS] foc¥ (µmol/g OC)
(µmoles/g) Sample Mean Sample Mean Sample Mean
Lake Aux
Dorés (reference for lakes) upstream
1 0.013 1.07 0.25 1.19 0.08 2.6 2.1 0.3 0.2 2.3 1.8 yes 9.1 20 2 0.007 0.79 0.18 0.65 0.06 1.7 0.3 1.4 3 0.006 0.94 0.22 0.68 0.07 1.9 0.2 1.7 Lake Chibouga-mau downstream 1 0.004 0.95 0.11 0.75 0.14 2.0 2.3 0.1 0.1 1.9 2.2 yes 3.9 55 2 0.005 1.23 0.17 1.39 0.16 3.0 0.2 2.8 3 0.004 1.05 0.18 0.67 0.12 2.0 0.1 1.9 Lake Aux Dorés downstream-1 1 0.010 5.61 0.34 1.73 0.19 7.9 8.6 0.1 0.2 7.8 8.4 yes 14.3 59 2 0.011 6.30 0.37 2.66 0.23 9.6 0.4 9.2 3 0.011 6.46 0.39 1.34 0.23 8.4 0.1 8.3 downstream-2 1 0.008 4.98 0.69 2.29 0.12 8.1 8.8 2.1 1.6 6.0 7.2 yes 1.6 444 2 0.009 5.98 0.65 2.48 0.13 9.3 0.1 9.1 3 0.009 5.36 0.80 2.78 0.13 9.1 2.5 6.6 Nemenjiche
River (reference for river) upstream 1 0.003 0.06 0.04 0.28 0.02 0.4
0.4 0.3 0.4 0.1 0.0 no 7.1 n/a 2 0.002 0.06 0.03 0.29 0.02 0.4 0.8 -0.4 3 0.007 0.07 0.04 0.32 0.02 0.5 0.1 0.4 downstream 1 0.004 0.39 0.14 0.63 0.02 1.2 1.3 4.0 4.9 -2.8 -3.6 no 0.8 n/a 2 0.004 0.40 0.16 0.79 0.02 1.4 1.9 -0.5 3 0.006 0.55 0.16 0.62 0.02 1.3 8.9 -7.5
‡ All standard errors were <0.01.
21
5.3. Invertebrate trace element concentrations
Trace element concentrations in invertebrates collected from Lakes Chibougamau and Aux Dorés as well as the Nemenjiche River are given in Tables 6 and 7 (in nmol/g) and in Tables 14 and 15 (in mg/kg) respectively. A summary of trace element concentrations in invertebrates from all sites is presented in Table 8. Coefficients of variation among sample types at a given site (standard deviation/mean Χ 100) were generally less than 30%, although in a few cases coefficients of variation were higher (30-70%). Overall, our results (coefficient of variation <30%) are similar to those reported for similar types of samples from other regions (e.g., Hare and Campbell 1992).
5.3.1. Comparison of trace elements concentrations measured in invertebrates collected at upstream and downstream sites
Lake Chibougamau (Table 6 (in nmol/g), Table 14 (in mg/kg) and Table 8 (summary))
For most invertebrates, there was no difference in their trace element concentrations (As, Ba, Cd, Cr, Cu, Hg, Mn, Ni, Se and Zn) between the upstream reference site in Lake Aux Dorés and the downstream site in Lake Chibougamau. Exceptions were Hexagenia limbata (large size) for Cd, Hyalella azteca (large size) for As, Ba, Cr, Cu, Se and Zn, as well as Sialis for As, Cd and Cu. Lake Aux Dorés (Table 6 (in nmol/g), Table 14 (in mg/kg) and Table 8 (summary))
For most invertebrates, there was no difference in their trace element concentrations (As, Ba, Cd, Cr, Cu, Hg, Mn, Ni, Se and Zn) between the upstream reference site and the two downstream sites in Lake Aux Dorés. Exceptions where downstream-1 values were higher than those upstream are for Hyalella azteca (large size) for As, Ba, Cu, Mn and Se (however, n=1 for this animal), Hexagenia limbata (large size) for Cd and Se, as well as Sialis for Cd. Similarly, exceptions for downstream-2 included Hexagenia limbata (large size) for Cd and Cu, Hyalella
azteca (large size) for Mn, Phylocentropus for As, as well as Sialis for As and Ni. Nemenjiche River (Table 7 (in nmol/g), Table 15 (in mg/kg) and Table 8 (summary))
Concentrations of Ba, Cd, Cr, Mn and Hg in invertebrates were not significantly higher at the downstream than at the upstream site. Zinc concentrations downstream were not higher than those upstream except for Hyalella azteca. In contrast As, Cu, Ni and Se concentrations were higher at the downstream site in most types of invertebrates (with the exception of Hexagenia
22
Table 6 Mean (± standard deviation) concentrations (nmol/g) of trace elements measured in invertebrates collected from Lakes
Chibougamau and Aux Dorés at sites upstream and downstream from mining activities. For a given element and invertebrate,
values that do not differ significantly (P > 0.05) are followed by the same letter. The symbol « - » indicates that too few invertebrates were collected for analysis.
Invertebrate Lake Site n As
(nmol/g) Ba (nmol/g) Cd (nmol/g) Cr‡ (nmol/g) Cu (nmol/g) Sialis upstream 5 9.7 ± 1.5a 15 ± 5ab 9 ± 2a 8.0 ± 2.4b 470 ± 20a Chibougamau downstream 5 19.0 ± 5.5c 6 ± 2a 24 ± 3b 4.6 ± 1.3ab 770 ± 170b Aux Dorés downstream-1 4 9.6 ± 4.1
ab* 12 ± 3ab 22 ± 12b 1.4 ± 0.4a* 570 ± 160ab downstream-2 6 15.0 ± 4.0bc* 27 ± 14b 18 ± 6ab 2.1 ± 0.6a* 690 ± 130ab Phylocentropus upstream 5 1.3 ± 0.5a* 3.5 ± 2a 0.2 ± 0.1a 4.3 ± 3.4b 450 ± 120ab Chibougamau downstream 5 2.5 ± 1.8a 4.8 ± 1.7a 0.3 ± 0.0a 2.2 ± 0.8ab 320 ± 90a Aux Dorés downstream-1 4 2.0 ± 0.9
a 4.3 ± 0.4a 0.3 ± 0.1a 0.3 ± 0.2a 510 ± 70b downstream-2 5 8.1 ± 2.1b 3.9 ± 1.4a 0.3 ± 0.1a 1.9 ± 0.7ab 560 ± 100b Caenis upstream 5 9.3 ± 2.0a 25.8 ± 8.2b 36.5 ± 11.9a 48.2 ± 9.3b 320 ± 60a Chibougamau downstream 0 - - - - -
Aux Dorés downstream-1 0 - - - - -
downstream-2 3 15.5 ± 6.7a 8.9 ± 3.0a 34.8 ± 11.8a 7.4 ± 4.6a 470 ± 240a ‡ Since the digestion method for Cr was not 100% efficient, data for this element should be viewed as qualitative.
23 (Table 6 continued)
Invertebrate Lake Site n As
(nmol/g) Ba (nmol/g) Cd (nmol/g) Cr‡ (nmol/g) Cu (nmol/g) Hyalella azteca (large size) upstream 5 23.8 ± 2.1a 160 ± 11a 15.3 ± 3.0ab 11.4 ± 2.0a 1,320 ± 190b Chibougamau downstream 4 68.6 ± 2.6b 570 ± 20b 21.0 ± 0.5b 23.0 ± 3.0b 4,310 ± 110c
Aux Dorés downstream-1 1† 35.6 350 11.6 11.9 2.810
downstream-2 8 25.4 ± 2.6a 130 ± 30a 9.8 ± 6.6a 14.2 ± 4.6ab 960 ± 270a Hyalella azteca (small size) upstream 6 26.8 ± 0.8a 31.2 ± 13.3b 20.4 ± 1.1a 47.0 ± 4.1b 1,270 ± 210a Chibougamau downstream 0 - - - - -
Aux Dorés downstream-1 0 - - - - -
downstream-2 5 28.8 ± 8.7a 15.7 ± 6.2a 25.7 ± 5.5a 23.3 ± 9.7a 940 ± 370a Hexagenia limbata (large size) upstream 5 19.6 ± 15.2a* 13.2 ± 3.7a 6.9 ± 5.3a*§ 27.8 ± 11.0a 250 ± 60a Chibougamau downstream 2 20.2 ± 1.1a 8.8 ± 1.3a 16.2 ± 6.5b§ 16.5 ± 8.0a 250 ± 30a Aux Dorés downstream-1 3 26.8 ± 6.0
a
10.5 ± 4.4a 50.8 ± 31.3b§ 16.5 ± 3.1a 450 ± 140ab downstream-2 4 21.3 ± 9.7a 12.8 ± 3.3a 20.2 ± 6.0b§ 17.0 ± 5.3a 740 ± 230b Concentrations significantly higher at downstream
sites? sometimes: Sialis, Phylocentropus, H. azteca no: except H. azteca sometimes: Sialis, H. limbata no sometimes: H. azteca, H. limbata
‡ Since the digestion method for Cr was not 100% efficient, data for this element should be viewed as qualitative. † Because n=1 these values could not be compared statistically with others.
* One obvious outlier was removed.
§ Means were compared using the Tukey test (despite the fact that these data did not satisfy the criteria for a parametric test) because the non-parametric Dunn’s test was not sufficiently powerful.
24 (Table 6 continued)
Invertebrate Lake Site n Mn
(nmol/g) Ni (nmol/g) Se (nmol/g) Zn (nmol/g) n Hg (nmol/g) Sialis upstream 5 650 ± 170ab 28 ± 5a 40 ± 8b 2,440 ± 250a 5 0.34 ± 0.09b Chibougamau downstream 5 340 ± 70a 19 ± 3a 40 ± 7b 2,420 ± 300a 0 -
Aux Dorés downstream-1 4 470 ± 220
a 17 ± 7a 22 ± 4a 2,220 ± 460a 3 0.23 ± 0.15ab downstream-2 6 790 ± 280b 50 ± 12b 42 ± 10b 2,110 ± 350a 4 0.10 ± 0.02a Phylocentropus upstream 5 140 ± 40a 30 ± 9a 10.9 ± 4.7a 1,250 ± 100a 5 0.71 ± 0.07b Chibougamau downstream 5 180 ± 20a 29 ± 13a 9.9 ± 3.0a 1,390 ± 110a 0 -
Aux Dorés downstream-1 4 140 ± 30
a 16 ± 7a 13.2 ± 2.5a 1,320 ± 220a 2 0.17 ± 0.04a downstream-2 5 150 ± 20a 23 ± 6a 13.4 ± 2.4a 1,110 ± 150a 3 0.17 ± 0.03a Caenis upstream 5 1,570 ± 1,140a 37.6 ± 10.2a 41.6 ± 7.8b 4,270 ± 1,250b 0 - Chibougamau downstream 0 - - - - 0 -
Aux Dorés downstream-1 0 - - - - 0 -
downstream-2 3 490 ± 170a 22.5 ± 8.6a 15.4 ± 1.8a* 1,480 ± 540a 0 -
25 (Table 6 continued)
Invertebrate Lake Site n Mn
(nmol/g) Ni (nmol/g) Se (nmol/g) Zn (nmol/g) n Hg (nmol/g) Hyalella azteca (large size) upstream 5 310 ± 30a¥ 10.5 ± 3.4a 61.2 ± 10.3b 860 ± 80b 0 -
Chibougamau downstream 4 260 ± 20a¥ 15.9 ± 1.3a 122.4 ± 6.2c 1,130 ± 30c 0 -
Aux Dorés downstream-1 1† 660 9.6 98.5 750 0 -
downstream-2 8 720 ± 130b¥ 15.4 ± 4.4a 45.7 ± 5.9a 700 ± 40a 0 -
Hyalella azteca
(small size)
upstream 6 1,560 ± 180a 34.3 ± 5.3a 25.1 ± 2.6a 1,650 ± 80a 0 -
Chibougamau downstream 0 - - - - 0 -
Aux Dorés downstream-1 0 - - - - 0 -
downstream-2 5 1,780 ± 800a 28.5 ± 10.8a 30.6 ± 7.1a 1,550 ± 310a 0 - Hexagenia limbata (large size) upstream 5 230 ± 80a 27 ± 9a 49.5 ± 5.8a 2,840 ± 360a 5 0.14 ± 0.09a Chibougamau downstream 2 190 ± 100a 16 ± 4a 54.1 ± 7.4a 3,410 ± 1,020a 0 - Aux Dorés downstream-1 3 200 ± 80
a
21 ± 5a 69.7 ± 1.6b 3,730 ± 570a 6 0.23 ± 0.04a downstream-2 4 290 ± 180a 23 ± 6a 57.0 ± 5.4a 2,710 ± 240a 0 - Concentrations significantly higher at downstream
sites? no: except H. azteca no: except Sialis sometimes: H. azteca, H. limbata no: except H. azteca no † Because n=1 these values could not be compared statistically with others.
¥ Means were compared using the Tukey test (despite the fact that these data did not satisfy the criteria for a parametric test) because the non-parametric Dunn’s test was not sufficiently powerful.
26
Table 7 Mean (± standard deviation) concentrations (nmol/g) of trace elements measured in invertebrates collected from the
Nemenjiche River at sites upstream and downstream from mining activities. For a given element and invertebrate values that do
not differ significantly (P > 0.05) are followed by the same letter. The symbol « - » indicates that too few invertebrates were collected for analysis.
Invertebrate Site n As (nmol/g) Ba (nmol/g) Cd (nmol/g) Cr‡ (nmol/g) Cu (nmol/g)
Ephemera simulans upstream 5 7 ± 1
a
52 ± 18a 48 ± 9b 24 ± 7a 184 ± 14a
downstream 5 24 ± 6b* 62 ± 9a 34 ± 2a 18 ± 4a 505 ± 56b
Litobrancha recurvata upstream 3 18 ± 4
a 74 ± 16a 14 ± 5a 38 ± 4 a 276 ± 37a downstream 5 78 ± 22b 81 ± 27a 7 ± 2a 35 ± 12a 576 ± 55b Hexagenia limbata (large size) upstream 6 20 ± 7 79 ± 23 6 ± 2 26 ± 5a 159 ± 14 downstream 0 - - - - - Hexagenia limbata (small size) upstream 1† 14 117 33 44 360 downstream 5 41 ± 13 51 ± 9 12 ± 7 21 ± 4 315 ± 30 Hyalella azteca (large size) upstream 5 23 ± 3a 293 ± 50a 6.0 ± 0.6a 38 ±4b 628 ± 77a downstream 5 38 ± 6b 308 ± 47a 6.6 ± 1.0a 15 ± 3a 1,058 ± 83b
Concentrations significantly higher at downstream
site? yes no no no
yes: except
H. limbata (small
size) ‡ Since the digestion method for Cr was not 100% efficient, data for this element should be viewed as qualitative.
27 (Table 7 continued) Invertebrate Site n Mn (nmol/g) Ni (nmol/g) Se (nmol/g) Zn (nmol/g) n Hg (nmol/g)
Ephemera simulans upstream 5 3,030 ± 560
a
10 ± 2a 52 ± 2a 4,370 ± 610b 5 0.82 ± 0.18b
downstream 5 3,840 ± 570a 31 ± 10b 85 ± 8b 3,270 ± 160a 5 0.50 ± 0.03a
Litobrancha recurvata upstream 3 3,430 ± 550
b 22 ± 4a 95 ± 9a 4,270 ± 440b 3 0.53 ± 0.06b downstream 5 2,460 ± 170a 49 ± 12b 128 ± 15b 3,080 ± 510a 5 0.37 ± 0.09a Hexagenia limbata (large size) upstream 6 4,670 ± 1,810 19 ± 5 62 ± 8 2,740 ± 170 0 - downstream 0 - - - - 0 - Hexagenia limbata (small size) upstream 1† 20,650 38 53 3,850 0 - downstream 5 4,550 ± 1,730 30 ± 7 89 ± 11 2,340 ± 320 0 - Hyalella azteca (large size) upstream 5 2,910 ± 550a 6.6 ± 0.7a 46 ± 6a 790 ± 30a 0 - downstream 5 3,150 ± 400a 13.1 ± 1.7b 79 ± 6b 910 ± 70b 0 -
Concentrations significantly higher at downstream
site? no
yes: except H.
limbata (small
size)
yes no no
28
6. Discussion
6.1. Overview of differences in trace element concentrations at sites upstream and downstream of potential sources of contamination.
Lake Chibougamau (Table 8)
Trace element concentrations measured in sediments (except for Pb and Sn) and in most invertebrates from Lake Chibougamau were equal to or less than those measured in corresponding samples from the reference site in Lake Aux Dorés. Exceptions were Hexagenia
limbata (large size) for Cd, Hyalella azteca (large size) for As, Ba, Cr, Cu, Se and Zn and Sialis for
As, Cd and Cu.
Lake Aux Dorés (Table 8)
In Lake Aux Dorés, the concentrations of all trace elements (except Cr) were higher in sediments at one or both downstream sites compared to the upstream site. Furthermore, values of ([SEM]-[AVS])/fCO suggest that Cu, Pb, Cd, Zn and Ni concentrations were potentially bioavailable in
interstitial water at the downstream sites (especially downstream-2). In contrast, invertebrate trace element concentrations were in most cases similar between the upstream and downstream sites. However, there were exceptions.
Nemenjiche River (Table 8)
Although concentrations of Ag, As, Be, Cr, Cu, Hg, Mo, Ni, Se, Sn, Tl and Zn were higher in sediments at the downstream site, values of ([SEM]-[AVS])/fCO suggest that they were not
bioavailable in interstitial waters. Although the concentrations of most elements were not higher in invertebrates collected downstream, this was not the case for As, Cu, Ni and Se concentrations which were higher in most invertebrates collected at the downstream site.
29
Table 8 Summary of trends in trace element concentrations ([M]) in sediments and in invertebrates, as well as values of [SEM]-[AVS], at sites upstream and downstream from mining activities
Lake/River Site
[SEM]-[AVS] foc (µmol/g)
Sediments (partial digestion) Invertebrates [M]downstream <
[M]upstream
[M]downstream > [M]upstream
[M]downstream < [M]upstream [M]downstream > [M]upstream
upstream 20
Lake
Chibougamau
downstream 56 Ag, As, Ba, Be, Cd, Cr, Cu, Hg, Mn, Mo, Ni, Sb, Se, Tl, Zn
Pb, Sn For all invertebrates: - Hg, Mn, Ni
- Ba, Cr, Se, Zn except for→ Hyalella azteca (large size) - As, Cu except for→ Sialis & Hyalella azteca (large size) - Cd except for→ Sialis & Hexagenia limbata (large size) Lake
Aux Dorés
downstream-1 59 Cr, Mo, Ni Ag, As, Ba, Be, Cd, Cu, Hg, Mn, Pb, Sb, Se, Sn, Tl, Zn
For all invertebrates: - Cr, Hg, Ni, Zn
- As, Ba, Cu, Mn except for→ Hyalella azteca (large size)*
- Cd except for→ Sialis & Hexagenia limbata (large size) - Se except for→ Hyalella azteca (large size)*,
Hexagenia limbata (large size) downstream–2 444 Be, Cr, Hg, Sb,
Se, Tl
Ag, As, Ba, Cd, Cu, Mn, Mo, Ni, Pb, Sn, Zn
For all invertebrates: - Ba, Cr, Hg, Se, Zn
- As except for→ Phylocentropus, Sialis - Cd, Cu except for→ Hexagenia limbata (large size) - Mn except for→ Hyalella azteca (large size)
- Ni except for→ Sialis
30 (Table 8 continued) Lake/River Site [SEM]-[AVS] foc (µmol/g)
Sediments (partial digestion) Invertebrates [M]downstream <
[M]upstream
[M]downstream > [M]upstream
[M]downstream < [M]upstream [[M]downstream > [M]upstream
Nemenjiche River
upstream 0
downstream < 0 Ba, Cd, Mn, Pb, Sb
Ag, As, Be, Cr, Cu, Hg, Mo, Ni, Sn, Se, Tl, Zn
For all invertebrates: - Ba, Cd, Cr, Hg, Mn
- Zn except for→ Hyalella azteca (large size) For all invertebrates: - As, Se
Hexagenia limbata (small size)* ← except for - Cu & Ni * Qualitative comparison only; since n=1, no statistical analyses were possible.
31
6.2. Why do trends in trace element concentrations in sediments disagree with those for sediment-dwelling invertebrates?
Measuring trace elements in sediments provides a means of evaluating the spatial extent of contamination. However, high concentrations in sediments do not necessarily mean that the plants and animals associated with them will accumulate or be affected by these contaminants. This is due in part to the fact that trace elements can be present in a variety of forms (e.g., in sulfides or bound to organic matter), some of which are not available for uptake by organisms. Thus, in this study, the concentrations of most trace elements in sediments (obtained by the partial digestion) were not in the majority of cases correlated with the bioavailability of these contaminants, based on their concentrations in invertebrates collected with the sediments.
Even when we took into account the concentrations of sediment phases such as AVS and organic carbon that are known to sequester in part some of the trace metals that we studied (Ag, Cd, Cu, Ni, Pb, Zn), relationships between sediment and invertebrate trace metal concentrations were not usually stronger. There are several possible reasons for this. First, there are other sediment phases such as oxyhydroxides of iron and manganese that bind trace metals so that they are less available for uptake by invertebrates. Second, the [SEM]-[AVS] model assumes that sediment-dwelling invertebrates take up their metals from anoxic interstitial water. However, most invertebrates remain in an oxic environment either by living in the oxic surface layer of sediments or, if they burrow into anoxic sediments, by pumping oxic water from above the sediments through their burrows (Warren et al. 1998; Gallon et al. 2008). Lastly, invertebrates do not necessarily take up their metals from water. For instance, larvae of the alderfly Sialis are reported to take up As, Cd, Co, Cu, Pb and Zn mainly from their prey (Croisetière et al. 2006) and the crustacean Hyalella azteca takes up Cd mainly from its periphyton food (Stephenson and Mackie 1993). It is important to keep in mind that the [SEM]-[AVS]/foc approach only applies to sulfur-binding metals. The bioavailability of non-sulfur
binding trace elements (e.g., As, Se, etc.) cannot be assessed with this approach.
Thus, we conclude that the best means of estimating the bioavailability of sedimentary trace elements is to measure these contaminants in the organisms that are exposed to them.
6.3. Critical evaluation of trace element concentrations in invertebrates in Oujé-Bougoumou
In Lakes Chibougamau and Aux Dorés, the concentrations of most trace elements were not greater in invertebrates at the downstream sites than in those at the upstream site. Notable exceptions were the concentrations of some trace elements in Hexagenia limbata, Hyalella azteca, Phylocentropus and Sialis (Table 8). In the Nemenjiche River, concentrations of As, Cu, Ni and Se were higher in all invertebrates (except Cu and Ni in small-sized Hexagenia limbata) at the downstream site.
Viewing our results for the lakes and the river as a whole, concentrations of As, Ba, Cd, Cu, Ni, Se and Zn were higher in Hyalella azteca, Sialis and the burrowing mayflies collected from at least one of the downstream sites compared to those collected at the upstream sites. The same can be said for the concentrations of Cr and Mn in Hyalella azteca and As in Phylocentropus. To determine if these
![Table 10 Comparison between the range of trace element concentrations ([M]) in Hyalella azteca collected in the Ouje-Bougoumou region and those that are reported to produce 25% mortality (LBC25; calculated using a saturation model)](https://thumb-eu.123doks.com/thumbv2/123doknet/4970472.122799/39.918.200.746.653.813/comparison-concentrations-hyalella-collected-bougoumou-mortality-calculated-saturation.webp)
![Table 12 Mean (± standard deviation, n=3) concentrations (in mg/kg) of trace elements ([M]) in sediments collected upstream and downstream of mining and processing activities in Lakes Chibougamau and Aux Dorés](https://thumb-eu.123doks.com/thumbv2/123doknet/4970472.122799/47.1188.40.1167.176.683/deviation-concentrations-sediments-collected-downstream-processing-activities-chibougamau.webp)
