OATAO is an open access repository that collects the work of Toulouse researchers and makes it freely available over the web where possible
Any correspondence concerning this service should be sent
to the repository administrator: [email protected] This is an author’s version published in: http://oatao.univ-toulouse.fr/21680
To cite this version:
Chabert, Marie and Trajin, Baptiste and Régnier, Jérémi and Faucher, Jean Surrogate-based diagnosis of mechanical faults in induction motor from stator current measurements. (2010) In: 7th International Conference on Condition
Monitoring and Machinery Failure Prevention Technologies - CM/MFPT 2010, 22 June 2010 - 24 June 2010 (Stratford-upon-Avon, United Kingdom)
Surrogate-based diagnosis of mechanical faults in induction motor from
stator current measurements
Marie CHABERT Laboratoire IRIT
Baptiste TRAJIN, Jérémi REGNIER, Jean FAUCHER Laboratoire LAPLACE
{baptiste.trajin, jeremi.regnier, jean.faucher}@laplace.univ-tlse.fr Université de Toulouse; INPT ; ENSEEIHT
2 rue Charles Camichel, BP 7122, F-31071 Toulouse Cedex 7
Abstract
This paper focuses on induction motor monitoring based on stator current measurements. The diagnosis aims at identifying the mechanical faults related to either airgap eccentricity or load torque oscillation. The airgap eccentricity (respectively load torque oscillation) essentially results in an amplitude (respectively phase) modulation of the stator current. Classical spectral analysis allows for the detection but not for the discrimination of these modulations. Time-frequency representations, such as the spectrogram or the Wigner distribution, provide appropriate signatures for fault discrimination. This paper proposes to perform the decision task from the time-frequency representation using the surrogate data technique. In a deterministic context, the phase and amplitude modulations can be considered as non-stationarities since they correspond to time-variations of the signal spectral content. The detection of a modulation is expressed as a binary hypothesis test. The null hypothesis corresponds to a signal without modulation. Stationarized/unmodulated replicas of the observed (possibly modulated) signal are obtained by phase randomization of its Fourier transform. These so-called surrogates provide a reference for the null hypothesis. The observed signal is then compared to these surrogates using appropriate distances in the time-frequency domain. A one-class classifier may be used considering the surrogates as a learning set. This classifier detects outliers corresponding to the modulation and thus to the failures. Moreover, this technique provides the information concerning the predominant type of modulation. This diagnosis method will be tested on simulated and experimental signals.
Keywords
Induction Machine, Stator Current Analysis, Amplitude and Phase Modulation, Surrogate Data Technique
1. Introduction
Monitoring techniques are intensively investigated to increase the reliability and safety of industrial systems using induction motors. Mechanical faults such as eccentricity and load torque oscillations have been shown to produce respectively amplitude and phase modulation of the stator current [1]. Through time-frequency distribution, the faults can be associated to particular signatures. This paper proposes the use of surrogate data technique to perform the diagnosis (detection and discrimination) in the time-frequency domain [2]. The surrogate data technique is tailored for this specific application taking advantage of the
a priori knowledge about the fault frequency. Section 2 presents the stator current model in
case of the two elementary mechanical faults: airgap length variations and load torque oscillations. Section 3 briefly presents the surrogate data technique and its application to this particular problem. Particular time-frequency distributions are presented and the associated fault signature properties are detailed. A specific implementation of surrogates
taking into account Wigner distribution properties is presented. A diagnosis on synthetic and real signals is then provided in section 4.
2. Stator current model and associated time-frequency representation
under mechanical faults
2.1Stator current models
In three-phase electric drives, three current measurements with a phase separation of one-third cycle (120° or 2/3 rad) are available and can be written in the simple form:
ik(t)=a(t)cos
(
(t)−k)
,k =2k/3, k=1,2,3 (1) with a(t) and (t) are the instantaneous amplitude and phase respectively:a(t)=I
1+cos(
2famt+am)
(2) (t) =2fst+cos(
2fpmt+pm)
+0where I denotes the stator current amplitude, fs the machine supply frequency and 0 is the initial phase. Amplitude and phase modulation indexes (resp. and ) are null or very low for healthy machines. In case of mechanical faults such as eccentricity and load torque oscillations, and/or depend on the fault type and severity [1]. am and pm are arbitrary phases. In case of dynamic eccentricities (the centre of the rotor turns around the geometrical stator centre) or geometrical deformations of the rotor, the point of minimum airgap length is not stationary. The time varying airgap permeance causes an amplitude modulation (AM) of the stator current with carrier frequency fs. When the mechanical torque is submitted to periodic oscillations, the stator current can be approached by a phase modulated (PM) signal [1]. This paper focuses on the AM and PM discrimination when both modulations occurs at the same frequency : fam = fpm = fm.
2.2 Associated spectral representation
Let consider the phase and amplitude modulated stator current defined by (2), resulting from both airgap length variations and load torque oscillations. First, note that the study of AM and PM rather applies on a complex signal for a univocal definition of the instantaneous amplitude and the instantaneous phase [3]. Indeed, for a given real signal x(t) there exists an infinite number of pairs [A(t),(t)] such as x(t)=A(t)cos[(t)]. The classical way to associate a complex signal to the measured real signal is the Hilbert Transform (HT). However, the HT is submitted to the Bedrosian theorem conditions in case of modulated signals [4]. In case of three-phase electrical machines, the three stator current measurements i1(t), i2(t) and i3(t) can be represented by a set of three coplanar vectors with a phase shift of -2/3 rad. The Concordia Transform (CT) is a linear transform which defines two components in quadrature (i,i) from the three previous vectors [5]. The complex space vector is defined by ~i(t)=i(t)+ ji
( ) ( )
t =a t ej( )t . The Jacobi-Anger expansion [7] leads to:( )
( )
( )
(
)
+ + =
+ = + 1 0 2 2 cos 2 ) ( ) ( ~ 0 n pm m n n t f j t f n J j J e t a t i s (3)where Jn() denotes the n-th order Bessel function of the first kind. For a low PM index
( 0), the infinite sum can be approximated by its first term. Moreover in this case,
( )
1 0 J and( )
2 1 J he associated Fourier Transform (FT) I~(f) is then:
( )
(
(
)
(
)
)
(
)
(
(
) (
)
)
− + − − + − + + − + + − m s m s s j m j m j f f f f f f i f f e f f e f f f Ie f I am am 2 * 2 ) ( ~ 0where * denotes the convolution. Finally, considering that terms proportional to can be neglected ( 0 as well):
(
)
(
)
(
)
+ − + + − − + + − − − m s j j m s j j s j f f f e j e f f f e j e f f Ie f I pm am pm am 2 2 ) ( ~ 0The signal FT is composed of three complex peaks with related phases and amplitudes. The surrogate data technique keeps the amplitude relation while removing the phase relation. The surrogate signal thus appears as a three component signal.
2.2 Associated time-frequency representation 2.2.1 Spectrogram
The spectrogram of the complex signal ~i
( )
t is defined by :( )
( ) (
)
2 2 ~,
~
.
+ − −−
=
i
u
w
u
t
e
du
f
t
S
iw j fu (4)where w
( )
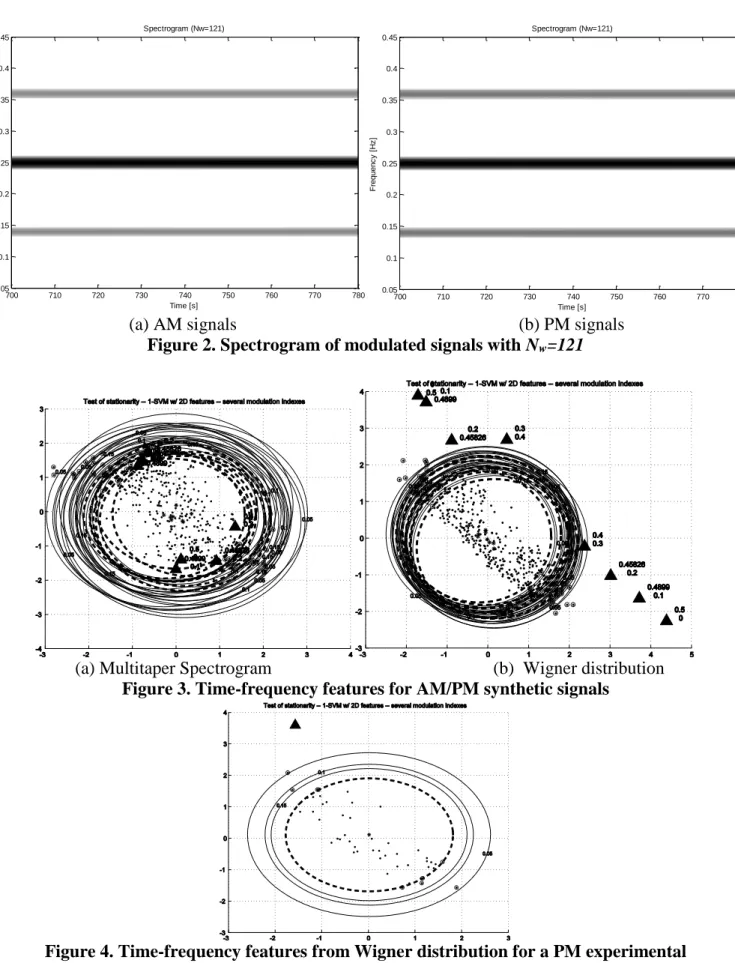
t is the time observation window [3]. The discrimination between AM and PM obtained with the spectrogram is strongly related to the observation window length. A short observation window leads to an accurate time localization but at the expense of frequency resolution and conversely. Consider signals ik(t) as defined in (1) with fs=0.25, fm=0.11,am=pm=0, 0=0, I=1. For the spectrogram computation, the window length is set to
Nw=13 in Fig. 1(a)-(b), and Nw=121 in Fig. 2(a)-(b). The difference between AM and PM
clearly appears for a short window length. The surrogate data technique presented in [2] rather uses a multitaper spectrogram derived as the average of spectrograms on several different windows.
2.2.2 Wigner distribution
The Wigner Distribution (WD) is a time-frequency energy distribution. The WD W~(t, f) i of the complex signal ~i is defined as:
+ − − − + = i t i t e d f t W j f i 2 ~ 2 ~ 2 ~ ) , ( (5) where z denotes the conjugate of z. The WD is of strong interest for detection and diagnosis purposes in electrical drives either in steady state or at variable speed (varying carrier frequency). Indeed, AM and PM (i.e. airgap length variations and load torque oscillations) can be distinguished from the phase analysis of the WD interference structure [1].The pure PM current WD is characterized by a fundamental component at fs and periodic phase quadrature sidebands at fs±fm/2 with frequency fm. A pure AM current WD is characterized by a fundamental component and periodic in phase sidebands at frequencies
fs±fm/2 with frequency fm. In both cases, the sidebands correspond to the WD interference
structure. The phase shift between interference terms can be used to distinguish AM and PM stator current.
More generally, in the case of mixted AM/ PM, the interference terms are:
( )
(
fmt am)
(
fmt pm)
I t
Int+ = cos2 + −sin2 +
2 2 for 2 s m f f f = +
( )
(
fmt am)
(
fmt pm)
I tInt− = cos2 + +sin 2 +
2 2 for 2 s m f f f = −
When noise can be neglected, the sum and the difference between these interference terms:
( )
t Int( )
t Int( )
t I(
fmt am)
Sum = − + + = 2cos2 +
( )
t Int( )
t Int( )
t I(
fmt pm)
Diff = − − + = 2sin 2 + (6) are sine waves with frequency fm and with amplitude proportional to the AM and PM
modulation indexes. AM and PM can be characterized by the peak amplitudes of the power spectral density of Sum
( )
t and Diff( )
t at frequency fm.3. Surrogate data technique
3.1 General Principle
The surrogate data technique creates signals whose spectrum magnitude is identical to that of the observed signal while being stationarized by suppressing their particular structure in time. The observed signal is first Fourier transformed. The magnitude of the spectrum is kept unchanged while its phase is replaced by a random sequence, uniformly distributed over [− ]. This modified spectrum is then inverse Fourier transformed, leading to as many stationary surrogate signals as phase randomizations are operated [2].
A support vector data description can be used to distinguish between modulated and non-modulated signals. The training set is composed by the surrogate signals generated from the observed signal. Classification uses features extracted from appropriate time-frequency representations such as the normalized multi-taper spectrogram [2]. Figure 3.a). displays the results obtained with simulated AM/PM signals with AM and PM index varying from 0 to 0.5. The triangles correspond to the time-frequency features of the observed signal. The dots represent the associated surrogates. Predominant AM modulation concentrates at the bottom on the right side whereas predominant PM is at the top on the left. Note that mixed modulations with low indexes are closed to non modulated signals using this representation. In this paper, we propose the use of the Wigner distribution to exploit the particular interference structure in case of AM and PM signals.
3.2 Particular implementation with Wigner distribution
According to (6), AM and PM can be characterized by the peak amplitude at frequency fm of Sum and Diff power spectral density. Such measures take advantage of a priori knowledge of the fault modulation frequency and thus may provide better performance than the more general measure used in association with the multi-taper spectrogram in [2]. Indeed, in this very particular case where the modulation frequency is even roughly known,
the Wigner distribution provides better detection performance than the multi-taper spectrogram. The result obtained with a PM experimental signal is provided on figure 3.
5. Conclusions
This paper addressed the problem of mechanical fault diagnosis for electrical drives. Eccentricity and load torque oscillations result in an amplitude and phase modulation of the stator current. Time-frequency representations, such as the spectrogram and Wigner distribution, provide signatures for fault detection and discrimination. In this paper, the surrogate data technique allows for diagnosis in association with the multitaper spectrogram or with the Wigner distribution. Time-frequency features are extracted from these distribution and are used by a support vector machine for classification. As a final result, the classifier provides information on the fault severity and type.
Aknowledgment
The authors wish to thank P. Borgnat for discussions concerning surrogate data technique and for the codes he provided.
References
[1] B. Trajin, M. Chabert, J. Regnier, J. Faucher, “Hilbert versus Concordia transform for three-phase machine stator current time-frequency monitoring”. Mechanical Systems and Signal Processing, vol. 23, no. 8, pp. 2648-2657, Nov. 2009.
[2] P. Borgnat, P. Flandrin, P. Honeine, C. Richard, J. Xiao. “ Testing Stationarity with Surrogates: A Time-Frequency Approach” accepted for publication in IEEE Trans. On Signal Proc..
[3] P. Flandrin. “Time-Frequency/Time-Scale Analysis” San Diego, Academic Press, 1999.
[4] E. Bedrosian. “A product theorem for Hilbert Transforms”. Proceedings of the IEEE, vol. 51, no 5, pp. 868-869, May 1963.
[5] P. Vas. “Electrical Machines and Drives – A space-vector theory approach”. Oxford Science Publications, Oxford, 1992.
[6] M. Blodt, D. Bonacci, J. Regnier, M. Chabert and J. Faucher. “On-Line Monitoring of Mechanical Faults in Variable-Speed Induction Motor Drives Using the Wigner Distribution”, IEEE Transactions on Industrial Electronics, Vol. 55, n. 2, pp. 522-533, Feb. 2008.
[7] M. Abramowitz, I. A. Stegun. “Handbook of Mathematical Functions with Formulas, Graphs, and Mathematical Tables”. Dover Publications, New York, nineth ed., 1964.
Spectrogram (Nw=13) Time [s] Fr eq ue nc y [H z] 700 710 720 730 740 750 760 770 780 0.1 0.15 0.2 0.25 0.3 0.35 0.4 Spectrogram (Nw=13) Time [s] Fr eq ue nc y [H z] 700 710 720 730 740 750 760 770 780 0.05 0.1 0.15 0.2 0.25 0.3 0.35 0.4 0.45
(a) AM signals (b) PM signals Figure 1. Spectrogram of modulated signals with Nw=13
Spectrogram (Nw=121) Time [s] Fr e q u e n c y [ H z ] 700 710 720 730 740 750 760 770 780 0.05 0.1 0.15 0.2 0.25 0.3 0.35 0.4 0.45 Spectrogram (Nw=121) Time [s] Fr e q u e n c y [ H z ] 700 710 720 730 740 750 760 770 780 0.05 0.1 0.15 0.2 0.25 0.3 0.35 0.4 0.45
(a) AM signals (b) PM signals Figure 2. Spectrogram of modulated signals with Nw=121
(a) Multitaper Spectrogram (b) Wigner distribution Figure 3. Time-frequency features for AM/PM synthetic signals
Figure 4. Time-frequency features from Wigner distribution for a PM experimental signal