Pépite | Les pratiques de sélection de test dans une grande entreprise d’informatique
143
0
0
Texte intégral
(2) Thèse de Vincent Blondeau, Lille 1, 2017. © 2017 Tous droits réservés.. lilliad.univ-lille.fr.
(3) Thèse de Vincent Blondeau, Lille 1, 2017. i. Acknowledgments I would like to thank my thesis supervisors Nicolas Anquetil and Anne Etien for allowing me to do a Ph.D at the RMoD group, as well as helping and supporting me during the three years of my Ph.D. I thank also my managers at Worldline, Sylvain Cresson and Pascal Croisy for their support and help. I thank the thesis reviewers and jury members Antony Clève, Andy Zaidman for kindly reviewing my thesis and providing me valuable feedback. I thank the jury members Serge Demayer, Clarisse Dhaenens, and Henda Hajjami Ben Ghezala. Many thanks to the RMoD group members, the SDCO transversal business unit members and everyone that helped me to achieve my works. I personally wanted to thank Olivier Auverlot, Clément Bera, Julien Delplanque, Stéphane Ducasse, Cyril Ferlicot, Guillaume Larchevêque, Brice Govin, Thibault Raffaillac, Gustavo Santos, and Benoît Verhaeghe for their collaboration and fellowship. Finally, I thank my family and friends for the support during this adventure.. © 2017 Tous droits réservés.. lilliad.univ-lille.fr.
(4) Thèse de Vincent Blondeau, Lille 1, 2017. © 2017 Tous droits réservés.. lilliad.univ-lille.fr.
(5) Thèse de Vincent Blondeau, Lille 1, 2017. iii. Abstract Nowadays, Worldline, a major IT company, develops application that are dealing with an increasing amount of critical data with a source code is more and more complex. To the stay in the race against its competitors, Worldline has to increase the quality of its projects. One transversal team of the company has for main mission to enhance project quality. By joining this team, we performed an audit of several projects of the company to identify how to avoid project failure. Relying on project metadata analysis, interviews, survey, and literature study, this audit drew no final conclusion. However, it highlighted a need to enhance testing usage. To test every piece of code is compulsory to avoid project failure. In industry and more specifically in Worldline, automation of tests has begun to ensure the proper behavior of their applications. But, ensuring the execution of all tests after a change can be a costly operation requiring several hours. However, in a daily development process, developers can not run all the tests after a change to check the impact of their modifications. Feedback on the changed code is delayed and developer have to spent time to discover the potential bugs. A late feedback can potentially lead to the failure of a project. The solution generally proposed in literature consists in reducing the number of tests to run by selecting only the ones related to the last changes made by the developer. The approach selects a suitable and small set of tests to detect potential regression in the application behavior. Test selection approaches have their own advantages and drawbacks. These approaches need to be studied in the context of Worldline and consequently adapted to suit developers habits. Before integrating such an adapted test selection approach, a study of the testing behavior of the developers have been done to get their current test selection usage. This study will monitor all the tests launched by the developers during their everyday development tasks. Based on the study of the Worldline environment, we developed a tool for the developers aiming to perform test selection. It is adapted to the developers habits and is directly usable by them. The goal is also to study the impact of this tool on their behavior. We hope that the test selection approach that is packaged in a tool adapted to the Worldline developers will bring a change in their development process. Keywords: Software Maintenance, Testing, Automated Test Selection, Industrial. © 2017 Tous droits réservés.. lilliad.univ-lille.fr.
(6) Thèse de Vincent Blondeau, Lille 1, 2017. © 2017 Tous droits réservés.. lilliad.univ-lille.fr.
(7) Thèse de Vincent Blondeau, Lille 1, 2017. v. Résumé De nos jours, Worldline, une importante société d’informatique, développe des applications qui traitent un nombre croissant de données critiques avec un code source de plus en plus complexe. Pour rester dans la course contre ses concurrents, Worldline doit améliorer la qualité de ses projets. Une équipe transversale de la société a pour mission principale d’améliorer la qualité des projets. En rejoignant cette équipe, nous avons réalisé un audit sur plusieurs projets de l’entreprise afin d’identifier comment éviter l’échec des projets. En se basant sur une analyse de métadonnées, des interviews, des sondages, et une étude de la littérature, cet audit n’a finalement tiré aucune conclusion. Cependant, il a mis en lumière le besoin d’améliorer l’utilisation des tests. Effectivement, tester chaque partie du code est requis pour éviter l’échec du projet. Dans l’industrie, et plus spécifiquement à Worldline, l’automatisation des tests a commencé dans le but de maîtriser le comportement des applications. Mais, s’assurer de l’exécution de tous les tests après un changement peut être une opération coûteuse requérant plusieurs heures. Le retour sur le code changé est retardé et le développeur perd du temps pour découvrir les potentiels bogues. Ainsi, un retour tardif peut potentiellement amener le projet à l’échec. La solution généralement proposée dans la littérature consiste à réduire le nombre de tests à lancer en sélectionnant seulement ceux relatifs aux derniers changements effectués par le développeur. L’approche sélectionne un jeu de tests réduit et approprié qui détectera de potentielles régressions dans le comportement de l’application. Chaque approche de sélection de tests a ses propres avantages et inconvénients. Elles ont donc besoin d’être étudiées dans le contexte de Worldline et adaptées en conséquence pour convenir aux habitudes des développeurs. Avant d’intégrer une telle approche, une étude a été faite pour connaître les habitudes actuelles des développeurs vis-à-vis de la sélection de tests. Cette étude surveille tous les tests lancés par les développeurs pendant leurs tâches quotidiennes de développement. Grâce à l’étude de l’environnement de Worldline, nous avons développé un outil pour les développeurs visant à effectuer la sélection des tests. Il est adapté aux habitudes des développeurs et leur est directement utilisable. Le but est aussi d’étudier l’impact de cet outil sur leur comportement. Nous espérons que cette approche de sélection de tests ainsi contenue dans un outil adapté aux développeurs de Worldline, apportera des changements dans leur processus de développement. Mots-clés: Maintenance Logicielle, Tests, Sélection Automatisée de Tests, Industrie. © 2017 Tous droits réservés.. lilliad.univ-lille.fr.
(8) Thèse de Vincent Blondeau, Lille 1, 2017. © 2017 Tous droits réservés.. lilliad.univ-lille.fr.
(9) Thèse de Vincent Blondeau, Lille 1, 2017. Contents 1. 2. 3. 4. © 2017 Tous droits réservés.. Introduction 1 Context . . . . . . . . . . . 2 Problem . . . . . . . . . . . 3 Our Approach in a Nutshell . 4 Contributions . . . . . . . . 5 Structure of the Dissertation 6 List of Publications . . . . .. . . . . . .. 1 1 2 3 4 4 5. . . . . . . . . .. 7 7 8 12 20 21 22 22 23 30. . . . . . . . . . . . .. 31 31 32 33 34 35 36 37 37 39 39 40 43. Comparison of Approaches to Select Tests from Changes 1 Taxonomy of Issues . . . . . . . . . . . . . . . . . . . . . . . . . 1.1 Proposed Classification of Issues . . . . . . . . . . . . . . 1.2 Third-Party Breaks . . . . . . . . . . . . . . . . . . . . .. 45 45 46 47. . . . . . .. . . . . . .. . . . . . .. . . . . . .. . . . . . .. Motivation 1 Predicting the Health of a Project . . . 1.1 Systematic Literature Review 1.2 Data mining . . . . . . . . . . 1.3 Interviews . . . . . . . . . . . 1.4 Conclusion . . . . . . . . . . 2 Developers Insight on Project Quality 2.1 Survey Description . . . . . . 2.2 Results . . . . . . . . . . . . 2.3 Conclusion . . . . . . . . . .. . . . . . .. . . . . . . . . .. . . . . . .. . . . . . . . . .. . . . . . .. . . . . . . . . .. . . . . . .. . . . . . . . . .. State of the Art 1 Test Selection Approaches . . . . . . . . . . 1.1 Control Flow Graph Approaches . . . 1.2 Dynamic versus Static: Pros and Cons 1.3 Evaluation Criteria . . . . . . . . . . 1.4 Test Selection Approach . . . . . . . 2 Tooling for Test Selection . . . . . . . . . . . 2.1 Evaluation Criteria . . . . . . . . . . 2.2 Tooling . . . . . . . . . . . . . . . . 3 Testing Habits of Developers . . . . . . . . . 3.1 Evaluation Criteria . . . . . . . . . . 3.2 Studies . . . . . . . . . . . . . . . . 4 Conclusion . . . . . . . . . . . . . . . . . .. . . . . . .. . . . . . . . . .. . . . . . . . . . . . .. . . . . . .. . . . . . . . . .. . . . . . . . . . . . .. . . . . . .. . . . . . . . . .. . . . . . . . . . . . .. . . . . . .. . . . . . . . . .. . . . . . . . . . . . .. . . . . . .. . . . . . . . . .. . . . . . . . . . . . .. . . . . . .. . . . . . . . . .. . . . . . . . . . . . .. . . . . . .. . . . . . . . . .. . . . . . . . . . . . .. . . . . . .. . . . . . . . . .. . . . . . . . . . . . .. . . . . . .. . . . . . . . . .. . . . . . . . . . . . .. . . . . . .. . . . . . . . . .. . . . . . . . . . . . .. lilliad.univ-lille.fr.
(10) Thèse de Vincent Blondeau, Lille 1, 2017. viii. Contents. 2. 3. 4. 5 6 5. © 2017 Tous droits réservés.. 1.3 Multi-program Breaks . . . . . . . . . . . . . . . . . . . 1.4 Dynamic Breaks . . . . . . . . . . . . . . . . . . . . . . 1.5 Polymorphism Breaks . . . . . . . . . . . . . . . . . . . Experimental Setup . . . . . . . . . . . . . . . . . . . . . . . . . 2.1 Case Study Protocol . . . . . . . . . . . . . . . . . . . . 2.2 Projects . . . . . . . . . . . . . . . . . . . . . . . . . . . 2.3 Dynamic and Static Approaches Tooling . . . . . . . . . 2.4 Metrics . . . . . . . . . . . . . . . . . . . . . . . . . . . Results and Discussion . . . . . . . . . . . . . . . . . . . . . . . 3.1 RQ1 – Third-Party Breaks Impact . . . . . . . . . . . . . 3.2 RQ2 – Dynamic Breaks Impact . . . . . . . . . . . . . . 3.3 RQ3 – Polymorphism Breaks Impact . . . . . . . . . . . 3.4 RQ4 – Impact of Combining Solutions . . . . . . . . . . 3.5 RQ5 – Weighting of Results with the Number of Commits 3.6 RQ6 – Aggregation of the Results by Commit . . . . . . . 3.7 Overall Conclusions . . . . . . . . . . . . . . . . . . . . Evaluation of Validity . . . . . . . . . . . . . . . . . . . . . . . . 4.1 Construct Validity . . . . . . . . . . . . . . . . . . . . . 4.2 Internal Validity . . . . . . . . . . . . . . . . . . . . . . 4.3 External Validity . . . . . . . . . . . . . . . . . . . . . . Comparison to Other Works . . . . . . . . . . . . . . . . . . . . Conclusion . . . . . . . . . . . . . . . . . . . . . . . . . . . . .. Study of Developers’ testing behavior in a Company 1 Experimental Setup . . . . . . . . . . . . . . . . . . . . . . . 1.1 Research questions . . . . . . . . . . . . . . . . . . . 1.2 Experimental protocol . . . . . . . . . . . . . . . . . 1.3 Filtering and Massaging Data . . . . . . . . . . . . . 1.4 Automatic Test Selection . . . . . . . . . . . . . . . . 1.5 Interviews with the Participants . . . . . . . . . . . . 2 Results and Discussion . . . . . . . . . . . . . . . . . . . . . 2.1 Case Studies . . . . . . . . . . . . . . . . . . . . . . 2.2 RQ1: How and why developers run tests? . . . . . . . 2.3 RQ2: How do developers react to test runs? . . . . . . 2.4 RQ3: How and why developers perform test selection? 3 Threats to Validity . . . . . . . . . . . . . . . . . . . . . . . . 3.1 Construct Validity . . . . . . . . . . . . . . . . . . . 3.2 Internal Validity . . . . . . . . . . . . . . . . . . . . 3.3 External Validity . . . . . . . . . . . . . . . . . . . . 4 Conclusion . . . . . . . . . . . . . . . . . . . . . . . . . . .. . . . . . . . . . . . . . . . .. . . . . . . . . . . . . . . . .. 49 50 52 53 53 55 58 58 60 60 60 62 62 64 66 68 69 69 70 71 71 73 75 75 75 76 77 80 80 82 82 84 88 89 91 91 92 92 92. lilliad.univ-lille.fr.
(11) Thèse de Vincent Blondeau, Lille 1, 2017. Contents 6. 7. ix. Impact of the Usage of the Test Selection Tool 1 Test Selection Plugin . . . . . . . . . . . 1.1 General Overview . . . . . . . . 1.2 Architecture . . . . . . . . . . . . 2 Case Study . . . . . . . . . . . . . . . . 2.1 Data Analysis . . . . . . . . . . . 2.2 Interviews Description . . . . . . 3 Results and Discussion . . . . . . . . . . 3.1 Global Results . . . . . . . . . . 3.2 Individual Results . . . . . . . . 4 Conclusion . . . . . . . . . . . . . . . . Conclusion & Perspectives 1 Summary . . . . . . . 2 Contributions . . . . . 3 Future Work . . . . . . 3.1 Industrial . . . 3.2 Academic . . .. . . . . .. . . . . .. . . . . .. . . . . .. . . . . .. . . . . .. . . . . .. . . . . .. . . . . .. . . . . .. . . . . . . . . . .. . . . . .. . . . . . . . . . .. . . . . .. . . . . . . . . . .. . . . . .. . . . . . . . . . .. . . . . .. . . . . . . . . . .. . . . . .. . . . . . . . . . .. . . . . .. . . . . . . . . . .. . . . . .. . . . . . . . . . .. . . . . .. . . . . . . . . . .. . . . . .. . . . . . . . . . .. . . . . .. . . . . . . . . . .. . . . . .. . . . . . . . . . .. . . . . .. . . . . . . . . . .. 95 95 96 98 100 100 102 104 104 106 107. . . . . .. 109 109 111 111 111 112. A Appendix 115 1 Analysis of Project Data . . . . . . . . . . . . . . . . . . . . . . 116 Bibliography. © 2017 Tous droits réservés.. 117. lilliad.univ-lille.fr.
(12) Thèse de Vincent Blondeau, Lille 1, 2017. © 2017 Tous droits réservés.. lilliad.univ-lille.fr.
(13) Thèse de Vincent Blondeau, Lille 1, 2017. List of Figures 2.1. Projection of the project metrics on the first and the second principal components . . . . . . . . . . . . . . . . . . . . . . . . . . . 2.2 Correlation matrix between each metric of the sample . . . . . . . 2.3 Impact of each metric on the sample . . . . . . . . . . . . . . . . 2.4 Question 1: On a daily basis, on which criteria do you base yourself to assess the health of your project? . . . . . . . . . . . . . . . . 2.5 Question 2: For you, what items are contributing to project success? 2.6 Question 3: Which actions should be taken to improve project health? 2.7 Question 4: What are the items that are contributing to project failure? 2.8 Question 5: In order to improve project health, could a tool help you to: . . . . . . . . . . . . . . . . . . . . . . . . . . . . . . . . 2.9 Question 8: Which items block you from doing automated tests? . 2.10 Question 9: Regarding tests and software quality, which items can help you in the improvement of your project? . . . . . . . . . . .. 24 25 25 27. 3.1. 33. 4.1 4.2 4.3 4.4 4.5 4.6 4.7 4.8 4.9. Test Selection Simple Case . . . . . . . . . . . . . . . . . . . . .. Libraries Case . . . . . . . . . . . . . . . . . . . . . . . . . . . . Anonymous Classes Case . . . . . . . . . . . . . . . . . . . . . . Delayed Execution Case . . . . . . . . . . . . . . . . . . . . . . Annotation Case . . . . . . . . . . . . . . . . . . . . . . . . . . . External Test Case . . . . . . . . . . . . . . . . . . . . . . . . . Dynamic Execution Case . . . . . . . . . . . . . . . . . . . . . . Attribute Direct Access . . . . . . . . . . . . . . . . . . . . . . . Tests Selection Approach Through Interfaces . . . . . . . . . . . Boxplot of the distribution of the Moose w/ att. & anon. & polym. & delayed exec. study considering all Java methods individually. The diamonds represent the mean value of the metric (presented in Table 4.2) . . . . . . . . . . . . . . . . . . . . . . . . . . . . . . 4.10 Boxplot of the distribution of the Moose w/ att. & anon. & polym. & delayed exec. study considering a weighting of Java methods with the number of commits they appear in . . . . . . . . . . . . 4.11 Boxplot of the distribution of the Moose w/ att. & anon. & polym. & delayed exec. study considering Java methods grouped in commits. © 2017 Tous droits réservés.. 16 17 19. 28 29 30. 47 48 49 49 50 51 52 53. 63. 64 68. lilliad.univ-lille.fr.
(14) Thèse de Vincent Blondeau, Lille 1, 2017. xii. List of Figures 5.1. 5.2 6.1 6.2 6.3. A test/code session with three agglomerated test sessions (AT1, AT2, AT3) themselves comprising several test sessions (T1, . . . , T7), themselves comprising several tests (t1, . . . , t7). C1 and C2 are commits, C1 being the direct ancestor of C2. All events after C1 occur on the same project by the same developer. . . . . . . . Relation between the number of automatic and manual test selection (left Gligoric et al. [2014], right our case study) . . . . . . . .. 90. Test Selection Tool Workflow . . . . . . . . . . . . . . . . . . . . Display Window for Selected Tests in Eclipse . . . . . . . . . . . Test Selection Tool Workflow . . . . . . . . . . . . . . . . . . . .. 97 98 99. 78. A.1 Correlation matrix between each metric of the sample . . . . . . . 116. © 2017 Tous droits réservés.. lilliad.univ-lille.fr.
(15) Thèse de Vincent Blondeau, Lille 1, 2017. List of Tables 2.1 2.2 2.3. Description of the Systematic Literature Review . . . . . . . . . . Description of the Interviewees . . . . . . . . . . . . . . . . . . . Statistical summary of the metrics used for the analysis . . . . . .. 9 13 16. 3.1 3.2 3.3. Approaches Criteria Matrix . . . . . . . . . . . . . . . . . . . . . Tools Criteria Matrix . . . . . . . . . . . . . . . . . . . . . . . . Criteria Matrix for Study of Developer Test Behavior . . . . . . .. 36 39 40. 4.1 4.2. Global metrics of projects P1, P2 and P3 . . . . . . . . . . . . . . Comparison of the static approaches to the dynamic one for test case selection considering all Java methods individually . . . . . . Comparison of the static approaches to the dynamic one with a weighting of Java methods with the number of commits they appear in Comparison of the static approaches to the dynamic one to test case selection, considering Java methods grouped in commits . . . . . Comparison of the static approaches to the dynamic one to select the tests after a method change . . . . . . . . . . . . . . . . . . .. 57. 81 83 83. 5.5. Descriptive Statistics per Participant . . . . . . . . . . . . . . . . Descriptive statistics on the three case studies . . . . . . . . . . . Descriptive statistics per developer . . . . . . . . . . . . . . . . . Comparison of our results with those of the Worldline Case Study. (When computing number of tests per session, we give results for test sessions and agglomerated sessions to match Beller et al.’s case study). Histograms are in log scale . . . . . . . . . . . . . . . . . Test Duration and the number of execution of each test . . . . . .. 6.1 6.2. Descriptive Data of the Participants . . . . . . . . . . . . . . . . 101 Testing Behavior Description for each Participant . . . . . . . . . 101. 4.3 4.4 4.5 5.1 5.2 5.3 5.4. © 2017 Tous droits réservés.. 61 65 67 72. 85 86. lilliad.univ-lille.fr.
(16) Thèse de Vincent Blondeau, Lille 1, 2017. © 2017 Tous droits réservés.. lilliad.univ-lille.fr.
(17) Thèse de Vincent Blondeau, Lille 1, 2017. C HAPTER 1. Introduction. Contents. 1. 1. Context . . . . . . . . . . . . . . . . . . . . . . . . . . . . . . . .. 1. 2. Problem . . . . . . . . . . . . . . . . . . . . . . . . . . . . . . . .. 2. 3. Our Approach in a Nutshell . . . . . . . . . . . . . . . . . . . . .. 3. 4. Contributions . . . . . . . . . . . . . . . . . . . . . . . . . . . .. 4. 5. Structure of the Dissertation . . . . . . . . . . . . . . . . . . . .. 4. 6. List of Publications . . . . . . . . . . . . . . . . . . . . . . . . .. 5. Context. Competition between IT companies is tough. Each company wants to attract client projects, implement, and maintain them. But, this has a cost: to ensure the success of a project, the employees have to ensure that the client has the requested application in time, within budget, and with all the desired features implemented. Nowadays, applications of Worldline, a major IT company, are dealing with an increasing amount of critical data, and their source code is more and more complex. To stay in the race, the company has to reinvent itself continually. One transversal team of the company has for mission to provide tools, expertise and support to the development teams. The goal of this team is to ease the day to day work of developers in particular, and enhance project quality in general. By joining this team, we performed an audit of several projects of the company to try to identify how to avoid project failure. This audit, described in the first chapter of this thesis, relies on project metadata analysis, interviews, survey, and literature study. The root causes of project failure identified mainly point the lack of communication between the client and the project team. However, as a byproduct, the audit also highlighted a need to enhance testing practice. To avoid failure, testing every piece of code is compulsory. But, for a long time, applications had to be tested manually: no support was given to the developers to test complex application automatically. Despite the fact that this practice. © 2017 Tous droits réservés.. lilliad.univ-lille.fr.
(18) Thèse de Vincent Blondeau, Lille 1, 2017. 2. Chapter 1. Introduction. still exists, developers began, in industry Bertolino [2007], and more specifically at Worldline, to automate tests to ensure the proper behavior of their applications. But, at Worldline, these tests take too much time to be executed frequently. Having yet no knowledge on how testing is practiced in the company, we hypothesized that this execution often happens only at night thanks to continuous integration tooling. Thus, tests do not provide immediate feedback; they fail in one of their main missions. To convince the transversal team of imposing a change in development practices of thousands of developers, we needed hard data on the pros and cons of the impact of launching tests sooner to give developers faster feedback.. 2. Problem. At Worldline, ensuring the execution of all tests after a change can be a costly operation requiring several hours. However, in a daily development process, developers can not run all the tests after a change to check the impact of their modifications. This operation may require installing, configuring and updating databases or others environments as well as testing abnormal running conditions such as timeout on server connection. They do not have time to do that due to stress and deadlines in the project. Consequently, we observed that developers very often skip tests during the day and run them only at night thanks to continuous integration servers. But, that is not a viable solution. Feedback on the changed code should be fast to help identify the potential bugs more quickly. Delayed feedback harms software development and can potentially lead to the failure of a project. In this manuscript, we focus on two kinds of automated tests: customer tests and developer tests (based on the test taxonomy of Meszaros [2007]). • “A customer test verifies the behavior of a slice of the visible functionality of the overall system. The system under test may consist of the entire system or a fully functional top-to-bottom slice of the system”. • “An unit test is a test that verifies some small parts of the overall system. What turns a test into a unit test is that the system under test is a very small subset of the overall system and may be unrecognizable to someone who is not involved in building the software. In contrast to a customer test, which is derived almost entirely from the requirements and which should be verifiable by the customer.” These two kinds of tests can be found at Worldline. However, in case of time pressure, the customer tests (checking customer requirements) take priority and the unit tests are left apart. To avoid this, some best practices are defined at Worldline. They state that the developers should: • Cover at least 80% of source code with automated tests. • Use Continuous Integration to compile and test their application.. © 2017 Tous droits réservés.. lilliad.univ-lille.fr.
(19) Thèse de Vincent Blondeau, Lille 1, 2017. 3. Our Approach in a Nutshell. 3. • Follow a “git workflow”, i.e., use branches and pull requests to integrate their features. However, a great deal of freedom is also given to the developers and project leaders to choose their own technology stack, development technique, strategy, etc. Thus for example, agile methods or Test Driven Development are progressively used inside the company but remain marginal at the moment of this writing. Worldline being a huge company, no deep analysis has been performed to identify the projects following these best practices or not. In our study of different projects, we found that they were often laid aside. A solution generally proposed in literature to get faster feedback on the changed code consists in reducing the number of tests to run by selecting only the ones related to the last changes made by the developer. The approach selects a suitable and small set of tests to detect potential regression in the application behavior. We expect that such a test selection approach could change the habits of the Worldline developers. Two consequences of this change are foreseen: first, they will not relaunch all the tests of the application each time; second, they will be encouraged to run tests more often. Among test selection approaches, two suit our needs: static and dynamic. The static approach creates a model of the source code and explores it to find links between changed methods and tests. The dynamic approach records invocations of methods during the execution of test scenarios. These two approaches have their own advantages and drawbacks that need to be studied in the context of Worldline and consequently adapted. Moreover, to convince the company of the impact of such approaches on the work of its developers, we need, first, to study their habits before using it and, second, to compare them with their new practices, i.e., adopting an adapted test selection approach. However, to be relevant, this study has to be performed on as many developers as possible, for the longest period possible,. . . Also, these studies have to be performed without extra cost for the developers, i.e., included in their development environment and not delay any of their activities.. 3. Our Approach in a Nutshell. In our goal to change developers habits by introducing test selection, our first action is to shape a test selection approach adapted to the Worldline environment. Worldline is the European leader in the payments and transactional services industry. Its applications have to take care of a substantial amount of financial transactions. A plethora of libraries and frameworks are used. It can impede some test selection approaches to operate. Furthermore, the Java programming language is mainly used. Despite this language being statically typed, thus facilitating a static. © 2017 Tous droits réservés.. lilliad.univ-lille.fr.
(20) Thèse de Vincent Blondeau, Lille 1, 2017. 4. Chapter 1. Introduction. approach, some particularities of the language like inheritance or reflexivity, could be a problem for test selection (see Chapter 4). So, these specificities have to be considered to propose an adapted test selection solution. Another constraint, due to the industrial context of this study, is that our experiments should be perceived by developers as being transparent, and certainly not as disturbing their usual work. A study of the testing behavior of the developers is mandatory to get their current test selection usage before integrating such a test selection approach. This study will monitor all the tests launched by the developers during their everyday development tasks. Based on the study of the Worldline environment from a technical point of view, we will develop an adapted tool. It will take into account the identified issues and will be directly usable by the developers. The underlying goal is also to study the impact of this tool on their behavior. We hope that the test selection approach that is packaged in a tool adapted to the Worldline developers will bring a change in their development process. So, the research question of the thesis is: Can we improve the testing habits of Worldline developers by giving them faster feedback on their source code modifications? The hidden assumption behind this research question is that by improving testing habits, we will ultimately improve the chances of success of the projects. However, this assumption will not be formally tested because of time constraints.. 4. Contributions. The main contributions of this thesis are: • An audit of the developers awareness about project success and failure and root causes of software failure at Worldline. • A classification of problems that may arise when trying to identify the tests that cover a method. We give concrete examples of these problems and list some possible solutions. • A field study on how Worldline developers use tests in their daily practice, whether they use tests selection and why they do. Results are reinforced by interviews with developers involved in the study. • A study of the usage of our test selection tool on the developers.. 5. Structure of the Dissertation. The structure of the dissertation is: • Chapter 2 describes the motivation of the dissertation: it studies the ability of metrics to predict project success and gather the insights of the developers. © 2017 Tous droits réservés.. lilliad.univ-lille.fr.
(21) Thèse de Vincent Blondeau, Lille 1, 2017. 6. List of Publications. 5. about project health. • Chapter 3 gives the state of the art about test selection approaches and the study of developers habits. • Chapter 4 presents issues of the test selection approaches, the methodologies to resolve them, and the impact of their resolution on the test selection approaches. • Chapter 5 describes the experiment on testing habits of Worldline’s developers and gives results on their usage. • Chapter 6 evaluates the usage of a test selection tool on the Worldline developers through data analysis and interviews. • Chapter 7 concludes and gives perspectives for future works.. 6. List of Publications. This is the complete list of all our publications in chronological order: i. Vincent Blondeau, Nicolas Anquetil, Stéphane Ducasse, Sylvain Cresson, and Pascal Croisy. Software metrics to predict the health of a project? In IWST’15, Brescia, Italy, July 2015a. doi: 10.1145/2811237.2811294. URL http://rmod.inria.fr/archives/papers/Blon15a-IWST-Software_metrics_to_predict_the_health_ of_a_project.pdf. ii. Vincent Blondeau, Sylvain Cresson, Pascal Croisy, Anne Etien, Nicolas Anquetil, and Stéphane Ducasse. Predicting the Health of a Project? An Assessment in a Major IT Company. In SATToSE’15, Mons, Belgium, July 2015b. URL http://rmod.inria.fr/archives/papers/Blon15b-SATToSE-Predicting_the_Health_of_a_ Project-An_Assessment_in_a_Major_IT_company.pdf. iii. Vincent Blondeau, Sylvain Cresson, Pascal Croisy, Anne Etien, Nicolas Anquetil, and Stéphane Ducasse. Dynamic and Static Approaches Comparison for Test Suite Reduction in Industry. In BENEVOL’15: 14th BElgianNEtherlands software eVOLution seminar, Lille, France, December 2015c. URL http://rmod.inria.fr/archives/papers/Blon15c-BENEVOL-Blondeau_Vincent-Dynamic_ and_Static_Approaches_Comparison_for_Test_Suite_Reduction_in_Industry.pdf. iv. Vincent Blondeau, Anne Etien, Nicolas Anquetil, Sylvain Cresson, Pascal Croisy, and Stéphane Ducasse. Test case selection in industry: An analysis of issues related to static approaches. Software Quality Journal, pages 1–35, 2016b. ISSN 1573-1367. doi: 10.1007/s11219-016-9328-4. URL http://rmod. inria.fr/archives/papers/Blon16a-Software_Quality_Journal-Test_Case_Selection_in_Industry-An_ Analysis_of_Issues_Related_to_Static_Approaches.pdf. © 2017 Tous droits réservés.. lilliad.univ-lille.fr.
(22) Thèse de Vincent Blondeau, Lille 1, 2017. 6. Chapter 1. Introduction v. Vincent Blondeau, Nicolas Anquetil, Stéphane Ducasse, Sylvain Cresson, and Pascal Croisy. Test selection with moose in industry: Impact of granularity. In International Workshop on Smalltalk Technologies IWST’16, Prague, Czech Republic, September 2016a. URL http://rmod.inria.fr/archives/papers/Blon16b-IWST-Test_ Selection_with_Moose_In_Industry.pdf. vi. Benoit Verhaeghe, Nicolas Anquetil, Stéphane Ducasse, and Vincent Blondeau. Usage of tests in an open-source community. In IWST’17, Maribor, Slovenia, September 2017. URL https://hal.inria.fr/hal-01579106 vii. Vincent Blondeau, Anne Etien, Nicolas Anquetil, Sylvain Cresson, Pascal Croisy, and Stéphane Ducasse. What are the Testing Habits of Developers? A Case Study in a Large IT Company. In Proceedings of the 21st IEEE International Conference on Software Maintenance and Evolution (ICSME’17), Shanghai, China, August 2017. URL https://hal.inria.fr/hal-01571655/ file/ICSME-FinalVersion-PDF_eXpress-Certified.pdf. © 2017 Tous droits réservés.. lilliad.univ-lille.fr.
(23) Thèse de Vincent Blondeau, Lille 1, 2017. C HAPTER 2. Motivation. Contents 1. Predicting the Health of a Project . . . . . . . . . . . . . . . . .. 7. 2. Developers Insight on Project Quality . . . . . . . . . . . . . . .. 22. Despite testing being the main topic of my thesis, it was not the first. We began to focus on using big data to predict the failure of Worldline development projects.. 1. Predicting the Health of a Project. Project teams create a lot of data: process metrics, bug reports, source code, continuous integration artefacts, production metrics, social network communications, etc. On the other hand, big data approaches are becoming predominant in companies. Worldline would like to take advantage of data science, and especially statistics, to help them evaluate the health of their projects. To monitor projects health pro-actively, they would like to mine past projects data, e.g., metrics on software, bugs, budget, production issues, performance, team communications,. . . , and provide alerts to take action on the project. The hope is that some software metrics could be tracked to predict failure risks or confirm good health. If a factor of success is found, managers could anticipate projects failures and take early actions to help or to monitor closely the project, allowing one to act in a preventive mode rather than a corrective one. Finding the right metrics in the whole data set is challenging and applying it on a given project ahead of time even more. For IT projects management, two main approaches are used at Worldline: the Agile and the Waterfall processes. Agile development is still marginal: little data is available. A Waterfall process is more frequently used in Worldline, this will be the case for all the projects analyzed in this chapter. When the waterfall process is used, Worldline assesses project health according to three items: resources, schedule, and scope. Resources, are measured in man-days. They are provisioned at the beginning of the project. A project that does not respect the allocated resources has a decreasing health and is said to be in slippage. The slippage is the number of man-days a project uses in excess to the initially provisioned resources. The. © 2017 Tous droits réservés.. lilliad.univ-lille.fr.
(24) Thèse de Vincent Blondeau, Lille 1, 2017. 8. Chapter 2. Motivation. schedule is defined with the client as a series of milestones. An example of milestone can be a release of the application to the client. These milestones should be respected to avoid a decrease of the project health. The scope of the application is defined at the beginning of the project with the client. If a project does not deliver the required features at a given milestone, project health decreases too. Thereby, if the project respects the initial provisioned resources and schedule, and, provides the features required by the client, then the project is in good health. Otherwise, if one of the three items is not respected, the project is in bad health. But the health of the project is only an assessment during the project without possibility to anticipate it. To find relationship inside the available data, we reviewed literature on project success predicted by data mining. Second, we experimented with more than 10 project metrics on 50 real world, closed-source, projects of Worldline to find correlation. Third, we realized interviews with project managers to find indicators that could be linked to project health.. 1.1 1.1.1. Systematic Literature Review Methodology. To identify previous work that could have already proposed relationships between project health and some project metrics, we reviewed the literature. As defined by the guidelines of Keele et al. [2007], we first stated the following research question: “What metrics could help predict the success or failure of a project?” and defined a structure for the research questions: Population: Projects Intervention: Predict success or failure with metrics Comparison: Cross projects Outcome: Metrics used Context: Industrial From this structure, we defined the query to use in scientific articles databases: “Predict AND Project AND metric AND software AND (success OR failure)” We searched in the main data sources for our domain (software engineering): IEEEXplore, ACM, Science Direct, Springer Link, and Wiley. For each data source, we searched the keywords in the meta data. The results then need to be filtered to select only the papers related to the research question. We performed a three step process to select the relevant papers: the first selection was on the title only, the second one was on abstract, and the last one was on the full text of the article. Moreover, we included only the papers in English and peer-reviewed, and, excluded the short papers and papers that do. © 2017 Tous droits réservés.. lilliad.univ-lille.fr.
(25) Thèse de Vincent Blondeau, Lille 1, 2017. 1. Predicting the Health of a Project. 9. not study real projects. For one paper, we were not able to access its full text, and discarded it from the study. Table 2.1 summarizes the count of the papers we obtained. Table 2.1: Description of the Systematic Literature Review Selection on Data source Results Title Abstract Full Text IEEExplore 7 3 2 0 ACM 189 52 11 4 Science Direct 128 9 4 3 Springer Link 1370 45 15 7 Wiley 2 2 2 0 Total 1696 111 34 14. For the 14 selected papers, we answered these questions: • What is the title of the paper? • Who are the authors? • Is the paper a Conference or Journal paper? • What is the kind of the project (open source, company, or students)? • What is the company name (if applicable)? • How many projects are implied in the study? • What are the used techniques to predict the success or the failure of the project? • What are the metrics used for the prediction? • Is a comparison made with other prediction models? Which ones? • What is the accuracy of the approach? • What are the results? (i.e., the metrics that predict the success or failure) • What are the conclusions? This helped us organize the papers and report them. 1.1.2. Results. Fitzgerald et al. [2012] studied seven open-source projects to predict project failure. They first analyzed the discussion between project participants and extract metrics. Then, they used them as input of classification algorithms. The authors conclude that building early prediction model can provide a positive value to a project. Fukushima et al. [2014] built predictive models with 11 open source projects. They studied within project and cross project predictions thanks to 14 managerial and related to source code metrics. They conclude that it is not because a model. © 2017 Tous droits réservés.. lilliad.univ-lille.fr.
(26) Thèse de Vincent Blondeau, Lille 1, 2017. 10. Chapter 2. Motivation. is able to strongly predict within project that it can predict well in a cross project context. Cai et al. [2005] classified 18 open source and student applications thanks to source code metrics. This classification is made through summation model, product model, Bayesian belief network among others. According to the authors, these models are intuitive and easy to construct. However, their prediction accuracy is not high. Jureczko and Madeyski [2010] applied clustering and neural networks approaches on 38 open source, industrial, and students projects. They used source code metrics. The authors obtain a classification of the projects in two clusters. One contains only proprietary projects with a heavy weight development process, a successfully installation in the customer environment, some manual testing, and a use of databases. The other includes proprietary and open source applications with a use of SVN and Jira or Bugzilla, a medium size international team, an automation of the testing process, and where databases are not used. The authors conclude that the identified clusters are far from covering all projects. If clusters are correctly identified, the within cluster prediction will be better than cross cluster predictions. Turhan et al. [2013] used naive Bayes classifiers on 41 open source and industrial projects with 19 metrics related to complexity, control flow, and software size. The authors concluded that by adding cross project prediction in their withinproject model, the results are enhanced, but lightly. The study also found that collecting data from other projects is adding extra effort. Ratzinger et al. [2007] used eight industrial projects with linear regression, regression trees, and classifier to predict defects. They used 63 evolution metrics related particularly to the size of the project, the team, the complexity of existing solutions,. . . According to the authors, multiple aspects such as time constraints, process orientation, team related and bug-fix related features play an important role in defect prediction models. They conclude that size and complexity measures have not a major impact on defect-proneness prediction, but people-related issues are important. Nagappan et al. [2006] described how they apply statistical methods to predict bugs after delivery to the client. They mined five C++ Microsoft applications, including Internet Explorer 6 and DirectX, then correlated 31 code metrics with post-release project failure data. They used module metrics (number of classes or functions), functions metrics (number of lines, parameters, called functions, calling functions, and cyclomatic complexity,...), and class metrics (number of classes, superclasses, subclasses, and classes coupled). By doing statistical analysis, they found, for each project, a set of metrics related to post-release bugs. But, this set is changing from one project to the other. As project failure has to be anticipated, the ideal is to find a unique set of metrics suitable for any project. Zimmermann et al. [2009] had for goal to predict class defect from both metrics. © 2017 Tous droits réservés.. lilliad.univ-lille.fr.
(27) Thèse de Vincent Blondeau, Lille 1, 2017. 1. Predicting the Health of a Project. 11. from source code and project environment. They extracted data from 12 products: closed-source from Microsoft projects, like DirectX, Windows Core File system manager, SQL Server 2005 and Windows kernel, and, open-source like Apache Tomcat, Eclipse, Firefox. Several versions of each system were used for a total of 28 datasets. On each version, 40 metrics were gathered. Concerning source code metrics, Zimmermann et al. used variables ranging from churn (i.e., added, deleted, and changed lines) to cyclomatic complexity. As project environments metrics, they take for example: the domain of the application, the company developing the project, the kind of user interface, the operating system used, the language used, the number of developers. For each metric, they computed median, maximum and standard deviation at project level. Their empirical study gave the following results: on 622 cross-predictions between project tested, only 3.5% of the couples can predict each other. For instance, some models for open-source software projects (Firefox, Tomcat, Eclipse,...) are strong predictors for some closed-source projects but do not predict the other open-source projects. Some other open-source projects cannot be predicted by any of the models in their study. On the closed-source side, they found models for some projects such as File System that can predict some other closed-source projects. However, they also found models for some projects such as Internet Explorer, Windows Kernel, and DirectX that do not predict other projects. There is no way to know in advance which project’s model can predict the other projects. Piggot and Amrit [2013] used open-source software to predict project success. Within the 38 variables analyzed, numerical metrics such as the number of download, of developers or posts in forum better explain success than time-invariant metrics such as license used or the operating system supported. They succeeded to obtain an accuracy of 40% with an exact classification. Debari et al. [2008] concluded that success is helped when the project team does not use new technology for a project and when the customer is well involved in the requirement specifications. For Verner et al. [2007], project success is linked to the proper elicitation of the requirements and the accuracy of project cost estimation deduced from these requirements. Success is also acquired by managing correctly the exits of project developers and by avoiding to add new developers too late (e.g., to meet an aggressive schedule). Cerpa et al. [2016] concluded that what makes the project success is: good working atmosphere for the developers, good communication inside the team and with the customer, good requirements definition, and good staffing management. The working environment has also an impact on the project success. Wohlin and Andrews [2005] found key success drivers to identify similar projects. The authors concluded that it is a challenge to identify similar projects to predict success of new projects. The perception of the impact of a variable on the predic-. © 2017 Tous droits réservés.. lilliad.univ-lille.fr.
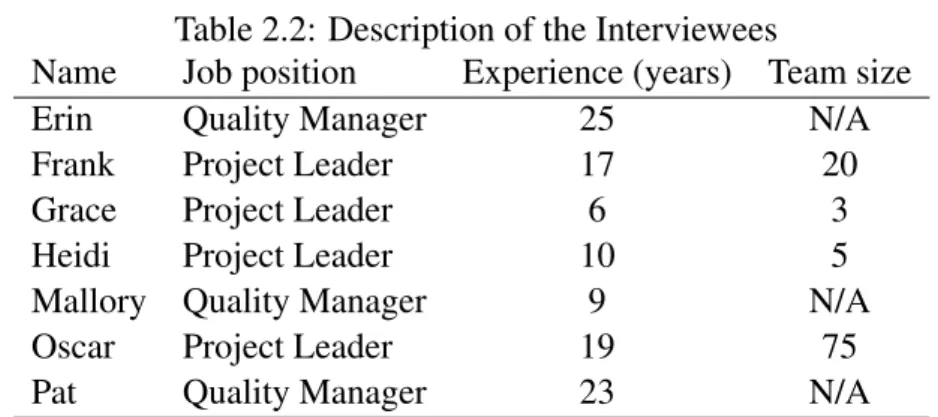
(28) Thèse de Vincent Blondeau, Lille 1, 2017. 12. Chapter 2. Motivation. tion model may change over time: the first projects considered for prediction may have to be re-evaluated to ensure that the model keeps a good precision. 1.1.3. Summary. None of these studies is very encouraging. Some of these studies show that it is possible to create a statistical model from one project and have good results by applying it to another project, but they have no way to know in advance if it is going to work. Each study has its own model (adapted to its context) to predict the success or the failure of the projects. And, each model relies on its own metrics set, even if some metrics can appear in several models. So, finding a set of metrics that can be applied to any project seems unlikely. Development environments between companies and open-source are different. One is driven by the money and the time, the other is more independent. Moreover, picking the right set of metrics is a major concern. Many metrics exist around projects and depending on the environment, they could be inadequate. We decided to make our own experiment with the company data and metrics.. 1.2. Data mining. 1.2.1. Methodology. To find what data would be good candidates for our project health predictor, we interrogated seven project leaders on how they manage projects. This was done through unstructured interviews. Each participant is briefly described in Table 2.2 where names are fictitious. The population for the survey was Project leaders and Quality managers of Worldline: they have a high level view on how the projects they supervise are managed. Project leaders manage the project team and distribute the tasks among its members; Quality managers ensure that the projects follow their process. Quality managers have not a fixed team and can be allocated to any project in Worldline. We had difficulties to find participants for the interviews, but succeeded in finding people from several Business Units (BU) of the company. A business unit is a group of several project teams working in the same business sector. There are three Business Units in Worldline: Merchants Services, Financial Services, and Mobility and e-Transactional Services. Considering the small number of participants and the very specific purpose of the interviews (discover information on possible predictors available for the projects), we did not see a need for a formal analysis of the interviews result. There is no standardized form to log project information through the company. However, we found in one business unit some standardized Excel files logging. © 2017 Tous droits réservés.. lilliad.univ-lille.fr.
(29) Thèse de Vincent Blondeau, Lille 1, 2017. 1. Predicting the Health of a Project. 13. Table 2.2: Description of the Interviewees Name Job position Experience (years) Team size Erin Quality Manager 25 N/A Frank Project Leader 17 20 Grace Project Leader 6 3 Heidi Project Leader 10 5 Mallory Quality Manager 9 N/A Oscar Project Leader 19 75 Pat Quality Manager 23 N/A. business information that we analyzed (see the metrics list below). These projects follow the same development process. Monthly, project leaders fill Excel sheets containing information on their project, bugs encountered, budget already spent, and budget remaining for the rest of the project. Some of the sheets are not filled correctly, because no automatic validity check is made. For instance, the budget or the number of bugs reported can be erroneous. The project can still be in a build phase, e.g., not delivered to the client. In this case, the number of post release bugs is not set in the sheet, then we decided to discard the Excel file of this project. It was the case for around half of the projects. We used an Excel parser to convert Excel data into a Moose1 model. Moose is a Pharo2 based extensive platform for software and data analysis. This platform, based on meta-modeling principles, offers multiple services ranging from importing and parsing data, to modeling, measuring, querying, mining, and building interactive and visual analysis tools. The usefulness of such a model is to standardize the data and make it accessible in one place. Once the data are modelised thanks to Moose, we conduct the statistical analysis with R3 . R is an open-source platform to apply statistics tools and algorithms on a large set of data. It is widely used by statisticians to perform data analysis. In the Excel sheets, we have 12 project metrics available for each month: Bugs recorded and categorized in terms of: Seriousness: critical, major, minor. A critical bug impedes the usage of a functionality of the application whereas a minor bug can be a misplaced button in the user interface. A major bug is in between. Testing phases: qualification, acceptance, or production steps. These metrics correspond to the number of bugs found in each phase. The qualifi1. Bhatti et al. [2012] Black et al. [2009] 3 R Core Team [2013] 2. © 2017 Tous droits réservés.. lilliad.univ-lille.fr.
(30) Thèse de Vincent Blondeau, Lille 1, 2017. 14. Chapter 2. Motivation. cation testing phase is done by the company employees while the other steps are led by the client. The production testing is realized in real conditions with the end-users. Budget: We found two metrics related to it: Predicted project budget: It is the budget (in man-days) set at the beginning of the project. For each month an estimate of the budget is done depending on the progress of the project and the number of developers working on it during the month. Realized project budget: It is the budget effectively spent during the month on the project. It is known only at the end of the month, whereas the predicted project budget is determined at the beginning of the month. Slippage: Two metrics to characterize it: Delta between predicted and realized budget: (man-days of slippage). It measures the number of man-days that the project deviates in the month. Whether there is slippage or no slippage: There is slippage when the project has at least one month in slippage. Number of months in slippage: number of months in the project where there is slippage. If the value is positive, the project has lost days during this month, else it has “saved” some days. Project name length: It is the number of characters in the project name. It is intended as a “placebo” metric. We compare all results to this metric to see if they can give a better result. From this data, we computed the following metric: Delta between the number of qualification and acceptance bugs: For the experiment, we compute this metric as a difference between the number of qualification bugs (company employees testing) and the number of acceptance bugs (client testing). As the qualification and acceptance tests aren’t made by the people of the same company, we expect a delta between both values. If the delta is positive, there are more qualification bugs, which is good because it is the project team and not the client who found the bugs. If the delta is negative, more acceptance bugs are found than qualification ones. This will be damaging for the project because of the decrease of the client confidence. We also added the number of intermediate releases in a project. Projects are split in releases. They represent a milestone in the development of the application. We expect that these milestones may work as “small projects”, making the whole project easier to manage and anticipate potential slippage. As project leaders consider slippage as the most important metric to assess the health of their projects, we used the three metrics related to it. We decided to compare slippage metrics to metrics related to bug number and budget data.. © 2017 Tous droits réservés.. lilliad.univ-lille.fr.
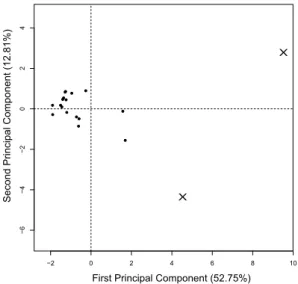
(31) Thèse de Vincent Blondeau, Lille 1, 2017. 1. Predicting the Health of a Project 1.2.2. 15. Data Filtering. We used data from 44 projects from 2012 to 2015 to analyze their correlation with slippage. Unfortunately, earlier data were not available. Indeed, normalization of project monitoring has been adopted recently in the department of Worldline where this data were extracted. Each month, a file is created for each project. Due to the various durations of the projects 1 076 files are available. Each file recalls the data of the previous months since the beginning of the year. So, the December files are enough to get all data for a year. Moreover, data are not complete for more than half of the projects. Consequently, we mined 91 files corresponding to 19 projects. By the value of their metrics, several projects can have a great influence on the sample. These outliers have to be identified then removed. Statistical methods advise to take out these kinds of extreme values to have a better sample to analyze. We carried a Principal Component Analysis (PCA) to identify these outliers. The PCA algorithm extracts from the initial variables, principal components. Principal components are linearly uncorrelated variables and represents concisely the initial set of variables. The benefit of this analysis is to identify groups of variables and which one are related to the slippage metrics. Figure 2.1, shows the impact of each individual (project) of the sample on the two first components, i.e., it is the linear projection of the individual on the two components. The first principal component is put on the abscissa and the second on the ordinate. Each point or cross is the projection of the metrics of a project on the two first principal components. In this way, we can determine the outliers. As shown, the two projects represented by crosses are far from the other projects (at the left of the figure). They are the extreme values. We ignored these projects in our study. 1.2.3. Correlation Matrix Results. To have a first intuition, we correlate all metrics described in section 1.2 whose principal characteristics are detailed in Table 2.3. Figure 2.2 is a correlation matrix of all metrics we analyzed. The crossing of one column and one row shows the correlation value between both variables. It highlights whether there is a linear dependency between 2 variables. If the value is close to 1 or -1, the variables are correlated. In this case, it is likely that the evolution of one will impact the other. The variables are independent if the values are close to 0. The value is negative if variables are correlated but evolve in opposite directions, this kind of correlation is represented by a minus in the cell. As the sample of project is small, we use the Spearman correlation. On the matrix, a lighter colored cell means that the correlation is closer to 0 (no correlation), a darker. © 2017 Tous droits réservés.. lilliad.univ-lille.fr.
(32) Thèse de Vincent Blondeau, Lille 1, 2017. 4. Chapter 2. Motivation. 0. 2. X. ● ● ●●● ● ●● ● ●. ●. ●. ●● ●. −4. −2. ●. X. −6. Second Principal Component (12.81%). 16. −2. 0. 2. 4. 6. 8. 10. First Principal Component (52.75%). Figure 2.1: Projection of the project metrics on the first and the second principal components. Table 2.3: Statistical summary of the metrics used for the analysis Metric Min Mean Median Max # Qualification bugs 0 20.3 4.0 81 # Acceptance bugs 0 18.3 1 193 # Production bugs 0 8.1 0 120 # Critical bugs 0 12.4 3 101 # Major bugs 0 17.5 11 92 # Minor bugs 0 16.9 7 81 # Total bugs 0 46 25 274 ∆ Qualif. & accept. -112 1.9 0 55 Predicted project budget 31 881 411 4700 Realized project budget 63 947 432 5210 # Months in slippage 0 38.9 34 80 # Man-days of slippage -60 65.8 32 510 # Intermediate releases 6 18.7 18 31 Project name length 6 18.9 19 32. © 2017 Tous droits réservés.. lilliad.univ-lille.fr.
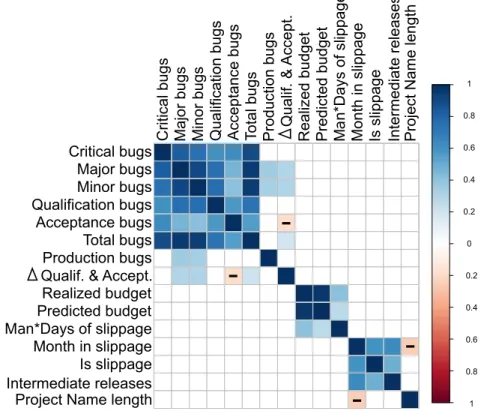
(33) Thèse de Vincent Blondeau, Lille 1, 2017. 1. Predicting the Health of a Project. 17. Critical bugs Major bugs Minor bugs Qualification bugs Acceptance bugs Total bugs Production bugs Qualif. & Accept. Realized budget Predicted budget Man*Days of slippage Month in slippage Is slippage Intermediate releases Project Name length. colored one is closer to 1 or −1 (correlation). The correlation values are detailed in Figure A.1 of Appendix A.. Critical bugs Major bugs Minor bugs Qualification bugs Acceptance bugs Total bugs Production bugs Qualif. & Accept. Realized budget Predicted budget Man*Days of slippage Month in slippage Is slippage Intermediate releases Project Name length. 1. 0.8. 0.6. 0.4. 0.2. -. 0. -. 0.2. ✂. 0.4. ✂. -. 0.6. ✂. 0.8. ✂. -. ✂. 1. Figure 2.2: Correlation matrix between each metric of the sample. This matrix shows three blocks of correlated variables. First, we can infer a strong correlation between all kind of bugs (the darker square at the top left of the matrix) except the number of bugs in production. These bugs are not strongly correlated to the others. The metric representing the delta between the qualification and acceptance bugs is lightly correlated to the other ones. The correlation is not strong enough to be considered (between −0.19 and 0.30). Second, we can also see, in the middle block, correlations between the budget variables: the realized budget and the predicted budget. The number of man-days between the initial and final budget is also not correlated to the slippage ones but correlated to the budget metrics. This last correlation might be due to the fact that the bigger a project is, the more difficult it is to predict the budget. A long project is more likely subject to deviations. Third, it seems also that two slippage metrics (number of month in slippage and if there is slippage or not) are significantly correlated together. The other, the man-days of slippage, is not linked to the others. However, the number of. © 2017 Tous droits réservés.. lilliad.univ-lille.fr.
(34) Thèse de Vincent Blondeau, Lille 1, 2017. 18. Chapter 2. Motivation. intermediate releases is correlated to these slippage metrics. If more intermediate releases are present in the project, the more slippage there is on the project. It might be the decomposition in group of functionalities that is difficult to determine by the project managers. Finally, our placebo metric is not correlated to the number of months in slippage (−0.25) according to Hopkins’ guidelines [Hopkins, 1997]. The opposite would have been intriguing or even alarming. However, as shown by the matrix, there is no link between the 3 groups of variables i.e., the bugs, the budget, and the slippage. In the light of this analysis, we can conclude that there is no link between the slippage and any other studied variable. 1.2.4. PCA Analysis Results. PCA describes more finely the data of the sample than the correlation matrix, in the way that it discovers the internal relationships of the variable. Figure 2.3 displays its result. On the two axes, the first principal component follows the abscissa and the second the ordinate. The abscissa aggregates non-production bug metrics, the ordinate aggregates slippage metrics. Each arrow represents a variable, the longer the arrow the more this variable is correlated to these two principal components. If the arrow is in the same direction of a principal component, e.g., the first component and the arrow representing the number of critical bugs, both variables are correlated. On the contrary, if the arrow is orthogonal to the component, the variable represented by the arrow is not correlated to the component, e.g., the bug component and the number of slipping months. For exploratory studies, the normality of the distribution is not required for the PCA. Furthermore, we do not use the PCA results to perform statistical tests [Jolliffe, 1986]. Therefore, we do not need to check that our data are normally distributed. In our analysis, the first principal component synthesize 43.41% of the variability of the sample and the second 17.51%. It means that almost 60% of the variability of the sample is summarized by these two principal components, i.e., by a linear combination of these two variables, we are able to retrieve 60% of the original data. The PCA defines four groups of metrics. First, we have the metrics linked to the bugs at the right of Figure 2.3: Critical bugs, Major bugs, Acceptance bugs, Total number of bugs, Qualification bugs, Minor bugs, and Delta between the number of qualification bugs and acceptance bugs (this latest variable is negatively correlated to the others). Second, Months in slippage, Is slippage, Intermediate releases, and Production. © 2017 Tous droits réservés.. lilliad.univ-lille.fr.
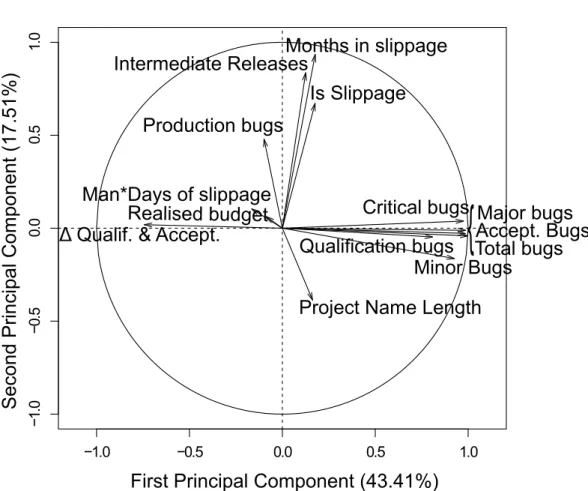
(35) Thèse de Vincent Blondeau, Lille 1, 2017. 19. Months in slippage Intermediate Releases Is Slippage. Man*Days of slippage endOfProjectBudgetGap endOfProjectBudgetGap Realised budget Qualif. & Accept.. Critical bugs Major bugs bugsCritical Accept. Bugs Qualification bugs Total bugs Minor Bugs. {. Project Name Length. −0.5. 0.0. 0.5. Production bugs. −1.0. Second Principal Component (17.51%). 1.0. 1. Predicting the Health of a Project. −1.0. −0.5. 0.0. 0.5. 1.0. First Principal Component (43.41%). Figure 2.3: Impact of each metric on the sample. © 2017 Tous droits réservés.. lilliad.univ-lille.fr.
(36) Thèse de Vincent Blondeau, Lille 1, 2017. 20. Chapter 2. Motivation. bugs variables constitute another group. Despite Production bugs variable is in this group, it is less correlated with the others. Production bugs are bugs revealed by the final customer. A possible explanation, is that if the project is already in slippage, developers are hurried to make the final release, they bypass the best practices, and do not test completely their application. Some bugs are consequently revealed in production. As the PCA shows a finer representation of the data than the correlation matrix, it is possible that a low correlation on the PCA does not appear on the correlation matrix. For example, the relation between the production bugs and the months in slippage are not revealed in the correlation matrix, but is revealed in the PCA. Third group of metrics, we have the project name length. It is negatively correlated to the slipping metrics. So the shorter the project name is, the more slippage it had. It is alone in its group. Fourth group of metrics, we can suppose that the two other variables representing the budget (Budget realized, and Delta between predicted and realized budget) make a group of the non-influential variables. The arrows related to these metrics are short on the representation. As we have the metrics on the intermediate releases, we conducted the same experiment. In the Excel files, only 59 can be used for analysis among the 720. Actually, it is more difficult to get all the metrics for the intermediate releases because the proper filling of the Excel sheets is more complex. After removing outliers, we found the same results than with the complete projects. To summarize, the correlations we found are quite trivial. Like the papers from the literature survey, we were not able to link the bugs and the budget metrics we used with the slippage metric, considered as an indicator of project health.. 1.3. Interviews. As the data analysis and literature review did not show any significant link between project health and project metrics, we conducted four unstructured interviews with experienced project leaders of the company. Frank, Grace, Heidi, and Mallory from the first interviews (see Table 2.2) accepted to answer our questions again. They come from different business units, which allow us to get several points of view on the company. The interviewees gave their feeling on what impacts project health, i.e., success or failure, what are their problems during project development, how they detect them and how they resolve them. Each interview lasted one hour and was decomposed in two parts. First, we presented briefly the research topic and the context of the study to the interviewee. Second, in an open discussion, we tried to acquire and understand the managers’ experience on their project successes and failures. Considering the very small num-. © 2017 Tous droits réservés.. lilliad.univ-lille.fr.
(37) Thèse de Vincent Blondeau, Lille 1, 2017. 1. Predicting the Health of a Project. 21. ber of interviews (four), we did not see the need to apply a formal synthesis of their answers. In these interviews, we identified the following root causes of project failure: Delay at the beginning of the project: if the client decides to begin the project later, the project team is ready to work but is not paid by the client. Consequently, the company spends money and the relationship with the client will deteriorate. Lack of collaboration between the team and the client: if the team and the client do not know each other well, the collaboration will be difficult and the project is more likely to fail. Absence of team cohesion: if the members of the project team do not support each other, the cohesion is weaker and the project has significantly more chance to fail. Misunderstanding the specifications: if the project team does not understand what the client says and fails to transcribe it in his own technical language, the project will progress with difficulty. Lack of domain knowledge: if the project team does not know the “language” of the client, the project has more chances to fail. Change of the framework during the development: if the technical tools or the framework, that the project team uses, change, it will cost more to the project. Lack of experience with the used frameworks: a team without experience on tools or frameworks will be not capable of moving the project faster. Bypass the qualification tests: if the team does not test its application before delivery to the client, the client will be unhappy because some functionalities will not work and some tension in the project team will appear. As a consequence, the client will find more bugs in the application. These root causes cannot be mined in project artefacts.. 1.4. Conclusion. We conducted a study to check whether software metrics can be related to project failure. The study of literature shows that the metrics extracted from a project cannot be used on another one. The mining of data we have done on company’s projects showed no link between project success and data. Moreover, the interviews we conducted shows that the metrics linked to success cannot be found by mining project data. As all these studies intervene a posteriori on projects, it seems random for a new project to know which metric or set of metrics could be used to assess success. Predictive analysis will not work well if it is not possible to know a priori which statistical model to use. In this case, there is no utility at all to mine them to predict the health of a project.. © 2017 Tous droits réservés.. lilliad.univ-lille.fr.
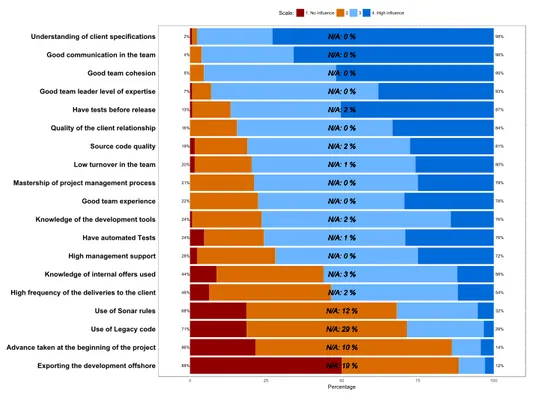
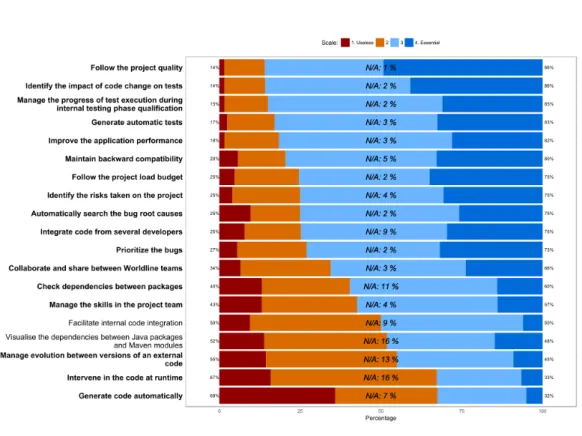
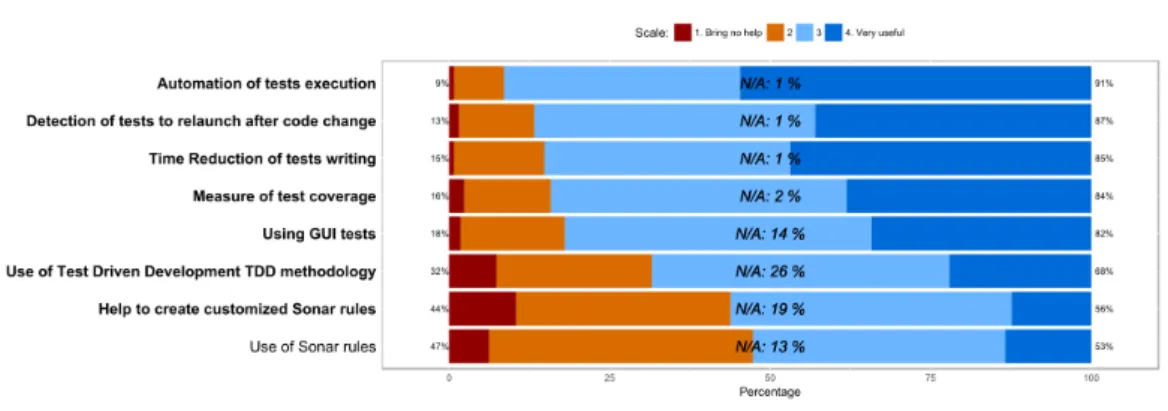
(38) Thèse de Vincent Blondeau, Lille 1, 2017. 22. Chapter 2. Motivation. Moreover, thanks to the interviews we made, we extracted some topics that are of interest for the project leaders of Worldline: communication, external frameworks, software quality, and tests. To generalize the results of these interviews from four project leaders to all the project members of Worldline, we made a large survey to obtain Worldline’s project members insight on project quality.. 2. Developers Insight on Project Quality. To get a better point of view on the feelings of the project members about project failure and success root causes, we made a survey for developers, team managers, and architects of Worldline France. Everyday, they are confronting the same problems, loosing time trying to solve them, with or without success. If a generalization can be made, then solving the problem will be interesting for the company in terms of cost savings and wellbeing of the employees. As health of the project is still an essential factor for Worldline, we focused the survey on the factors that influence the health of the project we discovered previously.. 2.1. Survey Description. The participation to the survey is on voluntary basis. To make project members of Worldline answering it, we sent mails to more than 1000 project members and posted on the company social network. We also sent a reminder on both media one month after the first sent and succeed to have 131 project members that anonymously answered to the poll. With 11 questions, the survey took 15-20 minutes to be filled. Questions have been first tried on several beta testers to be sure that they are correctly formulated and understandable, and, conclusions can be draw from the answer. In this survey of 11 questions, seven are focused on the health of the project (the items for each question can be found in the related Figure): i. On a daily basis, on which criteria do you base yourself to assess the health of your project? (Figure 2.4) ii. For you, what are the items that are contributing to project success? (Figure 2.5) iii. Which actions should be taken to improve project health? (Figure 2.6) iv. What items are contributing to project failure? (Figure 2.7) v. What are you expecting of a tool that could help you to improve project health? (Figure 2.8). © 2017 Tous droits réservés.. lilliad.univ-lille.fr.
(39) Thèse de Vincent Blondeau, Lille 1, 2017. 2. Developers Insight on Project Quality. 23. vi. Which items block you from doing automated tests? (Figure 2.9) vii. Regarding tests and software quality, which items can help you in the improvement of your project? (Figure 2.10) The four others questions describe the respondents in the purpose to cross data: company department, responsibilities, years of experience, years of experience inside the company. The first seven questions are based on a likert scale. For each of these questions, several affirmations are given and the respondents must answer his agreement or not in a scale to define his feeling. The scale specifies several answers to a given affirmation: e.g., strongly disagree, disagree, agree, strongly agree. Moreover, we choose likert scales with an even number of answers. It forces the respondents to have a distinct opinion and to make his mind on one side: agree or disagree. For each question, the respondents is able to answer “NA” if the question is “Not applicable" or if it does not want to give an answer (“No Answer”). Also, each question can be commented to give an other option or opinion.. 2.2. Results. For each question, we focus only on the three or four items with the highest score. Consequently, others conclusions that could be drawn from this survey will not be explained nor studied here. 2.2.1. On a Daily Basis, on Which Criteria do you Base Yourself to Assess the Health of a Project?. It seems that being ahead of time on the schedule is at least an important criteria to measure the health of a project for 93% of the respondents (see Figure 2.4). The relation with the client comes in second place with 86% that think it is an important criterion. In third position comes the software quality with 84%. Fourth is the number of bugs detected in customer acceptance with 81%. The bugs detected in customer acceptance are bugs that should be avoided by the developers. They give a low opinion of the project team to the client and can damage the relation between them. A high number of bugs in customer acceptance shows a lack of quality in the software. The interviews of our previous study concluded that a root cause of the failure of the project is the high number of bugs listed by the clients. This survey confirms this first intuition. While we are not able to manage the relation with the client in this study, reducing the number of bugs seems to be obtainable by helping the developers to check their application before releasing to the client.. © 2017 Tous droits réservés.. lilliad.univ-lille.fr.
Figure
+7


Documents relatifs
Specialty section: This article was submitted to Pediatric Infectious Diseases, a section of the journal Frontiers in Pediatrics Received: 21 December 2019 Accepted: 03 April
On constants related to the choice of the local time at 0, and the corresponding Itô measure for Bessel processes with dimension d=2(1-alpha), 0 < alpha < 1... On
The optical properties of spinel oxide thin films show two strong absorption bands for each composition at the UV front and close to 700 nm in wavelength. Direct bands gaps
Therefore, a study of the hydrodynamic conditions during the mixing of precursors and control of the physical and chemical characteristics of the envi- ronment (dilution,
Grossissement de filtrations : exemples et applications (S´eminaire de Calcul Stochastique, Paris 1982/83), volume 1118 of Lecture Notes in Math.. Some probabilistic properties
