A THESIS SUBMITTED TO
THE UNIVERSITY OF QUEBEC AT CHICOUTIMI IN PARTIAL FULFILMENT OF THE REQUIREMENTS
FOR THE DEGREE OF MASTERS IN ENGINEERING
by
SENA ÖZTÜRK
IMPROVEMENT OF ANODE PROPERTIES BY COKE MODIFICATION WITH ADDITIVES
MÉMOIRE PRÉSENTÉ À
L’UNIVERSITÉ DU QUÉBEC À CHICOUTIMI COMME EXIGENCE PARTIELLE DE LA MAITRISE EN INGÉNIERIE
par
SENA ÖZTÜRK
AMÉLIORATION DES PROPRIÉTÉS D’ANODES VIA LA MODIFICATION DE COKE AVEC DES ADDITIFS
Abstract
In aluminum production, carbon anodes that are made of petroleum coke, coal tar pitch and recycled carbon materials are used to provide carbon required for the electrolysis process. The anode quality directly affects not only the energy consumption and the production cost but also the emission of greenhouse gases. The raw materials quality has a significant effect on anode quality. The good quality anodes should have high density, low electrical resistivity, low air/CO2 reactivity as well as good mechanical properties.
Pitch binds the solid particles together. The quality of raw materials can change depending on its source and the processes parameters used in the refineries. However, industry still has to produce good quality anodes. In general, good coke/pitch interaction results in better quality anodes. This study was undertaken to enhance the wettability of coke by pitch, with the objective of improving the anode properties, based on coke modification by adding additives and surfactants and to determine the effect of additives on anode quality.
The results showed that the wettability of coke by pitch is dependent on the heteroatom containing functional groups present on the coke surface. The interaction between coke and pitch increases with increasing amount of heteroatom-containing functional groups. Thus, it is possible to improve the anode quality by modifying coke with additives.
The study indicated that different cokes have different amounts of functional groups. Therefore, each coke has a different wetting behavior. It was found that, before modifying a coke, its surface chemistry should be taken into account for the determination of suitable additive type and amount. The surface functional groups of
pitch are as important as those of the coke, however, this is outside the scope of this project.
In this study, the effect of the contact time between the additive and the coke on the anode quality was also investigated, and a coke modification method was developed. Based on the experimental results, the anode quality improved more when the coke was pre-treated before it was mixed with pitch.
Résumé
Dans la production de l’aluminium, les anodes de carbone qui consistent en coke de pétrole, brai de goudron de houille et matériaux carbonés recycles fournissent le carbone requis pour le procédé d’électrolyse. La qualité des anodes affecte directement non seulement la consommation énergétique et le coût de production, mais aussi l’émission des gaz à effet de serre. La qualité des matières premières a un impact considérable sur la qualité des anodes. Les anodes de bonne qualité doivent avoir de haute densité, de basse résistivité électrique, de basse réactivité à l’air et au CO2 et de bonnes propriétés mécaniques. Le brai lie les particules solides ensemble. La qualité des matières premières peut varier dépendant de sa source et des paramètres des procédés utilisés dans les raffineries. Néanmoins, l’industrie doit produire des anodes de bonne qualité. En général, des fortes interactions entre le coke et le brai résultent en des anodes de meilleure qualité. Cette étude a été entreprise pour accroître la mouillabilité du coke par le brai, pour but d’améliorer les propriétés d’anodes, en modifiant le coke par l’ajout d’un additif ou un tensioactif et aussi pour déterminer les effets de l’ajout des additifs sur la qualité des anodes.
Les résultats ont démontré que la mouillabilité du coke par le brai dépende des groupes fonctionnels, présents sur la surface du coke, qui contiennent des hétéroatomes L’interaction entre le coke et le brai augmente avec la quantité des groupes fonctionnels contenant des hétéroatomes. Donc, il est possible d’améliorer la qualité des anodes en modifiant le coke par des additifs.
Cette étude a indiqué que les différents cokes ont des quantités différentes des groupes fonctionnels. Donc, chaque coke a un comportement de mouillabilité différent. On a trouvé que, avant de modifier un coke, sa chimie surfacique doit être considérer pour la
détermination du type et de la qualité appropriés de l’additif. Les groupes fonctionnels du brai sont aussi importants que ceux du coke, mais cela n’est pas inclus dans la portée de ce projet.
Dans cette étude, l’effet du temps de contact entre l’additif et le coke sur la qualité d’anodes est aussi examiné, et une méthode pour la modification de coke a été développée. Basé sur les résultats expérimentaux, la qualité de l’anode a amélioré plus lorsque le coke a été prétraité avant de le mélanger avec le brai.
Acknowledgment
First, I would like to thank my supervisor Prof. Duygu Kocaefe for her continuous support during my master study, for her patience, kindness and great knowledge. Her door was always open whenever I had a personal problem or had a question related to my research. She consistently allowed this project to be my own work and steered me in the right direction whenever I needed. I would like to thank her very much for her support and understanding.
I would also like to express my sincere gratitude to my co-director Prof. Dipankar Bhattacharyay for his significant contribution to my research ability and this project. I could not have imagined having a better advisor and mentor for my master study. Without his assistance and dedicated involvement in every step throughout the process, this thesis would have never been accomplished. His teaching style and enthusiasm for the project made a strong impression on me and I will always carry positive memories of my experience.
I would like to convey my thanks to Prof Yasar Kocaefe for his valuable comments and encouragement as well as the contributions to widen my research from various perspectives.
The financial support received from the Natural Sciences and Engineering Research Council of Canada (NSERC), the University of Quebec at Chicoutimi (UQAC) and the Foundation of the University of Quebec at Chicoutimi (FUQAC) is greatly appreciated. I would like to thank our talented technician Mr. Dave Girard who always assisted me with his kindness, patience as well as his knowledge, for his help and support during all the stages of my experiments.
I would like to express my love and deep gratitude to my parents and my brother for all their continuous support, love, encouragement and faith in me to make my dreams a reality. None of this could have happened without my family.
I would also like to thank my friends Betul Avcuoglu, Berk Dilek, Seckin Sezgin, Neslisah Bal and Pinar Erden for listening to and, at times, having to tolerate me over the past two years. My gratitude and appreciation for their friendship cannot be expressed. Many thanks are also due to all my friends and colleagues (Anil Arici, Ying Lu, Houssemmeddine Feriani, Pierre-Luc Girard, Amr Hayyani, Adam Chehouri, Joanie Laplume Wallid Kallel, Belkacem Amara, Julie Bureau etc.) for their kind support, friendship and help. I would also like to thank Xavier Baril-Boudreault who opened both his home and heart to me when I first arrived to Canada. I considered his home as my second home in Canada.
Finally, I would like to thank my lovely friend Kaan Berki Karabay for his endless support, patience, tolerance and encouragement from the beginning of my study. Every time I was ready to quit, he did not let me and I am forever grateful.
Table of Contents
Abstract ... i
Résumé ... iii
Acknowledgment ... v
List of Figures ... x
List of Tables ... xiii
List of Abbreviations and Symbols... xiv
CHAPTER 1 ... 1 INTRODUCTION ... 1 1.1. Background ... 1 1.2. Statement of Problem ... 2 1.3. Objectives ... 3 1.4. Methodology ... 4 1.5. Scope ... 6 CHAPTER 2 ... 8 LITERATURE REVIEW ... 8 2.1. Anode Properties ... 8 2.1.1. Density ... 10 2.1.2. Electrical Resistivity ... 10 2.1.3. Air/CO2 Reactivity ... 11 2.1.4. Mechanical Properties ... 12
2.2. Raw Materials Properties ... 13
2.2.1. Petroleum Coke ... 13
2.2.2. Coal Tar Pitch ... 14
2.2.3. Anode Butts ... 15
2.3. Wettability of Coke by Pitch ... 15
2.3.1. Modification of Pitch ... 18
2.3.2. Modification of Coke ... 20
CHAPTER 3 ... 24
EXPERIMENTAL ... 24
3.1. Characterization of Raw Materials ... 24
3.1.1. Modification of Coke with Additives for Characterizations ... 24
3.1.2. Fourier Transform Infrared Spectroscopy (FT-IR) ... 25
3.1.3. Wettability ... 26
3.1.4. Tapped Bulk Density ... 28
3.2. Preparation of Laboratory Scale Anodes ... 29
3.2.1. Dry Aggregate Preparation ... 29
3.2.2. Modification of Dry Aggregate with an Additive for Anode Production .... 29
3.2.3. Mixing ... 29
3.2.4. Vibrocompaction ... 30
3.3. Characterization of Laboratory Scale Anodes ... 31
3.3.1. Sample Preparation ... 32
3.3.2. Apparent Density ... 33
3.3.3. Electrical Resistivity ... 33
3.3.4. Air and CO2 Reactivities ... 34
3.3.5. Flexural Strength ... 36
CHAPTER 4 ... 38
MODIFICATION OF COKE BY DIFFERENT ADDITIVES TO IMPROVE ANODE PROPERTIES ... 38
4.1. Introduction ... 39
4.2. Experimental ... 42
4.2.1. Material Used ... 42
4.2.2. Modification of Calcined Coke with Additive ... 43
4.2.3. Sample Characterization ... 45
4.2.4. Fabrication of Laboratory Anodes ... 46
4.2.5. Characterization of Anode Properties... 47
4.3. Results and Discussions ... 49
4.3.1. FT-IR Results ... 49
4.3.2. Wettability ... 57
4.3.3. Effects of Additive on Anode Properties ... 60
4.4. Conclusions ... 64
CHAPTER 5 ... 66
MODIFICATION OF PETROLEUM COKE BY DIFFERENT ADDITIVES AND THE IMPACT ON ANODE PROPERTIES ... 66
5.1. Introduction ... 67
5.2. Experimental ... 70
5.2.1. Material Used ... 70
5.2.2. Modification of Calcined Coke/Aggregate with Additive ... 71
5.2.3. Sample Characterization ... 72
5.2.4. Fabrication of Laboratory Anodes ... 73
5.2.5. Characterization of Anode Properties... 74
5.3. Results and Discussions ... 75
5.3.1. FT-IR Results ... 75
5.3.2. Wettability Results ... 78
5.3.3. Effects of Additive on Anode Properties ... 80
5.4. Conclusions ... 83
CHAPTER 6 ... 84
EFFECT OF THE ADDITIVE CONCENTRATION ON THE MODIFICATION OF PETROLEUM COKE AND ANODE QUALITY ... 84
6.1. Introduction ... 85
6.2. Experimental ... 87
6.2.1. Material Used ... 87
6.2.2. Modification of Calcined Coke with Additive ... 88
6.2.4. Fabrication of Laboratory Anodes ... 90
6.2.5. Characterization of Anode Properties... 91
6.3. Results and Discussions ... 91
6.3.1. FT-IR Results ... 91
6.3.2. Wettability Results ... 94
6.3.3. Effects of Additive on Anode Properties ... 96
6.4. Conclusions ... 97
CHAPTER 7 ... 99
CONCLUSIONS AND RECOMMENDATIONS ... 99
7.1. Conclusions ... 99
7.2. Recommendations ... 100
REFERENCES ... 102
List of Figures
Figure 1.2: Schematic illustration of methodology... 4
Figure 2.1: Anode behavior in a reduction cell [2, 3] ... 12
Figure 2.2: Contact angle for a pitch drop on a coke bed ... 17
Figure 2.3: Variation of pitch-drop height with temperature for a) coal tar pitch (CTP-1), b) petroleum pitch (PP-1), c) petroleum pitch with an added surfactants (PP-1S) [35] ... 19
Figure 2.4: Variation of pitch-drop height with temperature for a) non-modified petroleum pitch, b) 5% wt of surfactant B added to petroleum pitch, c) 5% wt of surfactant C added to petroleum pitch, d) 5% wt of surfactant A added to petroleum pitch, e) 10% wt of surfactant A added to petroleum pitch, f) 15% wt of surfactant A added to petroleum pitch [41] ... 20
Figure 2.5: Dynamic contact angles of pitch 2 on three different cokes at 190°C [32].... 22
Figure 2.6: FT-IR spectra of petroleum coke with and without modification [36] ... 23
Figure 3.1: Modification steps of coke ... 25
Figure 3.2: Fourier Transfer Infrared Spectroscopy (FT-IR)... 26
Figure 3.3: Sessile-drop experimental set-up at UQAC ... 27
Figure 3.4: Tapped bulk density equipment at UQAC ... 29
Figure 3.5: Intensive mixer at UQAC ... 30
Figure 3.6: Vibro-compactor at UQAC ... 30
Figure 3.7: Baking furnace that is used for baking green anodes at UQAC ... 31
Figure 3.8: (a) Anode coring plan for anode characterization (b) Position of samples used for air/CO2 reactivity experiments ... 32
Figure 3.9: Electrical resistivity measurement setup for anode cores at UQAC ... 34
Figure 3.10: Thermogravimetric (TGA) analysis system for air/CO2 reactivity of anode core samples at UQAC... 36
Figure 3.11: Three-point bending test setup at UQAC ... 37
Figure 4.1: FT-IR spectra of non-modified coke and pitch ... 52
Figure 4.2: FT-IR analysis of total spectra of non-modified coke and pure additives ... 53
Figure 4.3: FT-IR analysis of cokes modified using different additives ... 55
Figure 4.4: Wettability results for non-modified coke and cokes modified with additives (a) A3 and A6, (b) A4 and A5 and (c) A1 and A2 ... 60
Figure 5.1: (a) Anode coring plan (b) Preparation of green anode cores (c) Anode samples used for reactivity tests ... 74
Figure 5.2: FT-IR analysis of four non-modified cokes ... 76
Figure 5.3: FT-IR analysis of four cokes modified using the additive ... 77
Figure 5.4: Wettability of non-modified cokes and cokes modified with additive ... 79
Figure 5.5: Relation between the contact angle and the area ratio at 200 s ... 80
Figure 5.6: Physical appearance of green anode cores (a) Standard anode (b) Anode produced with dry aggregate treated one day earlier (c) Anode produced with dry aggregate treated five minutes before mixing ... 82
Figure 6.1: FT-IR analysis of non-modified coke 1 and coke 1 modified using the additive (1% and 5%)... 93
Figure 6.2: FT-IR analysis of non-modified coke 2 and modified coke 2 by an additive (1% and 2%) ... 93
Figure 6.4: (a) The contact angle and (b) the penetration results for non-modified coke 1 and coke 1 modified using the additive (1% and 5%) ... 95 Figure 6.5: (a) The contact angle and (b) the penetration results for non-modified coke 2
List of Tables
Table 2.1: List of functional groups in green petroleum coke from FT-IR study ... 22
Table 4.1: Properties of the Additives ... 43
Table 4.2: List of functional groups in calcined coke from FT-IR study ... 50
Table 4.3: Ratios calculated from FT-IR results ... 57
Table 5.1: Area ratio determined from FT-IR results for four cokes ... 78
Table 5.2: Characterization results for different anodes ... 82
Table 6.1: Characterization results for anodes produced using coke 1 ... 96
Table 6.2: Characterization results for anodes produced using coke 2 ... 97
List of Abbreviations and Symbols
θ Contact angle (°)
γLV Interfacial tension of the liquid-vapor interface (mN/m)
γSV Interfacial tension of the solid-vapor interface (mN/m)
γSL Interfacial tension of the solid-liquid interface (mN/m)
V Volume (cm3) d Diameter (cm) W Weight (g) l Length (cm) D Density (g/cm3) I Current (A)
Fmax Maximum force (N)
ρ Resistivity (µΩm)
σ Flexural strength (N)
FT-IR Fourier transform infrared spectroscopy GAD Green anode density (g/cm3)
BAD Baked anode density (g/cm3)
GER Green anode electrical resistivity (µΩm) BER Baked anode electrical resistivity (µΩm)
CHAPTER 1
INTRODUCTION 1.1. Background
Aluminum, which has a low weight, good thermal and electrical conductivity and recyclability, is one of the most abundant materials on Earth. Aluminum is used in many sectors such as transport, electrical, construction and packaging because of its properties [1].
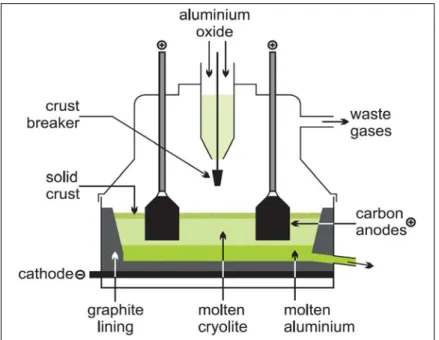
Alumina is obtained from bauxite after the process that involves milling, digestion, clarification, crystallization, and calcination. This process is called the Bayer process [2]. Aluminum is produced from alumina by the Hall-Héroult process using electrolysis shown in Figure 1.1. Alumina (Al2O3) is dissolved in a bath, which contains molten
cryolite (Na3AlF6) at about 960°C [2]. Carbon anodes are used as the carbon source in
aluminum production and also carry the electrical current to the cell. Different reactions occur at the anode and the cathode (see Equation 1.1, 1.2 and 1.3). The overall reaction is represented as alumina reacting with carbon anodes producing aluminum and CO2. In
order to produce one-ton aluminum, the theoretical amount of carbon required is 334 kg [1]. However, in practice 400 kg of carbon is used. Since carbon anodes are consumed during this process, it has to be replaced approximately every 14-28 days depending on the quality of anode and the technology.
𝐴𝐴𝐴𝐴 𝑎𝑎𝑛𝑛𝑛𝑛𝑛𝑛𝑛𝑛: 2 𝑂𝑂−2 + 𝐶𝐶 → 𝐶𝐶𝑂𝑂
2 + 4𝑛𝑛− (1.1)
𝐴𝐴𝐴𝐴 𝑐𝑐𝑎𝑎𝐴𝐴ℎ𝑛𝑛𝑛𝑛𝑛𝑛: 𝐴𝐴𝐴𝐴+3 + 3𝑛𝑛− → 𝐴𝐴𝐴𝐴 (1.2)
Figure 1.1: Schematic illustration of an electrolysis cell for aluminum production Aluminum is produced using the electrolysis process with carbon anodes, which consist of a mixture of calcined petroleum coke (60-70%), coal tar pitch (15-25%), and recycled materials (anode butts, green and baked rejects) [2]. The quality of anodes is an important parameter to consider in aluminum production. The good quality anodes should have high density, low electrical resistivity, low air and CO2 reactivities, and good mechanical
properties [2]. In order to manufacture good quality anodes, the coke and pitch must interact well with each other at the mixing stage. The affinity between these two components relies on good wetting properties. To obtain good wettability, pitch, as a binder, should penetrate into the coke particles. The wetting ability of a coke can be improved through its modification.
1.2. Statement of Problem
The carbon anodes play an important role since they provide carbon for the electrolysis reaction in aluminum production. For economical, effective and environment friendly
aluminum production, good quality carbon anodes should be fabricated. Carbon anodes are made of calcined petroleum coke and coal tar pitch, and the quality of the resulting anode is dependent on the raw material quality. Therefore, the properties of raw materials should be improved.
The calcined petroleum coke is one of the raw materials for carbon anodes, and its quality has a significant effect on anode properties. Coke and pitch are mixed in a mixer or kneader. Their interaction at the mixing stage has a great impact on the anode quality. The pitch, which is used as a binder, must penetrate into the coke particles to provide better interaction between these two components. Good interaction between coke and pitch requires good wetting properties. The surface tension must be reduced and the coke-pitch interaction should be increased in order to improve the wettability of coke by coke-pitch. Additives and surfactants can be used for this objective in order to create a bridge between coke and pitch.
1.3. Objectives
The main objectives of this study are to enhance the wettability of coke by pitch through the use of additives (surfactants or other chemicals) in order to improve the anode properties and to understand the underlying mechanism so that better quality anodes could be produced with the available raw materials.
The specific objectives are:
• to identify different functional groups on different cokes and pitch in order to determine which functional groups are more significant for the interaction between these raw materials,
• to modify the calcined coke with different additives so that the wettability of coke by pitch can be improved,
• to determine the difference between the non-modified and the modified coke (with different additives at different percentages) spectra,
• to determine the wettability of different cokes (non-modified and modified) by pitch using the sessile-drop technique,
• to analyze the effect of additive quantity on the wettability of different cokes by pitch,
• to improve coke-pitch interaction by modifying the coke with additive,
• to find the best contact time between the additive and the coke before producing anodes to enhance anode quality,
• to improve the anode properties such as density, electrical resistivity, air/CO2
reactivity, and flexural strength using the coke modified with an additive.
1.4. Methodology
Figure 1.2 shows the schematic of the methodology used in this work. The steps are explained below based on this figure.
• The functional groups of cokes, pitch, and the additives were analyzed by Fourier transform infrared spectroscopy (FT-IR).
• The cokes were modified by different additives to increase the aromatics and heteroatom-containing functional groups. Each additive was dissolved in a solvent before the coke treatment.
• The functional groups of the modified cokes were determined using FT-IR.
• The wettability of non-modified and modified cokes by pitch was studied using the sessile-drop method with a set-up present at the carbon laboratory of Chair CHIMI.
• Based on FT-IR and wettability results, the additive which improved the coke wettability most was chosen. The anodes were produced with the non-modified coke and the coke modified with the chosen additive.
• Two different methods were used to modify the coke for anode manufacturing. The effect of coke preparation conditions on anode properties was examined. • A standard anode using the non-modified coke and anodes using the coke
modified with different quantities of the chosen additive were produced under the same conditions. The effect of the additive amount on anode properties was studied.
• Anodes were characterized based on different properties such as green and baked density, green and baked electrical resistivity, flexural strength, air and CO2
1.5. Scope
In this study, improvement of the wettability of coke by pitch using different additives is investigated. FT-IR analysis was used in order to identify different functional groups in cokes (non-modified and modified), pitch, and different additives. Also, the wetting study was done so that the interaction between coke and pitch could be analyzed before and after the modification of coke by different additives. The results of the study are presented in Chapters 4 to 6 in the form of articles. The section, table, figure, equation and reference numbers in these chapters are different than those in the original articles. This modification was done so that the thesis is easier to follow for the reader.
The thesis consists of seven chapters. The introduction is given in Chapter 1, which includes the statement of the problem, the objectives, the general methodology, and the scope. Chapter 2 gives a detailed literature review on the properties of carbon anodes and raw materials as well as the previous studies reported on the modification of coke. Chapter 3 provides information on the methodology and the experimental systems used in this study. It also presents the detailed information on anode manufacturing steps as well as the characterization methods of coke (Fourier Transform Infrared Spectroscopy and Sessile-drop technique) and anode samples.
Chapter 4 presents the results and the discussion on the modification of one coke by six different additives and the anode produced with the best additive. The effect of different additives on the wettability of the coke by pitch was investigated with FT-IR and sessile-drop tests. Laboratory anodes were produced using the best additive. The anodes were characterized using different tests, and the effect of this additive on the properties of the anodes (density, electrical resistivity, air and CO2 reactivities and flexural strength) were
The results of the modification of four different cokes using the best additive above and the investigation on the method of modification are presented in Chapter 5. The effect of the additive on different cokes in terms of surface functional groups and wetting was studied. The best coke-pitch pair was chosen, and anodes were produced using this pair and varying the contact time between the additive and the coke during its modification to determine the impact on anode properties.
In Chapter 6, the focus is on the modification of two different cokes by the best additive at different concentrations. Anodes produced using these cokes were characterized (density, electrical resistivity, air/CO2 reactivity and flexural strength), and the results are
presented.
CHAPTER 2
LITERATURE REVIEW 2.1.Anode Properties
Anodes are used in electrolytic cell as the carbon source for aluminum production. Carbon reacts with oxygen coming from the electrolytic reaction; as a result of this reaction, aluminum and CO2 are produced (see Equation 1.3) [2]. Quality of anode
directly affects the quality of resulting aluminum, aluminum production cost, and the amount of greenhouse gases emitted.
In aluminum production, anode manufacturing is one of the most important steps in order to obtain good quality aluminum. There are four major steps to produce anodes: preparation of raw materials, mixing, compaction, and anode baking [2,3]. Each step has a significant effect on anode quality. Carbon anode contains calcined petroleum coke, coal tar pitch, and recycled materials (anode butts and green and baked rejects). Calcined petroleum coke (60-70%) and recycled materials (15-20%) are crushed to attain certain granulometry. These particles are called ‘dry aggregate’. The preparation of dry aggregate has a great impact on packing [4]. Good packing is the first step for good quality anode. The anode recipe is prepared using different fractions of different size coke particles. The medium size particles should fill the void space between the coarse particles, and the space between medium particles should be filled with fine particles. Fine particles (less than 1 mm) fill in the remaining space. If a large amount of fine particles are used in the recipe, the surface area of the recipe will be high. Higher surface area increases the required amount of pitch. Excess pitch causes more volatiles during baking, and it is costly.
The dry aggregate is preheated before mixing to prevent the solidification of pitch. The preheating temperature should be higher than the softening point of pitch. If the pitch stays solid, it cannot mix with the coke particles. Poor mixing (less wetting between coke and pitch) results in low quality anodes. The dry aggregate and the coal tar pitch are mixed at around 170°C-190°C [2]. The mixing temperature should be about 50°C higher than the pitch softening point to ensure the viscosity of the pitch. The adequate low viscosity of pitch allows not only filling of the void space between particles but also the penetration of pitch into the coke particles [2,3]. This provides good mixing and a homogeneous paste. Then, this paste is compacted by pressure molding or vibratory compaction. Vibration is used in the production of large sized anodes, and it is more suitable for aluminum industry. Vibration helps the particles thoroughly settle down to make a dense anode. Compaction of the paste results in the formation of green anodes. The green anode is cooled down below the pitch softening point using a cooling medium. In order to avoid the thermal shock, cooling should be neither fast nor slow. The final step of the process is baking. The green anodes are baked in the baking furnace at about 1100°C. The remaining space between the anodes and the furnace walls is filled with filler (calcined) coke. During baking, pitch carbonizes and binds the coke particles together. Several reactions take place during baking between coke and pitch such as polymerization, cracking, rearrangement and condensation [5,6]. The heating temperature and the heating rate have significant effect on resulting anode. If the heating is fast, the volatiles will be released rapidly. This creates pores and cracks, which increase the electrical resistivity and reactivity and reduce the density and mechanical properties of
anodes [7, 8]. After the heating, the anodes are cooled down before rodding and their consequent use in the cells.
2.1.1. Density
The high density is a desired property for a good quality anode. The density is related to anode life. Denser anodes provide longer anode life. The density of green anode is around 1.55-1.65 g/cm3 and the density of baked anode is 1.50-1.60 g/cm3 [2,9]. The density of anode is determined by dividing the weight by its volume.
The green density should be high to produce denser baked anodes [2,3]. Raw materials quality, mixing conditions (mixing temperature and mixing time), and forming conditions (compaction time and frequency of compaction) have a significant effect on the green density. The low green density means more porosity, which can create cracks during baking. The baked density also should be high. If the baked density is low, the electrical resistivity is high because of porosity. On the other hand, too high a baked anode density could cause thermal shock.
2.1.2. Electrical Resistivity
The electrical resistivity of anode is related to energy consumption. Decrease in electrical resistivity reduces the energy consumption (and cost) during aluminum production. Electrical resistivity depends on the coke properties, the density of anode, and the pores/cracks inside the anode. Generally, denser anodes have lower electrical resistivity since they have less porosity. The electrical resistivity of anode is around 50-60 µΩm [2,9-11]. The green electrical resistivity is not usually measured, but it is known that the electrical resistivity of green anode is much higher than the electrical resistivity of baked anode.
High electrical resistivity causes more energy consumption. On the other hand, low electrical resistivity means high thermal conductivity. If the thermal conductivity of anode is high, the top temperature of anode increases more and this can cause air burn problems because carbon reacts more with air at higher temperatures [2,3].
2.1.3. Air/CO2 Reactivity
Carbon anodes are consumed in the electrolytic cell during aluminum production by the reduction of alumina according to Equations 1.1- 1.3 [2]. Air can react with the carbon anode near the top of the anode, and it produces CO2 (see Equation 2.1). Carbon anode
not only reacts with air but also with CO2. Carbon dioxide, which is produced during
aluminum production, can react with the carbon anode and carbon monoxide forms as a result of this reaction (see Equation 2.2). There are three main reasons for excessive carbon consumption: air burn (air reactivity), carboxy attack (CO2 reactivity), and
selective oxidation (dusting) [3, 12, 13].
𝐶𝐶 + 𝑂𝑂2 → 𝐶𝐶𝑂𝑂2 (2.1)
𝐶𝐶𝑂𝑂2+ 𝐶𝐶 → 2𝐶𝐶𝑂𝑂 (2.2)
Air reactivity takes place on or near the top of the anode at around 500°C (see Figure 2.1). The impurities in anode such as sodium, nickel, vanadium accelerates the air burn reaction. On the other hand, sulfur acts as an inhibitor and reduces the air reactivity. The raw materials properties, baking temperature, and cell design have a significant effect on the air reactivity of anode. Unlike the air reactivity, CO2 reactivity takes place at the
bottom of the anode where CO2 forms as a result of the oxidation reaction at 960°C (see
Figure 2.1) [2]. It is also observed that the impurities in anode like sodium, calcium, and sulfur affect the CO2 reactivity [14-17]. CO2 reactivity is affected by the raw material
properties, the formulation of green anode, and the anode baking temperature. The selective oxidation, which is known as dusting, can be explained by the reactivity difference between coke and pitch [18]. Dusting causes physical loss of coke particles due to the loss of the integrity of the anode structure [2,3].
Figure 2.1: Anode behavior in a reduction cell [2, 3]
2.1.4. Mechanical Properties
Mechanical properties of anodes affect their handling and setting, and the rodding processes. Anodes should have adequate strength in order to resist the transportation processes [2]. The micro and macro cracks in anode create low flexural strength. The mechanical properties are affected by the coke properties and the baking conditions of anode. The mechanical properties of anode can be controlled by the raw material properties, forming conditions of anode paste and the baking conditions of anode.
2.2. Raw Materials Properties
Carbon anodes consist of approximately 60-70 % calcined petroleum coke, 20 % recycled anodes and butts, and 15 % coal tar pitch. The properties of these raw materials have a significant effect on resulting anode properties such as density, electrical resistivity, air and CO2 reactivities, mechanical properties and anode consumption.
2.2.1. Petroleum Coke
Green petroleum coke is a by-product of petroleum refinery, which constitutes about 2% of the overall production [19]. Mechanical and physical properties of petroleum coke are dependent on the source of crude oil, processes within the refineries and the coke calcination conditions [20, 21]. The crude petroleum contains four different groups, namely aliphatic chains (low carbon), napthene (medium carbon), aromatic chains (high carbon), and the mixture. Petroleum cokes obtained from asphaltenes feedstock, which contains higher amount of aromatic chains and impurities, such as sulfur and metals (vanadium, nickel, calcium and sodium).
Green petroleum coke is calcined at a certain temperature (1200- 1300°C) which is usually higher than the anode baking temperature before using it in carbon anodes as one of the main raw materials [2,3]. There are several reasons for calcination such as increasing C/H ratio, removing water and volatiles, decreasing impurities, minimizing the shrinkage during anode baking, and increasing coke strength [22- 24]. Calcination of coke ensures removing moisture and volatile matter from the coke. Therefore, it decreases cracking during the baking of anodes. Also, it helps pitch enter into the pores of coke during mixing stage in anode production.
Petroleum coke comes from different sources, and the calcination conditions of coke can change based on its source. There are several studies about the effect of calcination
temperature on coke and resulting anode properties [14, 15, 18, 23, 25]. It was observed that increasing calcination temperature decreases specific electrical resistivity of coke. Dusting during the electrolysis is explained by the reactivity difference between coke and pitch. Generally, the reactivity of pitch is higher than the reactivity of coke. If the reactivity difference between these two raw materials could be reduced, dusting and consequently anode consumption could be decreased.
2.2.2. Coal Tar Pitch
Coal tar pitch is used as the binder in order to create a bond between dry aggregates [2,3]. It is defined by the International Committee for Characterization and Terminology of Carbon as a residue produced by distillation or heat treatment of coal tar. The physical and chemical properties of coal tar pitch are dependent on the processes conditions and the source of tar. It has a complex structure, which contains aromatic and heteroatom-containing functional groups [26]. During anode baking, pitch carbonizes and binds with the complimentary functional groups of coke [2, 10, 27]. The wetting properties of coal tar pitch affect the resulting anode properties. Good wetting properties of coke by pitch means that pitch not only penetrates into the pores of calcined coke but also fills the void space between the particles.
There are some important properties of pitch, which influence the anode properties such as softening point, density, coking value, and impurities. The softening point of pitch varies. Higher softening point pitches usually help produce denser anodes [28]. Coking value of pitch increases with increasing softening point. In order to obtain good anode properties, pitch should have reasonable coking value (54-61) [2]. The density of pitch is 1.30- 1.32 g/cm3. Better quality anodes can be produced with increasing pitch density,
which provides higher aromaticity [2, 28]. Binder pitch should have higher aromaticity to create bonds between coke particles. The impurities in pitch such as sulfur, sodium, calcium, nickel, and vanadium affect the anode reactivity.
2.2.3. Anode Butts
In aluminum production, carbon anodes are used in the electrolytic cells for the reduction of alumina. Carbon anodes cannot be consumed completely because of the cell design. The remaining part of the carbon anodes (unused part) at the end of the electrolysis is called ‘anode butt’ [2]. Anode butts are used in the anode recipe and constitute 15%-20% of the recipe. The quality of anode butts has a significant effect on anode properties. The impurities in anode butts increase the reactivity of anodes [10, 11].
2.3.Wettability of Coke by Pitch
Wettability of a solid surface by a liquid is the function of the surface and interfacial forces which are both adhesive and cohesive (physical wetting) and the chemical interactions (chemical wetting) [29]. Thus, the wettability of coke by pitch can be not only physical due to adhesive and cohesive forces (intermolecular interactions), but also chemical because of the interface reactions between coke and pitch. The spontaneous interaction is observed when the molten pitch contacts the coke surface. This pattern is used to determine the wetting properties of coke. Wettability of coke by pitch determines the quality of interaction between these two components. Better interaction between these raw materials during mixing directly affects the resulting anode properties such as density, electrical resistivity, air and CO2 reactivities, and mechanical properties [2].
Improved wettability of coke by pitch helps pitch better penetrate into the pores of the coke as well as the void between different particles. The interactions between the pitch
and the particles depend on a number of properties of the latter, notably the particle size, the texture, and the chemical functional groups on the surface.
The wettability of coke by pitch can be quantified by the contact angle. Contact angle is the angle between the solid surface (coke) and the liquid (pitch) when the liquid drops on the solid surface [29, 30]. The relationship between the interfacial tensions and the contact angle is expressed by the Young equation (see Equation 2.3). In the equation, γLV
is the interfacial tension of the liquid-vapor interface, γSV is the interfacial tension of the
solid- vapor interface, γLS is the liquid-solid interface, and θ is the contact angle. The
interfacial tension of the liquid-vapor interface is also called the surface tension (γLV).
The force balance given by the Young’s equation is applied at the triple point (contact point of solid, liquid, and vapor phases).
𝛾𝛾𝐿𝐿𝐿𝐿cos 𝜃𝜃 = 𝛾𝛾𝑆𝑆𝐿𝐿 − 𝛾𝛾𝐿𝐿𝑆𝑆 (2.3)
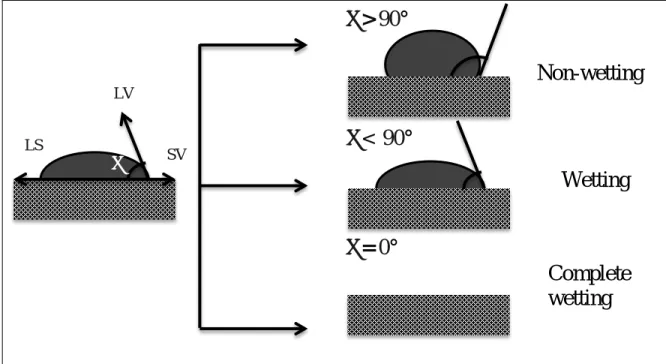
Figure 2.2 shows the different contact angles between the solid surface (coke surface) and the liquid drop (molten pitch). If the value of the contact angle is greater than 90°, it is considered non-wetting. If the contact angle is smaller than 90°, it is considered that the binder wets the solid surface. The contact angle between coke and pitch should be 0° for complete wetting [30]. There are several studies in which the sessile-drop technique is used to determine the contact angle between coke and pitch [31-35]. The contact angle of the pitch drop on coke bed can be measured using sessile-drop technique at a certain temperature under inert gas atmosphere. It was reported by several researchers that the wettability improves (contact angle decreases) with increasing time and temperature.
Figure 2.2: Contact angle for a pitch drop on a coke bed
The properties of raw materials (density, viscosity, surface functional groups) have a significant impact on wettability during mixing in anode production [2, 3, 10, 27]. Therefore, improved properties of raw materials provide better wetting. If the wetting between coke and pitch improves, a more homogenous paste can be obtained. In order to obtain good anode quality, pitch should enter the void space between particles as well as penetrate into the pores of coke. The complimentary functional groups of pitch should bond with the complimentary functional groups of calcined coke. There are three kinds of interaction between coke and pitch: hydrogen bonding, electrostatic interaction, and acid-base reactions/condensation. These interactions require aromatics, positive centres, and heteroatom-containing (O, N, S) functional groups [32]. If these functional groups of coke and pitch increase, a better interaction between these two materials can be obtained. This indicates that the modification of raw materials (by adding additives) can improve the wettability of coke and the resulting anode quality.
θ
Non-wetting
Wetting
Complete
wetting
γ
LVγ
LSγ
SVθ
>
90
°
θ
<90
°
θ
=
0
°
2.3.1. Modification of Pitch
Coal tar pitch is the by-product of coal tar that is obtained by distillation or heat treatment. It is used as the binder in the anode production so that the coke particles could stick together. The quality of anode depends on the quality of pitch. The properties of pitch such as viscosity, surface tension, penetration ability and the surface functional groups, which can create a bond with coke, play an important role in producing quality anodes. As it mentioned above (Section 2.3), the surface tension is explained in terms of the liquid-vapor interfacial tension (γLV). It controls the wetting behavior of molten pitch.
If the surface tension of the molten pitch is lower than the critical surface tension, the pitch surface is more likely to bind with the coke bed [2]. The viscosity of pitch varies with temperature. The pitch viscosity should be low enough so that it could flow on coke bed for the good wettability of coke by pitch [2, 3].
Pitch has a complex structure that includes aromatic and heteroatom containing functional groups. The structure of pitch has a significant effect on the wettability of coke by pitch. There are several works reported in the literature giving the favorable conditions for better wettability of coke by pitch and the requirements for good mixing [32, 36, 37]. Researchers have studied the improvement of the pitch wetting behavior by the modification of pitch using surfactants and additives. Rocha et al. [37] investigated the effect of two different additives at three different weight percentages on the wetting capacity of petroleum pitch. They found that modification of pitch by additives increased the wettability of coke by petroleum pitch. In the work of Starovit and Maliy [39], the addition of organic compounds such as aceptophene, dimethyl-naphthalene, acenaphthene, fluorine, diphenylene-oxide, α-methyl-naphthalene, and polymeric resins
into the pitch was investigated. The addition of additives improved the wetting capacity of pitch through the modification of pitch structure.
Rocha et al. [40] carried out two different studies in order to improve the wettability of coke by pitch. They improved wettability of pitch by the addition of a surface-active agent at different quantities (fatty acid). Also, the pitch with a low wetting capacity was mixed with the pitch with a high wetting capacity to obtain a new pitch with good wetting behavior. In addition, it was reported that during the sessile-drop tests, the use of nitrogen and increase in heating rate helped achieve good wettability.
In the work of Rocha et al. [35] the use of an additive, which is a by-product of the petroleum refining industry, improved the wetting behavior of petroleum pitch (see Figure 2.3). It was also observed by the authors that the quinoline insoluble (QI) content played an important role on the wettability. With a lower QI content, petroleum pitch needed a higher temperature in order to penetrate.
Figure 2.3: Variation of pitch-drop height with temperature for a) coal tar pitch (CTP-1), b) petroleum pitch (PP-1), c) petroleum pitch with an added surfactants (PP-1S) [35] Another work on the improvement of the wettability of coke by pitch by adding surfactants to pitch was reported by Rocha et al. [41]. The results showed that the
addition of the surfactants (two additives were commercial active-surface agents (alkyl/carbonyl and alkyl/sulfur) and one was a product of petroleum refining) at different weight ratios increased the wettability of pitch (see Figure 2.4).
Figure 2.4: Variation of pitch-drop height with temperature for a) non-modified petroleum pitch, b) 5% wt of surfactant B added to petroleum pitch, c) 5% wt of surfactant C added to petroleum pitch, d) 5% wt of surfactant A added to petroleum pitch,
e) 10% wt of surfactant A added to petroleum pitch, f) 15% wt of surfactant A added to petroleum pitch [41]
2.3.2. Modification of Coke
Calcined petroleum coke is one of the major raw materials used in the anode recipe. It constitutes about 60-70% of the carbon anodes. The quality of calcined petroleum coke declined over the years [20, 21, 43-45].
In anode production, coke and pitch interact with each other at the mixing stage. The complimentary functional groups of coke bond with the complimentary functional groups of pitch. The interactions between coke and pitch influence the resulting anode density.
Hence, the wettability of coke is an important parameter to consider during the mixing stage [10, 27].
The properties of coke such as porosity, surface chemistry, and density play an important role in the wettability of coke by pitch. The coke porosity should be high enough to allow pitch to enter the pores of calcined coke [2]. The high porosity of coke increases the required pitch amount. Greater amount of pitch might increase the thickness of pitch layer on coke surface if it does not penetrate the pores of the particle.
The surface chemistry has a significant effect on the wetting behavior of coke. It is reported in the literature that the coke surface contains mostly oxygen, nitrogen, and sulfur in addition to carbon [45]. One of the objectives of the calcination of petroleum coke is to increase carbon to hydrogen ratio so that the interaction between coke and pitch can be enhanced. Coke is a highly complex organic material containing different functional groups such as aromatics, heteroatoms and aliphatics. The presence of aliphatic in coke surface creates steric hindrances because of their long chain [10].
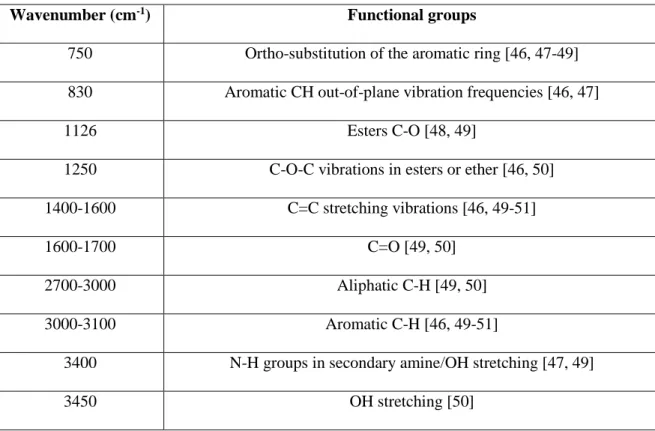
There are three kinds of interactions between coke and pitch, namely hydrogen bonding, acid-base reactions/condensation, and electrostatic interaction. These interactions require aromatic and heteroatom-containing functional groups. The increase in these functional groups in coke can increase the possibility to bind with pitch. Table 2.3.2-1 shows the list of functional groups in green petroleum cokes. There is no study found in the literature about the functional groups of calcined petroleum coke from FT-IR study because of its low absorption characteristics to baseline levels [46].
Table 2.1: List of functional groups in green petroleum coke from FT-IR study
Wavenumber (cm-1) Functional groups
750 Ortho-substitution of the aromatic ring [46, 47-49] 830 Aromatic CH out-of-plane vibration frequencies [46, 47]
1126 Esters C-O [48, 49]
1250 C-O-C vibrations in esters or ether [46, 50]
1400-1600 C=C stretching vibrations [46, 49-51]
1600-1700 C=O [49, 50]
2700-3000 Aliphatic C-H [49, 50]
3000-3100 Aromatic C-H [46, 49-51]
3400 N-H groups in secondary amine/OH stretching [47, 49]
3450 OH stretching [50]
Sarkar et al. [32] studied the effect of some coke properties on the wettability of coke by pitch. Figure 2.5 shows the contact angle of three different cokes with increasing time. It was reported in the study that the pitch did not penetrate into Coke 3 because of its lower porosity, lower oxygen content, and higher amount of C-S bond.
In the work of Jiang et al. [36], petroleum coke was treated by perchloric acid (HClO4)
and hydrogen peroxide (H2O2). The chemical treatment changed the coke structure. It
was observed that the oxygen containing functional groups of coke changed after its modification by chemicals (see Figure 2.6).
Figure 2.6: FT-IR spectra of petroleum coke with and without modification [36]
As mentioned above, there are a number of studies on the modification of pitch using additives and surfactants in order to improve the wettability of coke by pitch. However, to our knowledge, there is no published study on the improvement of coke properties through the addition of additives, and the use the modified coke in the production of anodes. The current project addresses these issues, coke modification with additives and the impact of using modified coke on the anode properties. Pitch modification is the subject of another project.
CHAPTER 3
EXPERIMENTAL
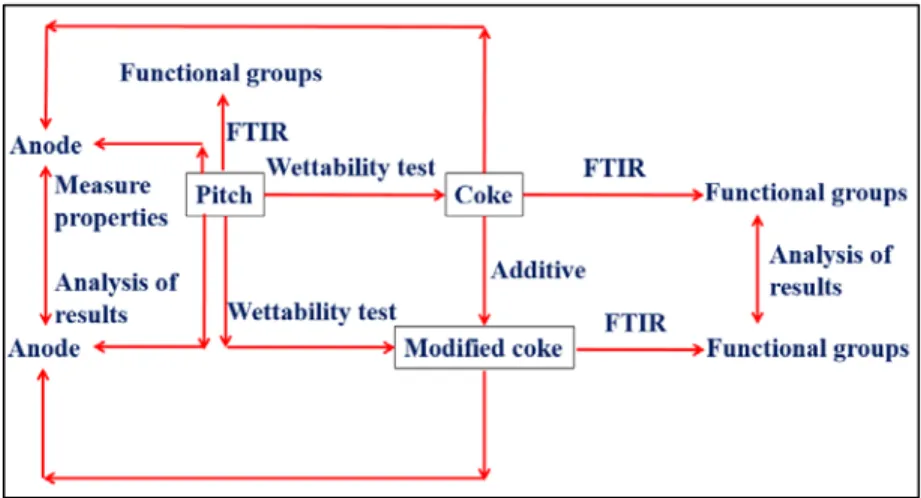
In this chapter, all experimental systems and characterization methods are explained. The surface characterization of four calcined petroleum cokes (non-modified and modified by additive), one pitch and several different additives was done based on Fourier Transform Infrared Spectroscopy (FT-IR). The cokes were modified using six different additives based on FT-IR results. The wettability of coke (non-modified and modified by additive) by pitch was studied using the sessile-drop system.
Based on material characterization results (FT-IR and wettability), anodes were fabricated with non-modified coke and the cokes modified with additives. The anode fabrication steps such as dry aggregate preparation, modification of coke, mixing, vibro-compaction, and baking are also presented in this chapter. The fabricated anodes were characterized based on apparent density, electrical resistivity, air and CO2 reactivities,
and mechanical properties.
3.1.Characterization of Raw Materials
3.1.1. Modification of Coke with Additives for Characterizations
In this study, four different cokes and six different additives were used to improve the wettability of coke by pitch. In order to modify the coke, additives were dissolved in a solvent using a beaker and a magnetic stirrer (Cole- Parmer stirrer). Then coke was added to the solution. Figure 3.1 shows the modification steps of a coke. It should be noted that this procedure is for the characterization of coke only. During anode manufacturing, the
whole dry aggregate (all solid particles) was modified with additives. The details of this procedure are given in Chapters 4 and 5.
Figure 3.1: Modification steps of coke 3.1.2. Fourier Transform Infrared Spectroscopy (FT-IR)
Coke and pitch are the main components for anode production, and their quality of can directly affect the properties of anode. Both components have complex structures to analyze. The chemical structure of coke and pitch plays an important role in the interaction between coke and pitch at the mixing stage during anode manufacturing. FT-IR is one of the most common, easy, and inexpensive techniques to analyze the structure of materials. It gives an idea about presence of the functional groups, which help coke-pitch interaction, in coke, coke-pitch, and additives. In this study, coke, coke-pitch and additives were analyzed by using Nicolet 6700, which can be seen in Figure 3.2. Characterization was done using KBr, and the ratio of KBr to sample was around 200:1. The number of scans was 36, and the spectra were registered for the wavenumber range of 400-4000 cm-1. Each experiment was repeated two times, and the average value was used for the analysis. Linear baseline correction was carried out for each sample using the Omnic software. The results were presented after the baseline correction in absorbance mode was done.
Solvent +
Additive
(10 minute
mixing)
Add
petroleum
coke
(10 minute
mixing)
Dried in the
furnace
(at 85°C 1.5
hour)
Figure 3.2: Fourier Transfer Infrared Spectroscopy (FT-IR)
3.1.3. Wettability
Wettability is defined as the ability of a liquid to spread on a solid surface. It represents the interaction between the liquid and the solid surface and can be quantified by measuring the contact angle (θ°) between them. In this study, four different cokes (with and without additives) and one pitch were used to determine the wettability of coke by pitch.
The sessile-drop system is one of the most common systems to determine the wetting properties of materials. In this project, the wettability of coke by pitch was studied using the sessile-drop system (see Figure 3.3). The system consists of a tube furnace (Thermolyne 21100), one graphite crucible for pitch (pitch injection system), a graphite sample crucible (for coke bed), a digital camera (Appro B/W Camera), and a vacuum pump.
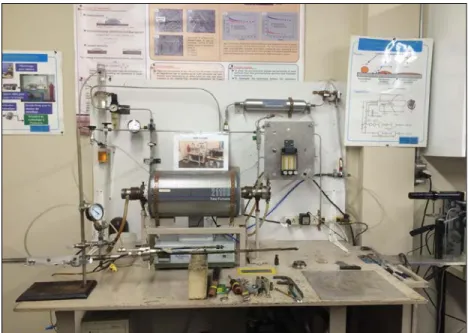
Figure 3.3: Sessile-drop experimental set-up at UQAC
The crushed and sieved coke particles (particle size of -125+100 µm) were placed on the crucible. This particle size was also used in other studies [10, 26, 32]. The coke particles were compacted in the same crucible each time to have a smooth surface. The volume of coke samples was identical in each experiment. The bulk density measurement was carried out for different cokes in order to maintain the same porosity between particles and the same packing for all samples. Different packing can give different wetting results. The solid pitch was filled into the injection chamber, which has a small hole for the drop to fall. The coke bed and the injection chamber, which is full of solid pitch, were placed into the tube furnace. Before starting the experiment, vacuum was applied to the tube furnace in order to remove O2 because O2 can react with coke or pitch at high
temperatures. All experiments were performed under N2 atmosphere. N2 was passed
through O2 (Chromatographic Specialties, Chromspec, C36084) and humidity traps to
remove from O2 and reduce the humidity before sending it to the furnace. The system
the inside of the furnace. The second line provides N2 to the injection chamber. The
injection chamber, which contains solid pitch, was placed on top of the coke bed. When the pitch becomes liquid, it falls directly onto the coke bed. The hole of the injection chamber should be the same for each experiment in order to maintain the same drop size. Images of the pitch drop on the coke surface were recorded with a camera. The FTA-32 software was used to measure the contact angle between the pitch drop and the coke bed at different times. The experiments were done at 170°C which is the typical mixing temperature used by the industry. Each experiment was done two times with the same drop size, and the average value of two experiments was used for the study.
3.1.4. Tapped Bulk Density
The tapped bulk density (TBD) measurement was done for four different cokes to maintain the same packing for wetting experiments. The crucible for wetting experiment was filled with coke 1 and the weight was recorded. Then, the volume was calculated by dividing the weight by TBD of Coke 1. The calculated volume was kept the same for the other three cokes. In order to maintain the same porosity between the coke particles, the weight of each coke was calculated based on their TBD at constant volume. If the porosity (packing) of coke particles differs from each other, the wetting results can be misleading.
The TBD measurement device is shown in Figure 3.4. A certain amount of sample was taken and was put in a 250-ml cylinder. The tapping was done for 6 minutes. The TBD (g/cm3) was calculated by dividing the weight by the volume, which was measured at four different places on the cylinder. The TBD measurement was done based on ISO 10236:1995. The tapped density results are presented in Appendix 1.
Figure 3.4: Tapped bulk density equipment at UQAC
3.2. Preparation of Laboratory Scale Anodes 3.2.1. Dry Aggregate Preparation
The same dry aggregate recipe, a typical industrial recipe, was used for each anode. The anodes were fabricated in the UQAC laboratory under conditions similar to those of the industry. Different fractions of coarse, medium, and fine particles were used to have a certain granulometry. Recipe consists of 15% of pitch and 85% of anode butts, green and baked rejects, and calcined petroleum coke.
3.2.2. Modification of Dry Aggregate with an Additive for Anode Production
Two methods were applied to modify the dry aggregate particles. In both methods, additives were dissolved in a solvent to provide better interaction with coke. The detailed information about the modification of dry aggregate particles with additives for anode production is given in Chapters 4 and 5.
3.2.3. Mixing
The dry aggregate was transferred to the intensive mixer (see Figure 3.5) manually and then molten pitch was added to the mixture. Dry aggregate and pitch were mixed for a
certain period of time at 170°C. After mixing, the paste was ready to be compacted in the vibrocompactor.
Figure 3.5: Intensive mixer at UQAC 3.2.4. Vibrocompaction
Anode forming was done using the vibrocompactor in the UQAC laboratory (Figure 3.6). The paste was transferred from the mixer into the preheated vibrocompactor mould. The load, which is used as a cover for mould, was placed on the top of the mould. The vacuum was applied to the mould so that there were no trapped gases that can cause cracks during baking. The forming parameters were set always to the same values for each anode. The compaction was carried out. Then, the green anode was left for cooling at room temperature.
3.2.5. Baking
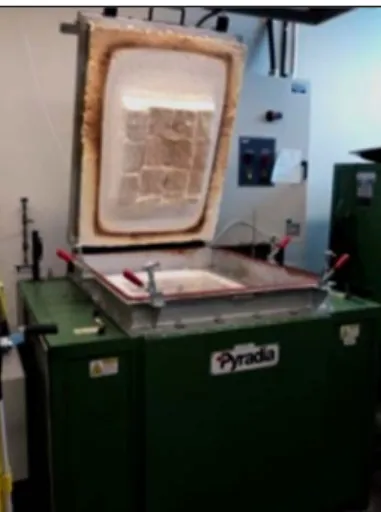
The green anodes were cored, and the cores were baked in a baking furnace (Pyradia, Model-B07D02029021SVCCH) in the UQAC laboratory (Figure 3.7). Since baking significantly affects the anode properties, the same baking conditions were used for all anodes. The baking conditions were representative of the industrial practice. All cores were placed inside the furnace at the same time. Then they were covered with filler coke so that during baking this material would be consumed instead of cores. Several thermocouples were placed in the furnace at different positions in order to track the temperature distribution. When the furnace reached the desired temperature, 8 hours of soaking was applied.
Figure 3.7: Baking furnace that is used for baking green anodes at UQAC
3.3. Characterization of Laboratory Scale Anodes
The characterization of laboratory scale anode cores was done based on four criteria: apparent density (ASTM D5502-00 (2015)), electrical resistivity (ASTM D6120-97 (2012)), air (ASTM-D6559-00a) and CO2 (ASTM-D6558-00a) reactivities as well as
3.3.1. Sample Preparation
The characterizations work was done on anode cores. Green anodes were cores at four different positions, and 50 mm-diameter and 130 mm-long cylinders were cut from the anode. The core positions and the samples taken from the cores for reactivity tests are given in Figure 3.8.
Figure 3.8: (a) Anode coring plan for anode characterization (b) Position of samples used for air/CO2 reactivity experiments
All cores were dried. Then, green density and green electrical resistivity measurements were carried out for all four cores. Core 2 and Core 3 were baked. Baked density and resistivity of Core 2 and Core 3 were measured. Core 2 was used for reactivity measurements. Samples used for air and CO2 reactivity experiments are shown in Figure
3.8 (b). The top section of the core (Φ50x50 mm) was used for air reactivity and the bottom section of the core (Φ50x50 mm) was used for CO2 reactivity measurement. Core
3 was used for the flexural strength test.
3.3.2. Apparent Density
After coring, all cores were dried. Length (l, cm) of the cores was measured at eight different places using the slide caliper as well as the diameter (d, cm) at four different places. The averages of eight measurements for length and four measurements for diameter were taken and used for the volume calculation (see Equation 3.1). Also, the weight (W, g) of the cores was measured using a balance with 0.01 g of accuracy. Density was calculated by dividing by the volume of the sample (see Equation 3.2). Density measurement was performed for green and baked cores.
𝑉𝑉 = 𝜋𝜋 �𝑛𝑛4 � 𝐴𝐴 𝑐𝑐𝑐𝑐2 3 (3.1)
𝐷𝐷 = 𝑊𝑊𝑉𝑉 𝑔𝑔/𝑐𝑐𝑐𝑐3 (3.2)
3.3.3. Electrical Resistivity
The resistivity measurements for green and baked cores were carried out using the device developed at UQAC (shown in Figure 3.9). The average diameter, which was calculated for density, was used for resistivity. An electrical current of 1A was passed through the sample and the voltage drop was recorded between two points over a certain length (100 mm). The electrical resistivity (ER) was calculated based on current (I, A), voltage drop between the two points (V), cross sectional area of the sample (a, cm2), and the length between two points (100 mm) (see Equations 3.3 and 3.4).
𝐸𝐸𝐸𝐸 = 𝑉𝑉 𝑥𝑥 𝑎𝑎𝐴𝐴 𝑥𝑥 𝐴𝐴 𝜇𝜇Ω𝑐𝑐 (3.4)
Figure 3.9: Electrical resistivity measurement setup for anode cores at UQAC
3.3.4. Air and CO2 Reactivities
Air and CO2 reactivity measurements including dusting for baked cores (Φ50x50 mm)
were done using the thermogravimetric (TGA) method (see Figure 3.10). There are several steps for the reactivity experiments based on D6559-00a0 and ASTM-D6558-00a;
The tube furnace (Carbolite) was preheated before starting the experiment (for air reactivity 525°C and for CO2 reactivity 960°C) under N2 atmosphere.
The sample was placed in the tube furnace.
N2 was continued to pass for 30 minutes before entering the reaction gases (air or
CO2).
Then, air or CO2 was injected to the system at a velocity required by the ASTM
standards.
The initial weight was recorded at 31st minute (W
The air was passed through for 3 h at 525°C for air reactivity measurement and CO2 was passed through for 7 h at 960°C for CO2 reactivity measurement.
The weight of the sample was measured at 210th minute for air reactivity and at
450th minute for CO2 reactivity (Wf, mg).
The sample was removed from the crucible inside the furnace, and the exposed dust on the sample surface (Wd1, mg) was collected immediately. Otherwise, the
air inside the room can affect the dusting results.
Also during the experiment, the dust was collected inside the furnace in the crucible. This was also measured (Wd2, mg).
The reactivity was calculated based on the exposed surface area of the sample (A), and Wi, Wf, Wd1 and Wd2. Time is 3 h for air reactivity and 7 h for CO2
reactivity (see Equation 3.5).
Also dusting was calculated using Wd2, empty crucible weight (Wc), exposed
surface area of the sample (A), and the test time (3 h for air reactivity and 7h for CO2 reactivity) (see Equation 3.6)
For the exposed surface area calculation, the average length (l, mm) and the average diameter (d, mm), determined for density and resistivity measurements, were used (see Equation 3.7).
𝐴𝐴 =�𝜋𝜋𝑛𝑛𝐴𝐴 + 2𝜋𝜋𝑛𝑛 2 4 � 100 𝑐𝑐𝑐𝑐2 (3.5) 𝐸𝐸𝑛𝑛𝑎𝑎𝑐𝑐𝐴𝐴𝑟𝑟𝑂𝑂𝑟𝑟𝐴𝐴𝑅𝑅 = [ � 𝑊𝑊𝑖𝑖 − 𝑊𝑊𝐴𝐴 𝑥𝑥 ℎ𝑛𝑛𝑜𝑜𝑂𝑂𝑓𝑓�+( 𝑊𝑊𝑛𝑛2− 𝑊𝑊𝑛𝑛1)] 𝑐𝑐𝑔𝑔/𝑐𝑐𝑐𝑐2ℎ (3.6)
𝐷𝐷𝑜𝑜𝐷𝐷𝐴𝐴𝑟𝑟𝑛𝑛𝑔𝑔 = ( 𝑊𝑊𝐴𝐴 𝑥𝑥 ℎ𝑛𝑛𝑜𝑜𝑂𝑂 𝑐𝑐𝑔𝑔/𝑐𝑐𝑐𝑐𝑑𝑑2− 𝑊𝑊𝑐𝑐) 2ℎ (3.7)
Figure 3.10: Thermogravimetric (TGA) analysis system for air/CO2 reactivity of anode
core samples at UQAC
3.3.5. Flexural Strength
The flexural strength measurement was performed using the three-point bending method based on ISO N 848. A sample was placed inside the device (MTS Alliance RT100) shown in Figure 3.11. The equipment applied a steady and linearly increasing load in the middle of the sample. The maximum load is the load applied when the sample breaks. The flexural strength was calculated using the maximum load (Fmax, N), support span
length (L, m), and the diameter of the sample (d, m) (see Equation 3.8).
CHAPTER 4
MODIFICATION OF COKE BY DIFFERENT ADDITIVES TO IMPROVE ANODE PROPERTIES
(Submitted to FUEL and the first review is completed.) Abstract
Aluminum is produced in electrolytic cells using carbon anodes, which consist of a mixture of coke, pitch, and recycled carbon material. Anodes play an important role in aluminum production. The quality of raw materials can vary based on the source and the process parameters. In spite of the variations in the raw material properties, the industry has to maintain the quality of anodes. In order to manufacture good quality anodes, coke and pitch must interact well with each other. The affinity between these two components depends on good wetting properties, which will lead to good binding of the particles. The main objective of this work is to modify the coke in order to improve its wetting properties using different additives. An FT-IR study was done to identify certain functional groups in non-modified and modified coke as well as in pitch. The wetting tests were carried out using the sessile-drop method to measure the contact angle between coke and pitch. Based on FT-IR and wettability results, an additive was selected and used for the fabrication of anodes, which were characterized before and after baking. The modification of coke with the selected additive improved the anode properties.
4.1.Introduction
Aluminum is produced by the electrolytic reduction of alumina. In this process, the carbon anodes are consumed according to Equation 4.1.
2Al2O3+3C = 4Al + 3CO2 (4.1)
The carbon anodes are made of dry aggregate (calcined petroleum coke, butts and recycled anodes) and coal tar pitch. The dry aggregate and pitch are mixed to form the anode paste at around 170°C. The anode paste is compacted in a press or vibro-compactor to produce the green anode. The green anode is baked in a furnace to produce the baked anode. Calcined coke constitutes around 65-70% of the anode raw materials. Carbon anode cost is one of the major elements of the aluminum production cost, which could exceed 20% [52].
In recent years, the demand for anode-quality raw materials has increased due to the increase in aluminum production. The calcined petroleum coke and coal tar pitch are the main raw materials required for the production of carbon anodes. Properties of calcined coke are important since it is present in anodes in large quantity and directly affect the quality of baked anode. It is a solid by-product from oil refineries, representing some 2 % of their overall revenues [19]. Thus, the quality of coke is not a primary concern for the refineries. Its quality depends on the crude oil, processes within the refineries, and calcination conditions. Thus, the quality of calcined coke can change. Pitch is also a by-product of the coal tar industry, and its quality can also change. A good quality baked anode has high density, low electrical resistivity, low air and CO2 reactivities, and good
mechanical properties [2]. In spite of the variation in the raw material quality, the industry has to maintain the anode quality.
![Figure 2.1: Anode behavior in a reduction cell [2, 3]](https://thumb-eu.123doks.com/thumbv2/123doknet/7581361.231529/28.918.229.689.273.644/figure-anode-behavior-reduction-cell.webp)
![Figure 2.3: Variation of pitch-drop height with temperature for a) coal tar pitch (CTP-1), b) petroleum pitch (PP-1), c) petroleum pitch with an added surfactants (PP-1S) [35]](https://thumb-eu.123doks.com/thumbv2/123doknet/7581361.231529/35.918.277.629.656.910/figure-variation-pitch-height-temperature-petroleum-petroleum-surfactants.webp)

![Figure 2.6: FT-IR spectra of petroleum coke with and without modification [36]](https://thumb-eu.123doks.com/thumbv2/123doknet/7581361.231529/39.918.286.633.279.527/figure-ft-ir-spectra-petroleum-coke-modification.webp)