Pathogenèse de l’œdème cérébral dans l’encéphalopathie
hépatique minimale: rôles du stress oxydatif et du lactate
par
Cristina Bosoi Tudorache
Programme des Sciences biomédicales Faculté de médecine
Thèse présentée à la Faculté des études supérieures et postdoctorales en vue de l’obtention du grade de Philosophiæ Doctor (Ph.D.)
en sciences biomédicales
Août, 2014
Université de Montréal
Faculté des études supérieures et postdoctorales
Cette thèse intitulée:
Pathogenèse de l’œdème cérébral dans l’encéphalopathie hépatique minimale: rôles du stress oxydatif et du lactate
Présentée par : Cristina Bosoi Tudorache
a été évaluée par un jury composé des personnes suivantes :
Dr. Marc Bilodeau, président-rapporteur Dr. Christopher F. Rose, directeur de recherche
Dr. Hélène Girouard, membre du jury Dr. Mark Swain, examinateur externe
Résumé
L’encéphalopathie hépatique (EH) est un syndrome neuropsychiatrique découlant des complications de l'insuffisance hépatique. Les patients souffrant d'une insuffisance hépatique
chronique (IHC) présentent fréquemment une EH minimale (EHM) caractérisée par des dysfonctions cognitives subtiles qui affectent leur qualité de vie. L'insuffisance hépatique entraîne une
hyperammoniémie, le facteur central dans la pathogenèse de l'EH. Pourtant, les taux d'ammoniaque sérique ne sont pas corrélés avec la sévérité de l'EH lors d'une IHC, suggérant que d'autres facteurs y contribuent. L'œdème cérébral est une caractéristique neuropathologique décrite chez les patients souffrant d'une EHM et plusieurs facteurs dont le stress oxydatif, les altérations du métabolisme énergétique et l'augmentation de la glutamine cérébrale pourraient contribuer à la pathogenèse de l'œdème cérébral lors d'une EHM induite par une IHC. Les mécanismes sous-jacents exacts ainsi que les relations entre ces facteurs et l'ammoniaque ne sont pas connus. Présentement, le seul traitement efficace de l'IHC est la transplantation hépatique, une option thérapeutique très limitée.
Le but de cette thèse est de contribuer à l'avancement des connaissances sur les mécanismes sous-jacents liés au rôle du stress oxydatif, de la glutamine et du lactate dans la pathogenèse de l'œdème cérébral lors d'une EHM induite par une IHC afin d'envisager de nouvelles options thérapeutiques. Les objectifs précis étaient: 1. Déterminer le rôle de l’ammoniaque dans la
pathogenèse de l'œdème cérébral lors d'une EHM induite par une IHC. 2. Investiguer le rôle du stress oxydatif, en décrivant sa présence au niveau systémique et au niveau cérébral dans la pathogenèse de l'œdème cérébral lors d'une EHM induite par une IHC. 3. Déterminer la relation entre l’ammoniaque et le stress oxydatif dans la pathogenèse de l'œdème cérébral. 4. Établir le rôle du lactate et de la glutamine dans la pathogenèse de l'œdème cérébral et leur relation avec l’ammoniaque. Pour atteindre ces objectifs, 2 modèles animaux d'EHM obtenus par microchirurgie chez le rat ont été utilisés: 1) la ligature de voie biliaire, un modèle d'IHC et 2) l'anastomose porto-cave, un modèle d'hyperammoniémie induite par la dérivation portosystémique.
pas l'œdème cérébral lors d'une EHM. Pourtant, lorsque les 2 facteurs agissent ensemble ils
présentent un effet synergique qui entraîne le développement de l'œdème cérébral, le stress oxydatif étant une première insulte, qui est suivie par l'hyperammoniémie comme deuxième insulte. En plus, le stress oxydatif a été mis en évidence seulement au niveau systémique, et non au niveau central dans notre modèle d'IHC en association avec l'œdème cérébral, suggérant que le stress oxydatif systémique est une conséquence de la dysfonction hépatique et que l'hyperammoniémie n’induit pas le stress oxydatif ni systémique ni central.
Nous avons démontré qu’une augmentation du lactate cérébral est une conséquence directe de l'hyperammoniémie et joue un rôle important dans la pathogenèse de l'œdème cérébral lors d'une EHM induite par une IHC, tandis qu’une augmentation de la glutamine au niveau cérébral n'est pas un facteur clé.
La compréhension de ces mécanismes a entraîné la proposition de 3 nouvelles stratégies thérapeutiques potentielles pour l'EHM. Elles ciblent la diminution de l'ammoniaque sérique, la réduction du stress oxydatif et l'inhibition de la synthèse du lactate.
Mots-clés: encéphalopathie hépatique, hyperammoniémie, œdème cérébral, stress oxydatif, espèces réactives d’oxygène, ligature de la voie biliaire, anastomose portocave, AST-120, allopurinol, diéthyl maléate, résonance magnétique nucléaire, lactate, glutamine, dichloroacétate.
Abstract
Hepatic encephalopathy (HE) is a metabolic neuropsychiatric syndrome which occurs as a complication of liver failure/disease. Patients with chronic liver disease (CLD) present often with minimal HE (MHE) characterized by subtle cognitive dysfunction which impairs their quality of life. Impaired liver function leads to hyperammonemia which is a central factor in the pathogenesis of HE. However, ammonia alone is poorly correlated with the severity of HE during CLD, strongly
suggesting other factors may contribute. Brain edema is a neuropathological feature described in MHE patients and several factors such as oxidative stress, energy metabolism alterations and an increase in glutamine may to contribute to the pathogenesis of brain edema during HE related to CLD. However the exact underlying mechanisms and the relationships between these factors and ammonia are poorly understood. To date, the only effective treatment of CLD remains liver transplantation, a limited therapeutic option.
The aim of this thesis is to advance the knowledge into the mechanisms underlying the role of oxidative stress, glutamine and lactate in the pathogenesis of brain edema during MHE associated with CLD in order to uncover new therapeutic options. The study objectives were: 1. Determine the role of ammonia in the pathogenesis of brain edema in chronic liver disease. 2. Investigate the role of oxidative stress, depicting between its presence systemically and centrally, in the pathogenesis of brain edema in chronic liver disease. 3. Determine the relationship of ammonia and oxidative stress in the pathogenesis of brain edema. 4. Define the roles of lactate and glutamine in the pathogenesis of brain edema and their relationship with ammonia. To achieve these objectives, we used 2 microsurgical rat models: 1) bile-duct ligation, a cirrhosis model and 2) portacaval anastomosis, a hyperammonemia model following portal-systemic shunting.
Our findings demonstrate that ammonia and systemic oxidative stress independently do not induce brain edema in MHE related to CLD. However, when both factors are present, they exert a synergistic effect leading to the development of brain edema with oxidative stress presenting as a “first hit”, followed by hyperammonemia as a “second hit”. Moreover, solely systemic and not central oxidative stress was observed in our CLD rat model in relation to brain edema implying that
systemic oxidative stress is a consequence of liver dysfunction and that central oxidative stress is not a direct effect of hyperammonemia in the setting of CLD. Moreover, we revealed that increased cerebral lactate is a direct consequence of hyperammonemia and also plays an important role in the pathogenesis of brain edema, while increased cerebral glutamine does not.
The understanding of these mechanisms led to the proposal of three different strategies as potential HE therapies. These are directed towards lowering ammonia, reducing oxidative stress and inhibiting lactate synthesis.
Keywords: hepatic encephalopathy, hyperammonemia, brain edema, oxidative stress, reactive oxygen species, bile-duct ligation, portacaval anastomosis, AST-120, allopurinol, diethyl maleate, nuclear magnetic resonance, lactate, glutamine, dichloroacetate
Table of contents
Résumé ... i Abstract ... iii Table of contents ... v Table list ... ix Figures list ... xi Abbreviations:... xvi Acknowledgements ... xix Chapter 1: Introduction ... 1 1.1 Hepatic encephalopathy ... 21.1.1 Definition and epidemiology ... 2
1.1.1.1 Minimal HE ... 4
1.1.1.2 Overt HE ... 4
1.2 Brain edema in liver disease ... 5
1.2.1 Brain edema... 5
1.2.1.1. Intracranial hypertension in ALF and not CLD ... 9
1.2.2 Vasogenic versus cytotoxic brain edema in liver disease ...10
1.3. Pathogenesis of hepatic encephalopathy and brain edema ...12
1.3.1 Ammonia ...12
1.3.1.1 Ammonia chemistry and metabolism ...12
1.3.1.2 Ammonia metabolism during liver failure ...13
1.3.1.4 Impairment of neurotransmitter systems induced by ammonia...16
1.3.2 Oxidative stress ...18
1.3.2.1 Systemic oxidative stress and liver disease ...19
1.3.2.2 Cerebral oxidative stress and hepatic encephalopathy ...20
1.3.3 Lactate ...20
1.3.3.1 Lactate metabolism ...21
1.3.3.2 Lactate and liver failure ...23
1.3.3.3 Lactate and hepatic encephalopathy ...23
1.3.4 Glutamine ...24
1.3.4.1 Glutamine metabolism during hyperammonemia ...24
1.3.4.2 Glutamine neurotoxicity ...25
1.4. Models of hepatic encephalopathy ...26
1.4.1 In vivo models ...26
1.4.1.1 Chronic hepatic encephalopathy models (types B and C) ...27
Type B hepatic encephalopathy models ...27
Type C hepatic encephalopathy models ...27
1.4.1.2 Acute hepatic encephalopathy models (type A) ...29
Anhepatic models ...29
Toxic models ...30
1.4.2 In vitro models...31
1.5. Treatments of hepatic encephalopathy ...31
1.5.1 Protein restriction ...32
1.5.3 Antibiotics ...33
1.5.4 Probiotics ...33
1.5.5 Sodium benzoate and sodium phenylacetate/phenylbutyrate ...34
1.5.6 Benzodiazepine-like antagonists ...34
1.5.7 Branched-chain amino acids ...35
1.5.8 L-ornithine L-aspartate ...35
1.5.9 L-ornithine phenylacetate ...36
1.5.10 Liver transplantation ...36
1.6. Hypothesis and objectives ...37
Chapter 2: Paper presentation ...39
First paper: AST-120 (spherical carbon adsorbent) lowers ammonia levels and attenuates brain edema in bile duct–ligated rats ...40
Second paper: Systemic oxidative stress is implicated in the pathogenesis of brain edema in rats with chronic liver failure ...69
Third paper: Induction of systemic oxidative stress leads to brain edema in portacaval shunted rats ... 102
Fourth paper: Increased brain lactate is central to the development of brain edema in rats with chronic liver disease ... 126
Chapter 3: Discussion ... 159
3.1 Role of ammonia in the pathogenesis of brain edema in MHE during CLD ... 160
3.2 Role of lactate in the pathogenesis of brain edema in MHE during CLD ... 162
3.3 Role of glutamine in the pathogenesis of brain edema in MHE during CLD ... 165
3.5 Role of the BBB in the pathogenesis of brain edema in MHE during CLD ... 173
3.6 Role of brain edema in MHE during CLD ... 175
3.7 Potential emerging therapies for MHE during CLD ... 181
3.7.1 AST-120 ... 181 3.7.2 Allopurinol ... 182 3.7.3 Dichloroacetate ... 183 3.7.4 Probiotics ... 185 3.7.5 Ornithine Phenylacetate ... 185 3.7.6 Glycerol phenylbutyrate... 186
Chapter 4: Conclusion and future directions ... 187
4.1 Conclusions ... 188
4.2 Future directions ... 190
4.2.1 The mechanism of systemic ROS leading to brain edema ... 190
4.2.2 The link between systemic oxidative stress and increased cerebral lactate in the pathogenesis of brain edema ... 190
4.2.3 Describing different types of HE ... 191
Bibliography ... 193
Table list
Chapter 1
Table I: page 5
West Haven criteria for the grading of hepatic encephalopathy Table II: page 24
Rat and human brain organic osmolyte content (mM)
Chapter 2
First paper
Table I: page 53
Liver biochemistry markers in bile-duct ligated and SHAM-operated rats under treatment with AST-120
Second paper
Table I: page 82
Liver/body weight and biochemistry markers Table II: pages 86-87
Reactive oxygen species, oxidant and antioxidant enzyme activities in plasma and frontal cortex of rats with portacaval anastomosis and bile-duct ligation compared to respective SHAM-operated controls
Third paper
Table I: page 116
Hepatic function markers aspartate aminotransferase and alanine aminotransferase and ammonia levels in in rats with portacaval anastomosis and sham-operated controls treated and not treated with diethyl maleate
Fourth paper
Table I: page 139 1
H-NMR concentration of brain osmolytes in rats with bile-duct ligation compared to respective SHAM-operated controls
Chapter 3
Table I: page 167
Variation of cerebral organic osmolytes and their sum in relation to brain edema in rats with chronic hyperammonemia induced by portacaval anastomosis, acute liver failure following liver devascularization and cirrhosis induced by bile-duct ligation
Figures list
Chapter 1
Figure 1: page 3Classification of the subtypes of hepatic encephalopathy type C Figure 2: page 7
Structure of the BBB Figure 3: page 8
Vasogenic and cytotoxic brain edema Figure 4: page 9
Relationship between brain volume and intracranial pressure Figure 5: page 15
Neurotoxic effects of ammonia Figure 6: page 21
The reversible reaction from lactate to pyruvate catalyzed by lactate dehydrogenase Figure 7: page 22
The Cori cycle Figure 8: page 27 Portacaval anastomosis Figure 9: page 28 Bile-duct ligation
Chapter 2
First paper
Figure 1: page 51Figure 2: page 52
Weight curves and daily protein intake of bile-duct ligated and SHAM-operated rats under treatment with AST-120 0.1, 1 and 4 g/kg/day for 6 weeks
Supplemental fig. 1: page 54
Liver histopathology following treatment with AST-120 in bile-duct ligated and SHAM-operated rats
Figure 3: page 55
Arterial ammonia concentrations following treatment with AST-120 in bile-duct ligated and SHAM-operated rats
Figure 4: page 56
Arterial ROS concentrations following treatment with AST-120 in bile-duct ligated and SHAM-operated rats
Figure 5: page 58
Frontal cortex, cerebellum and brain stem water content following treatment with AST-120, in bile-duct ligated and SHAM-operated rats
Figure 6: page 60
Arterial ammonia, frontal cortex, cerebellum and brain stem water content and
locomotor activity following treatment with AST-120 in bile-duct ligated and SHAM-operated rats
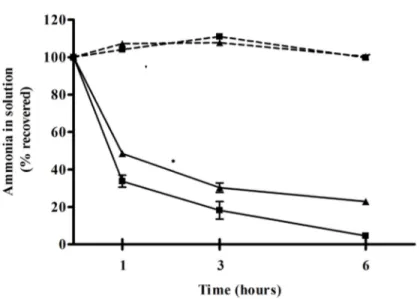
Figure 7: page 61
non-treated and AST-120-treated bile-duct ligated rats
Second paper
Figure 1: page 84
Arterial ammonia, cerebrospinal fluid ammonia, frontal cortex brain water in rats with
portacaval anastomosis and bile-duct ligation compared to respective SHAM-operated
controls
Figure 2: page 88
Oxidative stress effects on lipids in rats with portacaval anastomosis and bile-duct
ligation compared to respective SHAM-operated controls
Figure 3: page 89
Blood-brain barrier permeability to Evans Blue and sodium fluorescein in frontal cortex
of rats with portacaval anastomosis and bile-duct ligation compared to respective
SHAM-operated controls
Figure 4: page 90
Arterial reactive oxygen species, frontal cortex brain water, liver biochemistry markers
and distance travelled in bile-duct ligation and allopurinol-treated bile-duct ligation rats
compared to respective SHAM-operated controls
Figure 5: page 92
Temporal resolution of ammonia, reactive oxygen species and brain edema in rats with
Third paper
Figure 1: page 113
Circulating reactive oxygen species, glutathione and malondialdehyde in rats with
portacaval anastomosis and sham-operated controls treated and not treated with diethyl
maleate
Figure 2: page 114
Frontal cortex water content in rats with portacaval anastomosis and sham-operated
controls treated and not treated with diethyl maleate
Figure 3: page 115
Cerebral glutathione; malondialdehyde and 4-hydroxy-2- nonenal in rats with portacaval
anastomosis and sham-operated controls treated and not treated with diethyl maleate
Figure 4: page 117
Circulating reactive oxygen species and frontal cortex water in rats with portacaval
anastomosis and sham-operated controls treated with diethyl maleate
Fourth paper
Figure 1: page 137 13
Figure 2: page 140
Effect of AST-120 in bile-duct ligation (BDL) rats compared to treated and non-treated
SHAM-operated controls and non-treated BDL rats
Figure 3: page 142
Effect of dichloroacetate in bile-duct ligation (BDL) rats compared to treated and
non-treated SHAM-operated controls and non-non-treated BDL rats
Figure 4: page 144
Correlations between lactate, glutamine, ammonia and brain edema
Chapter 3
Figure 1: page 170
Serum 3-nitro-tyrosine concentrations for each patient and control Figure 2: page 172
A synergistic effect between ammonia and systemic oxidative stress is proposed in the pathogenesis of brain edema in hepatic encephalopathy
Figure 3: page 184
Mechanism of action of dichloroacetate
Chapter 4
Figure 1: page 189
Pathogenesis of brain edema in minimal hepatic encephalopathy (MHE) during chronic liver disease (CLD).
Abbreviations:
HE: hepatic encephalopathy
MHE: minimal hepatic encephalopathy ALF: acute liver failure
CLD: chronic liver disease ICP: intracranial pressure
TIPS: transjugular intrahepatic portosystemic shunt BBB: blood-brain barrier
AQP: aquaporin
CBF: cerebral blood flow
NH3, NH4+ ammonia, the gas, ion form respectively GA: phosphate-activated glutaminase
GS: glutamine synthetase
AMPA: α-amino-3-hydro-methyl-4-isoxasole-propionic acid NMDA: N-methyl-D-aspartate
GABA: γ-aminobutyric acid ROS: reactive oxygen species SOD: superoxide dismutase
CAT: catalase
GSH: glutathione
XO: xanthine oxidase
TCA cycle: tricarboxylic acid cycle LDH: lactate dehydrogenase MCT: monocarboxylate transporter
MARS: molecular adsorbent recirculating system PCA: portacaval anastomosis
BDL: bile-duct ligation GPB: glycerol phenylbutyrate BCAA: branched-chain amino acids LOLA: L-ornithine–L-aspartate OP: L-ornithine phenylacetate LT: liver transplantation CSF: cerebrospinal fluid
AST: aspartate aminotransferase ALT: alanine aminotransferase SEM: standard error of the mean
SSAO: semicarbazide-sensitive amine oxidase MAO-A: monoamine oxidase A
MAO-B: monoamine oxidase B GR: glutathione reductase GP: glutathione peroxidase GSSG: oxidized glutathione
TBARS: thiobarbituric acid-reactive substances
Da: dalton
NMR: nuclear magnetic resonance PDH: pyruvate dehydrogenase PC: pyruvate carboxylase
DCA: dichloroacetate
Acknowledgements
Je tiens à remercier Dr. Rose de m’avoir fait découvrir la beauté de la recherche médicale fondamentale et de m'avoir soutenu tout au long de mon doctorat.
Je remercie tous les membres du laboratoire Rose, spécialement Mélanie Tremblay, Xiaoling Yang, Jimmy Huynh, Christian Parent-Robitaille et Helen Marin pour leur aide essentielle durant mon parcours et à l’avancement de mon projet.
Je remercie mes collaborateurs, Dr. Keith Anderson, Dr. Roger Butterworth, Dr. Jean Côté, Dr. Nathalie Grandvaux, Dr. Wenlei Jiang et Dr. Claudia Zwingmann de m’avoir partagé leurs expertises et à Richard Mongeau pour son soutien technique.
Je remercie le FRSQ, l'Université de Montréal et le CRCHUM pour le soutien financier. Je remercie le CASL, EASL, ISHEN et COSC pour la reconnaissance de mes travaux de recherche.
1.1 Hepatic encephalopathy
1.1.1 Definition and epidemiology
Hepatic encephalopathy (HE) is a metabolic neuropsychiatric syndrome manifesting by a wide spectrum of symptoms, ranging from mild cognition and attention deficits to coma and death. It represents a major complication of acute liver failure (ALF) as well as of chronic liver disease (CLD). HE is classified in 3 categories depending on the type of liver injury: type A results
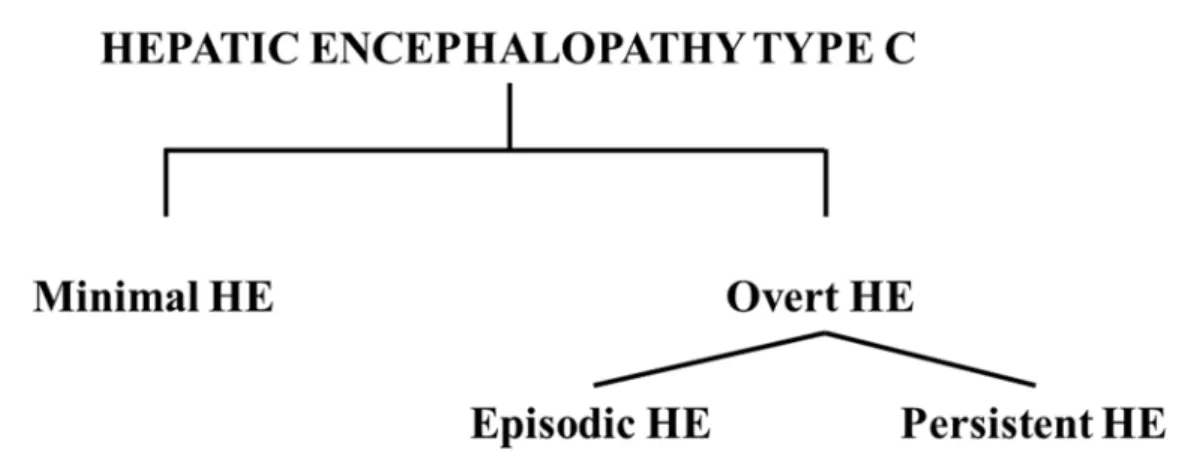
following ALF, type B is induced by portal-systemic bypass and type C is associated with CLD. The latter is further classified by the severity of symptoms in minimal and overt HE (Ferenci et al., 2002).
ALF is a rare condition, affecting around 2000 patients annually in the USA with a stable annual incidence and a mean survival rate of 45%, varying between 10- 65% depending on the cause (Lee, 2012). ALF is defined as a rapid and severe deterioration of a previously healthy liver leading to HE along with jaundice and coagulopathy (Hoofnagle et al., 1995). Close to 55% are a result of drug intoxication (acetaminophen occurring in 46% of cases), with the remaining cases caused by autoimmune hepatitis, acute viral hepatitis (A and B) and 15% unknown. HE induced by ALF, classified as type A HE, is characterized by a rapid, severe deterioration of mental, brain edema and an increase in intracranial pressure (ICP). Brain stem herniation, instigated through intracranial hypertension, is a frequent cause of death in these patients (Bernal et al., 2007; Bhatia et al., 2006; Jalan et al., 2004a).
CLD is defined as a progressive liver function deterioration occurring as a consequence of a persistent hepatic insult such as chronic hepatitis B and C, alcoholic hepatitis or non-alcoholic steatohepatitis (Rosen, 2011; Sanyal et al., 2010; Wang and Beydoun, 2007). The prevalence of these conditions is on the rise and is estimated that 3 million Canadians suffer from liver disease (Canadian Liver Foundation, 2013). In time, over a period of 10-20 years, under the aggression of the hepatic insult, normal liver architecture is replaced by fibrosis and regeneration nodules. This status is defined as cirrhosis which represents the fifth cause of death in Canada (Statistics Canada, 2010). Cirrhosis leads to numerous complications such as portal hypertension, impaired protein
synthesis, multi-organ dysfunction with 50-70% of patients presenting with HE (type C) (Bajaj, 2010). HE in this setting is the result of multiple pathogenic processes: decreased hepatic
detoxification and synthetic capacity, formation of portal-systemic shunts (consequence of portal hypertension) and increased production and release of toxins by the ailing liver. These conditions are favored by numerous precipitating factors such as: infections, dehydration, renal failure, aggravation of the hepatic disease by a novel superimposed hepatic insult, the development of hepatocellular carcinoma, gastrointestinal bleeding, constipation or insertion of a transjugular intrahepatic portosystemic shunt (TIPS) (Munoz, 2008).These conditions lead to a variable clinical picture, classified into minimal and overt HE (figure 1).
The third type of HE is type B which results from portal-systemic shunting (bypass) without the presence of an underlying parenchymal liver disease, a rare condition. However, animal models, such as animals subjected to a portacaval anastomosis, are frequently used to study the effects of gut-derived toxic metabolites by-passing the liver on brain function (Butterworth et al., 2009).
Figure 1. Classification of the subtypes of hepatic encephalopathy type C as described in the text. HE, hepatic encephalopathy.
1.1.1.1 Minimal HE
Minimal HE (MHE), the mildest form of HE, is characterized by neuropsychological and neuropsychiatric changes in the absence of any clinically evident symptoms. The symptoms consist in attention and cognition deficits and psychomotor performance impairments detectable only by neuropsychological and neurophysiological testing (tests such as the psychometric hepatic encephalopathy score, the repeatable battery for the assessment of neuropsychological status, the critical flicker frequency, the inhibitory control test or the EncephalApp, (Bajaj et al., 2013; Córdoba, 2011)). Most tests are time-consuming and not routinely performed during clinical examinations, therefore MHE remains widely underdiagnosed. In spite of the lack of obvious symptoms, MHE strongly impacts the quality of life of the patients, leading to impairments of operating heavy machinery and to an increased risk of having vehicle accidents (Amodio, 2009; Montgomery and Bajaj, 2011). Moreover, MHE patients have a 4-fold increased risk of developing overt HE (Hartmann et al., 2000) as well as a higher probability of leading to persisting neurological complications following liver transplant (Chavarria and Cordoba, 2013).
1.1.1.2 Overt HE
Overt HE is the clinically detectable form of HE. The highly variable and nonspecific
symptomatology has been classified into 4 grades known as the West Haven Criteria (Conn et al., 1977) (table I). Grade 0 represents MHE. Grade I is characterized by sleep-wake rhythm alterations, shortened attention span, lack of awareness; grade II manifests as lethargy, apathy, overt personality changes and disorientation; grade III is defined by somnolence, stupor and severe confusion and grade IV represents the coma stage.
Symptoms may occur in surges (termed episodic HE) or be continuously present (persistent HE). The former is characterized by brief episodes, while the latter by continuous presence of overt HE symptoms.
Table I. West Haven criteria for the grading of hepatic encephalopathy. Modified after Bajaj, 2010 with the publisher's permission.
Grade Consciousness Intellect and behaviour Neurological findings
0 Normal Normal Normal examination; impaired
psychomotor testing 1 Mild lack of
awareness
Shortened attention span; impaired addition or subtraction
Mild asterixis or tremor
2 Lethargic Disoriented; inappropriate behaviour Obvious asterixis; slurred speech 3 Somnolent but
arousable
Gross disorientation; bizarre behaviour
Muscular rigidity and clonus; hyper-reflexia
4 Coma Coma Decerebrate posturing
1.2 Brain edema in liver disease
1.2.1 Brain edema
Brain edema is the result of water accumulation in the brain and may be a consequence of astrocyte or neuronal swelling, but also of an accumulation of water in the extracellular space. The maintenance of a constant volume is critical for cerebral cell homeostasis. Brain edema can occur as a result of either a disruption of the blood-brain barrier (BBB, vasogenic brain edema) or following metabolic alterations which lead to an accumulation of osmolytes within cells followed by the entry of water (cytotoxic brain edema). Brain edema can have a direct effect on cerebral function through physical stress (in addition brain edema can lead to an increase in intracranial pressure (ICP) as the brain lies within a non-compliant skull). Also, changes in cell water may affect signaling cascades, modify the intracellular and cell-to-cell communication or disturb the architecture of the cell or
intracellular compartments (Pasantes-Morales and Cruz-Rangel, 2010).
Vasogenic edema involves the breakdown of the BBB. It is induced following conditions such as traumatic brain injury or neoplasms, where the BBB is physically disrupted, or following
inflammatory and infectious cerebral diseases, where the BBB opens following the agression of inflammatory factors. The BBB is composed of endothelial cells connected by tight junctions, resting on a basal lamina and connected with astrocytes and pericytes (figure 2), structures which, together with neurons, form the neurovascular unit (Hawkins and Davis, 2005). The BBB regulates the passage of molecules from the blood into brain, specifically allowing some through specific channels and transporters. The endothelial cells line the cerebral capillaries and their particularity compared to non-cerebral endothelial cells resides in the abundance of tight junctions proteins (Kniesel and Wolburg, 2000) which restrain the paracellular space (Abbott, 2000) not allowing macromolecules to pass. Pericytes contribute to the stability of the cerebral capillaries (von Tell et al., 2006). Astrocytes are the most abundant cell of the human brain with important roles as a metabolic support for neurons and endothelial cells. Therefore, alterations of the BBB's tight junctions, affecting BBB integrity, allows the free passage of macromolecules (such as circulating proteins) into the cerebral extracellular space thus pulling more water into the brain and causing vasogenic edema (figure 3). The alterations of the BBB are evidenced by two methods. The first one is the direct visualization of the BBB breakdown by electronic microscopy (Kato et al., 1992). The second one consists in infusing intravenously substances that do not normally pass through the BBB, but will pass if a BBB breakdown is present. These substances are detected in cerebral tissue by spectrophotometry, fluorescence, Western Blot or radioactivity measurement. Small molecules such as sodium fluorescein or [14C]-γ-aminobutyric acid may detect small breakdowns, while big
Figure 2. Structure of the BBB. Explanations are provided in the text. After Takeshita and Ransohoff, 2012 with the publisher's permission.
Numerous cerebral metabolic reactions produce osmotic molecules; in the normal brain they are rapidly cleared by enzymatic metabolism or excretion into the blood. However, numerous
pathologies such as cerebral ischemia, infections or diabetic ketoacidosis (Donkin and Vink, 2010; Levin, 2008; Papadopoulos et al., 2000) induce an increase in osmolyte production or impaired clearance, leading to their accumulation into the brain. This hypertonicity will induce an increased water entry into the brain in order to restore the osmotic equilibrium (figure 3) thus inducing cytotoxic brain edema.
Different ion and water transporters located on the BBB contribute to the development of brain edema. One example is the family of bi-directional transmembrane water channels aquaporin (AQP). Of those, particulary AQP4 is highly expressed on the astrocytic end-feet (Amiry-Moghaddam et al., 2004) and plays an important role in the development of brain edema in traumatic brain injury, tumors and cerebrovascular disease (Badaut et al., 2011; Donkin and Vink, 2010; Nico and Ribatti, 2011). Other examples of transporters implicated in inducing brain edema are the NKCC, the Na+-K+-2Cl- co-transporter which maintains an inwardly-directed net ion flux, therefore inducing
brain edema by increasing cell volume (Kahle et al., 2009); the nonselective cation channel (NCCa-ATP), which is regulated by sulphonylurea receptor 1, a nonselective cation channel expressed in all cells of the neurovascular unit only in central nervous system injuries, including cerebral ischemia and traumatic brain injury (Simard et al., 2012).
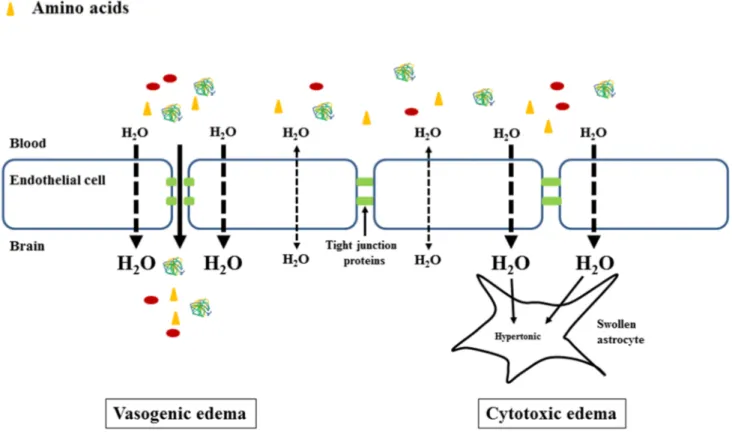
Figure 3. Vasogenic and cytotoxic brain edema. Left panel: vasogenic brain edema appears as a consequence of a physical breakdown of the BBB that allows plasma macromolecules (proteins) and other compounds to cross the BBB and accumulate in the extracellular space followed by an entry of water in attempt to re-establish the osmotic equilibrium and consequently results in brain edema; right panel: cytotoxic brain edema is the result of cellular metabolic alterations that cause an intracellular accumulation of osmotic molecules such as ions and amino acids, followed by an entry of water in order to re-establish the osmotic equilibrium. After Bosoi and Rose, 2013 with the publisher's permission.
1.2.1.1. Intracranial hypertension in ALF and not CLD
Intracranial volume consists of 10% of cerebral tissue, 10% of blood and 80% cerebrospinal fluid (Rengachary and Ellenbogen, 2005). Cerebral water accumulation leads to increased intracranial volume. Since the skull is not compliant an increase in brain volume will lead to an increase in ICP which in turn may trigger brain stem herniation and death (a frequent cause of death in ALF). However intracranial hypertension rarely occurs in CLD. It is believed the degree of brain edema in CLD is "low-grade", not sufficient enough to cause an increase in ICP ((Häussinger et al., 2000), figure 4).
Figure 4. Relationship between brain volume and intracranial pressure (ICP): in chronic liver disease (CLD) a certain increase in brain volume does not lead to an increase in ICP; in acute liver failure (ALF) the water accumulation exceeds the brain volume capacity and leads to an increase in ICP.
Several other explanations for why an increase in ICP is found in ALF and not CLD exist. An increase in cerebral blood flow (CBF) will lead to an increase in brain volume. In ALF an increase in
0 10 20 30 40 50 60 70 80 CLD AL F brain volume In tr a c r a n ia l p r es su re ( m m H g )
CBF is observed (Jalan et al., 2004b; Larsen et al., 1996; Strauss et al., 1997; Wendon et al., 1994), while in CLD it decreases (Almdal et al., 1989; Burra et al., 2004; Dam et al., 1998; Iversen et al., 2009; Iwasa et al., 2000; Trzepacz et al., 1994). Second, since CLD develops over years of hepatic insults, cirrhotic patients are much older than ALF patients, with a median age of 56 years at diagnosis (Fleming et al., 2012) compared to a mean of 38 years in ALF (Ostapowicz et al., 2002). In the aging CLD population, the physiological aging atrophy of the brain, characterized by a steady volume loss, is present (Garcia-Martinez et al., 2011). A smaller brain volume in these patients grants more ‘‘space’’ for expansion in the eventuality of swelling. Therefore, a higher increase in brain volume constituents (compared to ALF) is needed in order for intracranial hypertension to develop in CLD.
1.2.2 Vasogenic versus cytotoxic brain edema in liver disease
Brain edema in liver disease has been widely described. It has been evidenced in HE induced by ALF (Jiang et al., 2009a; Rose et al., 2007) and CLD (Davies et al., 2009; Wright et al., 2007) in different animal models, as well as HE in patients with ALF (Bhatia et al., 2006; Gupta et al., 2010) and cirrhosis (Lodi et al., 2004). Brain edema has also been described in MHE patients, considered to have "low-grade" brain edema since they do not present an increase in ICP (Córdoba et al., 2001; Häussinger, 2006; Häussinger et al., 2000; Kale et al., 2006; Shah et al., 2008; Sugimoto et al., 2008).
Brain edema induced by BBB breakdown (vasogenic edema) has been reported in different animal models of ALF and CLD, but the conclusions are inconsistent. Toxin-induced ALF following galactosamine or azoxymethane administration leads to cerebral extravasation of plasmatic Evans Blue and [14C] alpha-aminoisobutyric acid (Cauli et al., 2011; Dixit and Chang, 1990; Horowitz et al., 1983; Yamamoto and Nguyen, 2006). This effect is probably due to altered tight junctions as modifications of their composing proteins such as occludin, claudin-5, zonula occludens 1 and 2 were demonstrated (Chen et al., 2009; Lv et al., 2010; Sawara et al., 2009; Shimojima et al., 2008). However, other reports in the same models performed in other animal species demonstrated a lack of
extravasation of horseradish peroxidase (Traber et al., 1987) and observed a microscopically intact BBB (Alexander et al., 2000; Potvin et al., 1984; Wright et al., 2007). The use of different animal species, various HE models and diverse brain edema evaluation techniques may explain this discrepancy and therefore further investigations looking into BBB integrity in liver failure/disease are warranted.
On the other hand, cytotoxic evidences of brain edema are well described. Alterations in
numerous metabolites, such as lactate and glutamine, are well known to play a role in inducing brain edema (Chavarria et al., 2010; Zwingmann et al., 2004). Moreover, these alterations have been proven both in vitro and in ALF and CLD animal models, but also in patients due to the development of non-invasive advanced magnetic resonance imaging techniques (for review see (McPhail et al., 2012)).
The neuropathology of HE involves swelling of the astrocytes, while neurons are resistant to the accumulation of water. Electron microscopy studies showed the cell most affected by swelling to be the astrocyte (Kato et al., 1992; Traber et al., 1987; Wright et al., 2007), while only one study
demonstrated neuronal swelling (Kristiansen et al., 2010). In CLD, astrocytes present a characteristic morphology, named Alzheimer type II astrocytes: they are large, swollen and present enlarged swollen nuclei and cytoplasm, margination of chromatin, mitochondrial and rough endoplasmic reticulum proliferation and accumulation of glycogen (Norenberg, 1977; Wright et al., 2007). Given the metabolic support role of astrocytes for neurons, the accumulation of osmotic metabolites is more likely to occur in astrocytes than in neurons. Moreover, differences in mechanisms of volume regulation such as osmotic gradients and membrane channels ionic fluxes (Kelly and Rose, 2010; Olson and Li, 2000) between neurons and astrocytes explain why astrocytes are more prone to swelling (Pasantes-Morales and Cruz-Rangel, 2010). In regard to this, Nase et al. demonstrated that hypo-osmotic stress in normal mice induces an increased water entry only in astrocytes, not in neurons (Nase et al., 2008).
1.3. Pathogenesis of hepatic encephalopathy and brain edema
1.3.1
Ammonia
Genetic, environmental factors and type of liver disease may all impact the clinical
manifestations of HE. However, ammonia has been long considered the main pathogenic factor involved in HE, since high ammonia concentrations lead to neurotoxicity (Felipo and Butterworth, 2002). Ammonia is produced in large quantities by the gastrointestinal system and efficiently removed by the hepatic urea cycle.
1.3.1.1 Ammonia chemistry and metabolism
Ammonia exists either as a gaseous weak base (NH3), or as an ion (NH4+), forms which are in equilibrium depending on the pH accordingly to the Henderson-Hasselbach equation:
log10[NH3 /NH4+] = pH – pKa, where pKa is the acid dissociation constant.
At the physiological pH, 98% of ammonia is in its ionic form and 2% is gaseous. Both ammonia forms can cross any membranes, NH3 by freely diffusing through the phospholipid layer of cells. NH4+ however, has similar ionic properties with the K+ ion, therefore it crosses membranes using K+ channels and transporters, such as inward rectifying and voltage-gated K+ channels or Na+/K+ and H+/K+ ATP-ase (Moser, 1987) and Na+/K+/Cl- cotransporters (Aickin et al., 1982; Kelly et al., 2009). In addition, ammonia can also be transported through membranes by specific ammonia transporters, the nonerythroid Rhesus (Rh) glycoprotein B (RhBG) and C (RhCG) (for review see (Bakouh et al., 2006)), as well as by the aquaporin-8 channel (Saparov et al., 2007). Through these chemical properties, ammonia has a direct effect on the cell pH, membrane potential and cellular metabolism (Bosoi and Rose, 2009).
NH4+ is a substrate as well as a product of numerous metabolic reactions. The primary source of ammonia in the body is the gut either by enterocytes where glutamine is deaminated to glutamate by the phosphate-activated glutaminase (GA) or by intestinal bacteria through urealysis and protein
deamination. Further, ammonia is absorbed into the portal system and is filtered through the liver, which represents the main ammonia removing organ due to the presence of the urea cycle which maintains circulating concentrations of ammonia within 35-65 μM.
Other organs important in maintaining the homeostasis of ammonia are the muscle, the kidney and the brain. The muscle has a high protein and amino-acid turnover, therefore it contains numerous enzymes that metabolize ammonia. The most important is glutamine synthetase (GS) which
incorporates ammonia into glutamate to form glutamine. The kidney contains both GA and GS, however its main role in ammonia metabolism is NH4+ excretion in order to maintain the urinary pH, as well elimination of liver-derived urea.
Ammonia metabolism in the brain has some particularities. GS is found exclusively in
astrocytes (Martinez-Hernandez et al., 1977), while GA is primarily found in the neurons, forming the glutamate–glutamine metabolic cycle between astrocytes and neurons. This cycle is important in recycling the glutamate released from neurons in the synaptic cleft, thus preventing neuronal
excitotoxicity (Cooper, 2001). Astrocytes take up the glutamate by excitatory amino acid transporters (EAAT1 and EAAT2, (Gegelashvili et al., 2007; Rothstein et al., 1994)), and then converted it to glutamine through GS. Then, the non-neuroactive glutamine is released into the extracellular space through glutamine transporters (N and ASC-system transporter SN-1, SN-2 and ASCT2 (Chaudhry et al., 1999; Cubelos et al., 2005; Dolińska et al., 2004)), from where is uptaken by neurons (sodium-coupled amino acid transporter, SAT/ATA (Varoqui et al., 2000)), and
transformed to glutamate by GA.
1.3.1.2 Ammonia metabolism during liver failure
During ALF or CLD, several mechanisms lead to an increase in circulating ammonia which may reach up to 1.5 mM in ALF (Jiang et al., 2009a; Rose et al., 2007), and presents around a 2-3-fold increase in CLD, up to 150-200 µM (Montoliu et al., 2011; Ong et al., 2003). First, cirrhotic patients present a switch of normal gut flora to ammoniagenic bacteria, therefore leading to an
increase in intestinal ammonia production (Romero-Gómez et al., 2009). Moreover, intestinal GA increases (Jover-Cobos et al., 2014; Romero-Gómez et al., 2004). Secondly, hepatic fibrosis induces portal hypertension and formation of portal-systemic shunts, therefore the portal blood bypasses the liver and its ammonia content fails to be detoxified by the liver. Thirdly, due to hepatocyte necrosis urea production is impaired and the ammonia contained by the portal blood reaching the liver is released into the hepatic veins and into the systemic circulation.
As a consequence of hyperammonemia, an increase of ammonia is seen in every organ and compensatory mechanisms are developed. The muscle presents an elevation of ammonia uptake (Bessman and Bessman, 1955) as well as an increase in GS activity (Desjardins et al., 1999; Jover-Cobos et al., 2014), leading to excess glutamine formation (Chatauret et al., 2006). These
mechanisms however, do not suffice in order to obtain an efficient whole-body ammonia removal; in addition glutamine can be converted back to ammonia and glutamate by GA (Wright et al., 2011). On the other hand, the kidney does not excrete more ammonia during hyperammonemia (Tyor et al., 1960), instead it becomes an ammonia producer through increased GA activity (Dejong et al., 1993; Olde Damink et al., 2003).
1.3.1.3 Cerebral metabolism and neurotoxicity of hyperammonemia
During hyperammonemia, ammonia crosses the BBB (both as an ion and as a gas) and
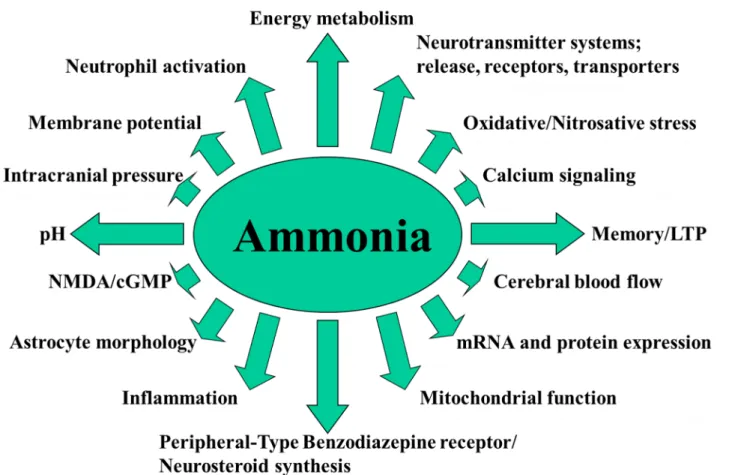
increased cerebral ammonia exerts numerous toxic effects by affecting membrane potential, calcium signaling, cellular pH, metabolism as well as mRNA and protein expression (Bosoi and Rose, 2009). Inflammation, oxidative/nitrosative stress, energy metabolism alterations will ensue leading to impairment of neurotransmitter systems, cerebral blood flow, astrocyte morphology, mitochondrial function and other ((Bosoi and Rose, 2009), figure 5).
High ammonia concentrations have been shown to be toxic to other organs, including the liver, the skeletal muscle, the respiratory and gastrointestinal tracts (Jia et al., 2014; Qiu et al., 2013; Seo et al., 2011; Wise et al., 2013). However, ammonia's neurotoxicity remains particularly dangerous due
to underlying mechanisms that remain incompletely understood. A possible explanation for the brain being so sensitive to ammonia might be the fact that it is a huge energy consumer (20% of the body's energy for an organ representing 2% of the body weight). Ammonia has been shown to trigger direct alterations to the TCA cycle, by inhibiting enzyme α-ketoglutarate dehydrogenase (Lai and Cooper, 1986). At the same time, ammonia increases the glycolysis flux, by stimulating phosphofructokinase activity (Lowry and Passonneau, 1966). In spite of these alterations, ATP levels remain unchanged during ammonia intoxication and ALF (Fitzpatrick et al., 1988; Mans et al., 1994).
Figure 5. Neurotoxic effects of ammonia. After Bosoi and Rose, 2009 with the publisher's permission.
reaction leads to an excess of glutamine, considered an osmotic molecule important in the
development of brain edema (astrocytic swelling, (Brusilow and Traystman, 1986)). Intracellular accumulation of glutamine will lead to a decrease in glutamate and other osmolytes such as taurine and myo-inositol and to disturbances of other amino acids such as aspartate and alanine (Heins and Zwingmann, 2010; Zwingmann, 2007; Zwingmann et al., 2003).
In ALF, high arterial ammonia concentrations are correlated with increased ICP and cerebral herniation (Clemmesen et al., 1999). However, a correlation between ammonia levels and severity of HE in CLD is weak (He et al., 2011; Kundra et al., 2005; Nicolao et al., 2003; Ong et al., 2003; Weissenborn et al., 2007; Wilkinson et al., 2011) therefore suggesting pathogenic factors other than ammonia are involved in the pathogenesis of brain edema and HE in CLD.
1.3.1.4 Impairment of neurotransmitter systems induced by ammonia
Whether neurotransmitter disturbances play a causal or causative role in the pathogenesis of HE is still debated. However, neurotransmitter disturbances are important cerebral dysfunctions seen in HE that explain the clinical manifestations characterizing the syndrome. Neurotransmitter
metabolism is strongly related to cerebral ammonia levels; therefore neurotransmitter disturbances are an important chapter in ammonia neurotoxicity. Moreover, differential regulation in different brain regions of neurotransmitters and their receptors may explain the heterogenous symptoms seen in different HE patients.
Glutamate
Glutamate is the main excitatory neurotransmitter in the brain. As explained above, glutamate is directly linked to the metabolism of ammonia through the enzyme GS. As a consequence cerebral glutamate levels decrease during HE, as it is consumed in order to detoxify ammonia into glutamine. In spite of that, synthesis of glutamate and its synaptic release are both increased
(Palomero-Gallagher and Zilles, 2013). Glutamate acts on three different ionotropic receptors: α-amino-3-hydro-methyl-4-isoxasole-propionic acid (AMPA), kainate and N-methyl-D-aspartate (NMDA).
These receptors play an important role in synaptic plasticity and long-term potentiation, processes related to learning and memory. HE animal models and human autopsy studies determined AMPA and kainate receptors to have a differential response, as they are either up- or down-regulated in different brain areas (as reviewed by (Palomero-Gallagher and Zilles, 2013)). Therefore, their role remains unknown. On the other hand, NMDA receptors are known to be excessively activated by the extracellular glutamate during acute hyperammonemic conditions leading to activation of the
glutamate – nitric oxide – cyclic guanosine monophosphate pathway and thus to coma and death in cerebellum and cortex of hyperammonemic rats (as reviewed by (Montoliu et al., 2010)). Altered glutamate neurotransmission may explain the learning and memory problems observed in HE patients.
γ-aminobutyric acid
γ-aminobutyric acid (GABA) is the main inhibitory neurotransmitter in the mammalian brain. In HE, an increased "GABAergic tone" is present, which is induced by an increase in cerebral GABA, increased expression of GABA receptors, increased concentration of endogenous benzodiazepine-like compounds known to activate GABA receptors and by ammonia activation of GABA receptors (Cauli et al., 2009a). The GABAA receptor is particulary of interest because, aside being a binding site for GABA, different subunits present different allosteric binding sites for benzodiazepines or neurosteroids. Cerebral endogenous benzodiazepines and neurosteroids are increased during liver disease (Ahboucha and Butterworth, 2005). Their action on the GABAA receptor potentiates the inhibitory effect of GABA contributing to the increased "GABAergic tone", characterized by sedative and anxiolytic effects.
Acetylcholine
Acetylcholine is a neurotransmitter with functions in the peripheral nervous system (as main muscle activator), in the autonomic nervous system and in the central nervous system where it modulates plasticity, arousal and reward. Moreover, acetylcholine suppresses the inhibition of GABA. In cirrhotic patients and rats, cerebral acetylcholine levels are reduced as a consequence of an increase in acetylcholinesterase, the enzyme responsible for metabolizing acetylcholine
(García-Ayllón et al., 2008). This decrease results in a reduced GABA inhibition, thus contributing to the increase in the “GABAergic tone” seen in HE.
Histamine and serotonin
These two monoamines are neurotransmitters important in the regulation of sleep and circadian rhythm. They interact with each other: serotonin stimulates histamine release (Laitinen et al., 1995) and histamine inhibits serotonin release through H3 receptors (Schlicker et al., 1988). Increased cerebral histamine levels have been found both in vivo and post mortem in patients with HE, along with an increase in extracellular serotonin levels in several rat models of HE and a decrease in histamine H3 receptors (as reviewed by (Palomero-Gallagher and Zilles, 2013)). The increase in histamine is related indirectly to hyperammonemia by an increase in cerebral neutral aminoacid transport through the BBB determined by increased glutamine (Cascino et al., 1982). Serotonin levels are correlated with the degree of portacaval shunting and to ammonia levels in a rat model of HE (Lozeva et al., 2004). These changes in histamine and serotonin lead to the sleep-wake rhythm alterations and somnolence seen in HE patients.
1.3.2 Oxidative stress
Oxidative stress (OS) is defined as an imbalance between the production and detoxification of free radicals leading to an increase in reactive oxygen species (ROS), such as hydrogen peroxide (H2O2), hydroxyl radical (.OH), superoxide ion (O2.-) and peroxynitrite (ONOO-). ROS play an important role in cell signaling (Valko et al., 2007). They are constantly produced during oxygen metabolism by oxidant enzymes, such as NADPH-, xanthine-, monoamine-, and aldehyde-oxidase or nitric oxide synthetase and rapidly metabolized by ubiquitary antioxidant enzymes such as
superoxide dismutase (SOD) and catalase (CAT), or ROS neutralizing molecules, such as glutathione and albumin.
ROS are highly reactive due to the presence of unpaired valence shell electrons. In excess, they react with cellular molecules such as proteins, lipids and nucleic acids. This leads to functional
alterations of enzymes, transporters and receptors (Stadtman and Levine, 2000), alterations in membrane permeability (Poon et al., 2004) and abnormal gene translation and protein synthesis. Since they are highly reactive, ROS do not cross the BBB, instead they might contribute to increased BBB permeability by modifying transporters located at this level (as detailed in chapter 2.1), by modifying membrane lipids or activating different signaling pathways (Pun et al., 2009).
Since systemic OS is present in liver disease and ammonia toxicity has been shown to induce ROS in the brain, a thorough investigation in relation to HE is warranted.
1.3.2.1 Systemic oxidative stress and liver disease
OS in liver disease represents a systemic phenomenon not only in the stage of cirrhosis, but long before, since the stage of hepatitis, whether the etiology is viral, alcoholic or autoimmune (Ikegami et al., 2014; Kaffe et al., 2015; Wang et al., 2012). OS is known to be induced directly by the hepatitis C virus or by alcohol (Koike, 2014; Wang et al., 2012). However, the systemical persistence of OS in these patients is associated with the progression to liver fibrosis, cirrhosis and development of hepatocellular carcinoma (Choi et al., 2014).
During liver disease, both a decrease in antioxidants and an increase in systemic oxidants are observed. The liver is responsible for synthetizing the major antioxidants glutathione and albumin. Glutathione (GSH) represents the main intracellular antioxidant and although it is produced by every cell, the liver synthetizes it in large quantities. During CLD, GSH synthesis significantly decreases due to hepatocyte necrosis which leads to a decrease in glutamate-cysteine ligase and glutathione synthetase, enzymes in the GSH synthesis pathway (Yang et al., 2009). Another important
antioxidant produced by the liver is albumin, the most abundant plasmatic protein which possesses multiple cysteine and methionine residues (Roche et al., 2008). Liver disease results in decreased protein synthesis and a significant reduction in albumin levels (Chen et al., 1997).
Xanthine oxidase (XO) is an oxidant enzyme highly expressed in the liver. Following
hepatocyte necrosis, XO is released into the systemic circulation where it oxidizes hypoxanthine and xanthine to uric acid, releasing H2O2. XO is increased in plasma of cirrhotic patients (Battelli et al.,
2001). Moreover, XO inhibition with allopurinol has been previously demonstrated to reduce systemic OS in stable cirrhotic patients (Spahr et al., 2007). The increase in XO, along with the decrease in antioxidants leads to increased systemic ROS during CLD (Chen et al., 1997; Ljubuncic et al., 2000).
1.3.2.2 Cerebral oxidative stress and hepatic encephalopathy
Cerebral OS in HE is considered to be the result of ammonia neurotoxicity (Häussinger and Görg, 2010; Norenberg et al., 2004), but whether it may also be triggered by systemic OS remains to be determined.
One of the toxic effects of ammonia in the brain is induction of OS. In vitro, high ammonia concentrations (> 5mM) lead to the generation of ROS in astrocyte cultures (Görg et al., 2008; Jayakumar et al., 2006; Mehrotra and Trigun, 2012; Murthy et al., 2001). In vivo, acute ammonia intoxication (intraperitoneal administration of ammonium acetate to naïve rats at a high
concentration of 12 mmol/kg; sacrificed after 11 minutes) leads to an increase in cerebral ROS due to increased xanthine-, monoamine-, and aldehyde-oxidase accompanied by decreased activities of SOD, CAT and GP (Kosenko et al., 2003). In ALF rats following hepatic devascularisation, high hyperammonemia and brain ammonia are accompanied by the development of brain edema and severe HE (coma stage); systemic and central OS are associated features (Jiang et al., 2009a).
These evidences suggest a direct relationship of ammonia and cerebral OS in the pathogenesis of HE related to ALF, however such a relationship and its underlying mechanisms in CLD and MHE remains undefined. Moreover, the relationship between systemic ROS and ammonia also remains unknown.
1.3.3 Lactate
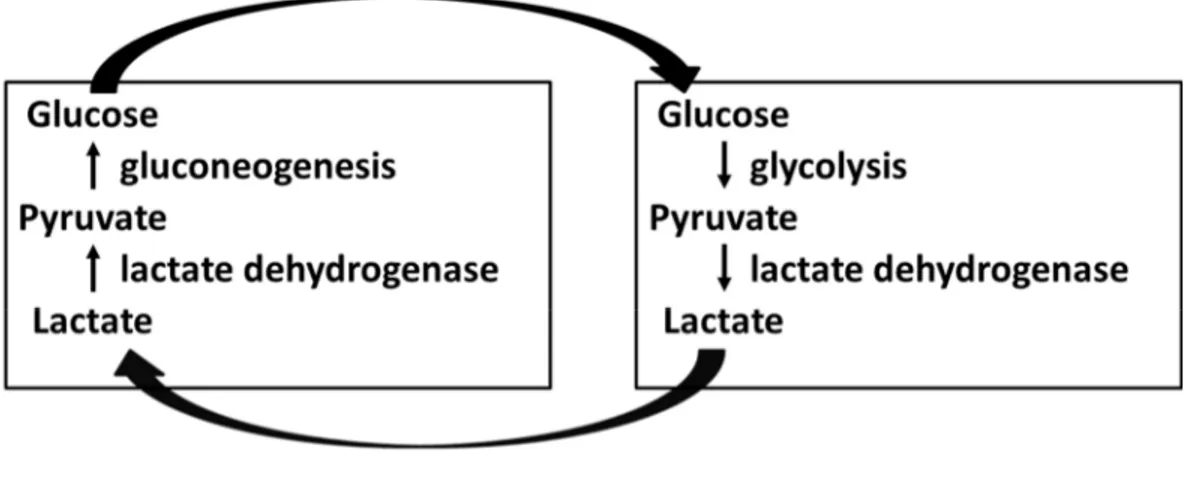
forming the lactate ion. It is produced in every cell from pyruvate via a reversible reaction catalyzed by the enzyme lactate dehydrogenase (LDH), which involves the oxidation of NADH to NAD+. 1.3.3.1 Lactate metabolism
Glucose-derived pyruvate (via glycolysis) is a substrate of the tricarboxylic acid (TCA) cycle, the metabolic hub of the cell and final common pathway for the aerobic oxidation of fuel molecules. The conversion of pyruvate to lactate during anaerobic situations (such as exercise or hypoxia) is needed in order to regenerate NAD+ which allows the glycolytic pathway to function (figure 6). Muscle-derived lactate is metabolized in the liver via gluconeogenesis which will return to fuel other organs, including the muscle, completing the Cori cycle ((Woll and Record, 1979), figure7).
Imbalances between lactate production and removal lead to lactic acidosis, a serious condition characterized by a low plasmatic pH which may impair all systems leading to severe respiratory, cardiovascular and neurological symptoms.
Figure 7. The Cori cycle. Explanations are given in the text.
In the brain, glucose is traditionally considered the only fuel molecule; however, new evidence demonstrates that lactate is a preferred oxidative energy substrate over glucose by neurons (as reviewed by (Pellerin and Magistretti, 2012)). This theory is known as the “astrocyte-neuron lactate shuttle” (ANLS) and it states that lactate is primary produced by astrocytes, released extracellularly and taken up by neurons where it is used a fuel for the TCA cycle (Pellerin et al., 2007; Schurr, 2006).
The ANLS is supported by the different localizations of specific transporter and enzyme isoforms involved in lactate metabolism of astrocytes and neurons. As astrocytes are part of BBB, they come in close contact with the cerebral capillaries and therefore are the first “brain” cells to take up blood-derived glucose. Astrocytes play a metabolic supportive role for neurons as they produce and release molecules required by neurons. Different isoforms of LDH enzymes and lactate transporters have different isoforms in astrocytes and neurons: astrocytes express LDH5 and monocarboxylate transporters MCT1 and MCT4, while neurons LDH 1 and MCT2 with a higher affinity for lactate than the astrocytic isoforms. This suggests astrocytes are better equipped to produce and release lactate, while neurons to take up and metabolize lactate in back into pyruvate to fuel the TCA cycle (for review see (Pellerin and Magistretti, 2012)).
1.3.3.2 Lactate and liver failure
Increased plasmatic lactate is present in animal models of ALF (Chatauret et al., 2003; Rose et al., 2007) and is considered a prognostic marker in patients with ALF (Bernal et al., 2002). In CLD, hyperlactatemia correlates with the severity of cirrhosis (Jeppesen et al., 2013) and is associated with mortality (Tas et al., 2012; Zauner et al., 2000). The role of systemic lactate in MHE has not been evaluated.
Several factors contribute to hyperlactatemia during CLD: (i) impaired Cori cycle consequent to hepatic necrosis (Levraut et al., 1998; Woll and Record, 1979), (ii) increased lactate release from necrotic hepatocytes (Clemmesen et al., 1999); and (iii) increased extra-hepatic lactate production following multi-organ dysfunction (Bernal et al., 2002).
1.3.3.3 Lactate and hepatic encephalopathy
In ALF patients, increased cerebral lactate is correlated to severe HE (brain edema, intracranial hypertension and coma) (Tofteng et al., 2002) or rats (Chatauret et al., 2002; Zwingmann et al., 2003). Ammonia-lowering therapies such as hypothermia, ornithine phenylacetate and the albumin hepatic dialysis system (MARS, Molecular Adsorbent Recirculating System) have shown to reduce cerebral lactate along with brain edema and the development of severe HE in ALF (Chatauret et al., 2002; Rose et al., 2007; Sen et al., 2006).
Contrary to ALF, the role of lactate in HE and CLD is poorly known. A 1.37-fold increase in cerebrospinal fluid lactate has been described in patients with end-stage liver disease and
overt/severe HE (grades 3 and 4) (Yao et al., 1987). However the role of cerebral lactate in the pathogenesis of brain edema and MHE is unknown. Moreover, it still remains unclear whether lactate is a cause or a consequence of HE (Rose, 2012).
1.3.4 Glutamine
Glutamine is one of the 20 amino acids encoded by the standard genetic code. Also, glutamine is the most abundant plasmatic amino acid (Brosnan, 2003). Its metabolism is strongly related to NH4+ since it is formed from glutamate and ammonia by the enzyme GS (present in the brain, the liver and the muscle) and degraded by the enzyme GA back to glutamate and ammonia (present in the brain, the intestine, the kidney and the liver), as explained above (chapter 3.1.2). Along with glutamate, N-acetylaspartate, creatine and myo-inositol, glutamine is one of the major cerebral osmolytes, accounting for approximatively 10-15% of the cerebral osmolar pool (Pasantes-Morales and Cruz-Rangel, 2010) (table II)
Table II. Rat and human brain organic osmolyte content (mM). Modified after Pasantes-Morales and Cruz-Rangel, 2010 with the publisher's permission.
Osmolyte Rat brain Human brain Glutamate 10–15.4 7.5–9.5
N-Acetylaspartate 7.5–10 8.8–8.9
Creatine/P-Creatine 6.6–9.7 7.4–8.4
Myo-inositol 3.3–5.8 6.5–9.0
Glutamine 3.4–5.1 5.0–5.9
1.3.4.1 Glutamine metabolism during hyperammonemia
Glutamine represents the end-product of ammonia detoxification during CLD and
hyperammonemia. Therefore, an increase in both plasmatic and cerebral glutamine is observed in animal models as well as ALF patients (Chatauret et al., 2002; McConnell et al., 1995; Zwingmann et al., 2003), but also in animal models and CLD patients (Fries et al., 2014; Hourani et al., 1971; Laubenberger et al., 1997; Lavoie et al., 1987), including patients with MHE (Singhal et al., 2010;
Taylor-Robinson et al., 1999).
ALF following liver devascularisation in the rat induces a significant increase of expression and activity of GS in the muscle and a decrease in the cortex, whereas glutamine levels remain increased in both organs (Chatauret et al., 2006). Hyperammonemia induced by portacaval shunt in the rat shows the same pattern: GS is reduced in the brain (cortex and cerebellum) and increased in the muscle (Desjardins et al., 1999). Moreover, an increase in GA activity both in the muscle and in the brain is described in cirrhotic rats (Jover-Cobos et al., 2014). This means that, during
hyperammonemia, the muscle becomes an important organ in ammonia detoxification into glutamine; however glutamine metabolism through GA leads to the production of ammonia (the reverse reaction). Meanwhile in the brain in spite of the compensatory reduction in GS glutamine levels remain high (Cordoba et al., 1996). This effect is the result of trying to balance the neurotoxic effects of ammonia and those of glutamine which will be detailed below.
1.3.4.2 Glutamine neurotoxicity
Glutamine is harmful to the brain as it is an osmolyte considered important in the development of brain edema but also by direct neurotoxic effects.
Firstly, glutamine is considered an osmolyte important in the development of brain edema (Brusilow and Traystman, 1986). Several studies demonstrated a correlation of glutamine with severity of HE (Hourani et al., 1971; Laubenberger et al., 1997). Moreover, pre-treatment of cultured astrocytes with the irreversible GS inhibitor, methionine sulfoximine (MSO), results in an
attenuation of the increase in glutamine and also of swelling (Norenberg and Bender, 1994). Similar results have been observed in vivo following ammonia-infusion in portacaval shunted rats pre-treated with MSO (Master et al., 1999; Willard-Mack et al., 1996). Although this evidence supports an important role of glutamine in the development of brain edema, ammonia-lowering treatments, which significantly attenuate brain edema in animal models of ALF, do not induce a decrease of cerebral glutamine levels (Ytrebø et al., 2009; Zwingmann et al., 2004). Normally, the increase in
glutamine is followed by a decrease in other cerebral osmolytes such as myo-inositol and taurine (Cordoba et al., 1996). However, this mechanism is not able to fully rebalance the osmotic equilibrium during severe HE related to ALF (Zwingmann, 2007).
Secondly, glutamine has been shown to accumulate in mitochondria, impairing its function by mechanisms involving OS. The mechanism by which glutamine exerts its toxic effects in astrocytes was proposed as the “Trojan horse” hypothesis by Dr. Albrecht and Dr. Norenberg. They state that mitochondrial metabolization of glutamine to ammonia and glutamate by GA facilitates the
glutamine transport in excess from the cytoplasm to mitochondria (as the Trojan horse) serving as a carrier of ammonia (Albrecht and Norenberg, 2006). Although this hypothesis remains highly disputed, some evidences link glutamine to OS and swelling. In vitro, glutamine induces the mitochondrial transition pore, resulting in a sudden increase in permeability of the mitochondrial membrane to osmolar molecules less than 1500 Da followed by swelling of cultured astrocytes (Pichili et al., 2007; Ziemińska et al., 2000). Moreover, MSO treatment reduces ROS formation in ammonia-treated astrocytes suggesting a direct role of glutamine in inducing OS (Murthy et al., 2001). The role of these mechanisms in vivo remains to be determined in the future.
1.4. Models of hepatic encephalopathy
1.4.1 In vivo models
HE animal models are classified corresponding to the classification of HE into types A, B and C ((Ferenci et al., 2002), detailed in chapter 1.1).
Several species are used to induce similar manifestations as those seen in humans. Large animals such as pigs have the advantages of obtaining high quantities of samples, providing repetitive sampling and using human compatible therapeutic strategies such as hepatic dialysis devices. Small animals such as mice or rats are largely used because of the availability of information (atlases, literature, specific antibodies or transgenic models) and of the low cost
(Butterworth et al., 2009).
1.4.1.1 Chronic hepatic encephalopathy models (types B and C)
Different models available for the study of type B and C HE are discussed below.
Type B hepatic encephalopathy models
Portal-systemic shunt (or anastomosis, PCA, figure 8) allows gut-derived toxins such as ammonia to bypass the liver, to enter the systemic circulation and affect the brain. This model permits the study of hyperammonemia alone, without factors released by an ailing liver. PCA rats survive long term and present with normal liver function markers and behavior alterations
(Butterworth et al., 2009).
Figure 8. Portacaval anastomosis (PCA).
Type C hepatic encephalopathy models
The ideal animal model of type C HE should present all features of cirrhosis: liver function and histopathology alterations, jaundice, portal hypertension, portal-systemic shunting. The two most
frequent etiologies of cirrhosis are alcoholic and viral, however it is difficult to induce liver disease by administering these factors to animals. Nevertheless, manifestations and complications of cirrhosis arise independent of the etiology (Anand, 1999) and several toxin-induced and bile duct ligation (secondary biliary cirrhosis) are well characterized animal models.
Hepatic toxins are used to induce CLD in animal models. They act through several mechanisms but have a poor reproducibility as a major disadvantage. The most frequent used toxins are:
Carbon tetrachloride is a toxin inducing hepatic necrosis through mechanisms which involve OS. Administered daily to naïve rats until the development of ascites (between 8 and 19 weeks), it reproduces the features of cirrhosis and increased ammonia levels (Miquel et al., 2010). However the difficulty of daily dose adjustment to body weight, the long duration of the model and a wide variability limit the utilization of this model (Butterworth et al., 2009);
Thioacetamide is a thioamide used as a source of sulfide ion in chemistry. Administered for a period of 20 weeks in rats, it increases circulating liver function markers and it alters behavioral tests along with elevation of ammonia blood levels (Kawai et al., 2012);
Bile duct ligation (BDL, figure 9) in the rat or mouse also reproduces the features of cirrhosis. Moreover, the animals develop MHE: hyperammonemia, inflammation, OS, behavior alterations and edema are present (Jover et al., 2006). This model becomes an overt HE model following
administration of different pathogenic factors such as ammonia or LPS (lipopolysaccharide, a bacterial toxin which induces inflammation) (Jover et al., 2006; Wright et al., 2007).
Figure 9. Bile-duct ligation (BDL).
At this moment, no experimental animal reproduces perfectly the HE pathology seen in humans. However, available models help understand the pathogenic mechanisms of HE, studying the relation between different factors and testing new therapeutic options.
1.4.1.2 Acute hepatic encephalopathy models (type A)
ALF is not the focus of this thesis. However, some of the mechanisms we investigated have been previously described in different ALF animal models. Therefore a short description of these models merits to be mentioned. Two main types of models are available for the study of HE during ALF: anhepatic and toxic models. Since several organs are affected by ALF, several parameters including temperature and glycaemia must be monitored and corrected because they may affect the time course of the model (Vaquero et al., 2005).
Anhepatic models
This category excludes the liver from circulation through surgery. The hepatic devascularization implies the derivation of the portal blood flow into the systemic circulation (portacaval anastomosis,