HAL Id: dumas-01104909
https://dumas.ccsd.cnrs.fr/dumas-01104909
Submitted on 19 Jan 2015HAL is a multi-disciplinary open access archive for the deposit and dissemination of sci-entific research documents, whether they are pub-lished or not. The documents may come from teaching and research institutions in France or abroad, or from public or private research centers.
L’archive ouverte pluridisciplinaire HAL, est destinée au dépôt et à la diffusion de documents scientifiques de niveau recherche, publiés ou non, émanant des établissements d’enseignement et de recherche français ou étrangers, des laboratoires publics ou privés.
The Determinants of Household Demand for Mobile
Broadband in Indonesia
Sofwan Hakim
To cite this version:
Sofwan Hakim. The Determinants of Household Demand for Mobile Broadband in Indonesia. Eco-nomics and Finance. 2014. �dumas-01104909�
The Determinants of Household Demand for
Mobile Broadband in Indonesia
Presented and Defended by: Sofwan HAKIM
Université Paris 1 – UFR 02 Sciences Économiques
Master 2 Recherche Économie Appliquée
Supervised by: Angelo Secchi
June 06, 2014
Abstract
Based on the Global Information Technology 2013 report, mobile broadband user in Indonesia is increasing at 70% per year as well as internet users will grow from 55 million in 2012 to 125 million in 2015, which is expected to accelerate as Unfortunately, there are still drawbacks in understanding of potential benefits from widespread access to mobile broadband due to the lack of government efforts as well as studies in capturing demand of mobile broadband nationwide. The study concludes that income plays a less important role in its effect on mobile broadband access than geographical area, indicating that affordability is not an issue to further develop broadband. The importance of geographical characteristics confirms the studies by Rappoport (2002) and Steinberg, Degagne and Dough (2008). The fact that urban areas, and Java and its cities, are more developed in terms of broadband development leads to a need to develop infrastructure more evenly throughout the country.
L’université de Paris 1 Panthéon-Sorbonne n’entend donner aucune approbation ni désapprobation aux opinions émises dans ce mémoire: elles doivent être considérées
comme propre à leur auteur.
The University of Paris 1 Panthéon-Sorbonne neither approves nor disapproves of the opinions expressed in this dissertation: they should be considered as the author’s
own.
i
Table of Contents
Table of Content i
List of Figure and Table ii
1.
Introduction 11.1 Background 1
1.2 Motivation and Research Objectives 3
1.3 Research Questions 4
2.
Country Overview and Macro Level Perspectives on the Telecommunication Sector5
2.1 Market Structure and Market Dynamics 6 2.2 Infrastructure: Availability, Usage and Quality 10
3.
Literature Review 143.1 The important role of ICT 14 3.2 The Demand of Mobile Broadband 16
4.
Empirical Strategy, Data and Results 194.1 Empirical Strategy 19
4.2 Data 21
4.3 Results 22
5.
Conclusion and Study Limitations 246.
References 267.
Appendix 29
ii
List of Figure
Figure 1. Broadband Penetration 2
Figure 2. Communication Subsector (including broadcasting) percentage of 5 Figure 3. Telecom Industry Revenues from 2007 to 2010 (in USD millions) 6 Figure 4. Subscriber Growth in Fixed, Mobile (Sims) and Broadband from
2004 to 2010 (In Millions)
7 Figure 5. Market Shares of the Key Mobile Operators (number of subscribers) from 2002 to 2009
8 Figure 6. HHI in the Mobile Sector from 2000 to 2010 9 Figure 7. Average Revenue per Minute in Mobile Telecom Services for
Selected Markets in Asia Pacific, 2008 (In USD)
10 Figure 8. International Sub‐marine Cables, Indonesia 10 Figure 9. Domestic Sub‐marine Cables, Indonesia 11 Figure 10. Indonesia’s Broadband Evolution by Technology (number of
subscribers in millions)
12 Figure 11. Blueprint of (proposed) Palapa Ring 13 Figure 12. Chain of the problem of diffusion of ICT in Asia 24
List of Table
Table 1. Demand Equation Estimates 22
1. Introduction
1.1 Background
The transformation of the world economy by the revolution in Information and Communication Technology (ICT) was actually started many years ago, denoted by the invention of the transistor back in the late 1940s (Jalava & Pohjola, 2008). This invention, followed by many others, has brought and contributed to a significant price decline in products and services in the last 50 years. As a result, society at large has witnessed the era of the late 1990s, which was so different from the previous periods, raising the phenomenon of a so-called ‘new economy’. Jalava and Pohjola (2008) assert the importance of the ICT sectors stating that, while the contribution of steam to British economic growth in the nineteenth century was only modest and long-delayed (contributing about 0.01-0.02 percentage points to the growth of labour productivity before 1830 and peaking at 0.4 percentage points in the period 1850-70), the impacts are much smaller than the basis of many recent studies measuring the effects of ICT on the growth of the economy. In this regard, four factors have been identified that stimulate the role of ICT: a rapid improvement in quality, a sharp decline in prices, a convergence in communication and computing technologies, and swift growth of network computing (Pohjola, 2002).
The telecommunication sector has been identified as the driver of economic growth by many previous studies (Cronin, Parker, Colleran & Gold, 1991; Norton, 1992; Madden & Savage, 1998; Dutta, 2001; Nadiri & Nandi, 2011). The important notion of the sector is the existence of the critical mass at which the impact of the sector is highly related to a point that enables further spillover. The study by Roller and Waverman (2001) concluded that the positive impact of telecommunication infrastructure on economic growth is only visible if the critical mass of a 40% penetration rate has been achieved. Thus, the study suggests that the positive impact is only for the OECD countries. Discussing the same aspect, Torero, Chowdhury and Bedi (2002) find different rates of critical mass. By examining a wider sample and time frame, they show that the impact of the network externalities from the telecommunication infrastructure on growth is not linear; the strong relationship is only apparent for the countries whose teledensities are between 5 and 15 % (i.e. high- and low-middleincome countries), hence for the OECD countries, contrary to the previous study, this effect is surprisingly undetectable. The study concludes that the telecommunication infrastructure is believed to enable another industry shift in terms of productivity level. Thus, convergence in the development of telecommunication infrastructure is an important tool in closing the development gap between countries. Granstrand (1999) forecasted that the importance of the device can be related to the “human communication” reason. This assumes that people are becoming increasingly electronic and embedded in telecommunication systems that are more interactive, selective, multimedial and asynchronous at the same time. Mobile telephony is now a growing interest, especially in developing countries, due to the fact that most of these
countries are enjoying the leap-frogging process. The transition to a greater cellular penetration rate is a low-cost, quick and inexpensive way to increase telecommunication penetration (Sridhar & Sridhar, 2004). However, a later study by Gruber and Koutrompis (2011) found that the contribution of the mobile telecommunication infrastructure to economic growth for low penetration countries is found to be smaller than for high penetration countries, suggesting increasing returns from mobile adoption and use.
Regarding to the Internet development, Litan and Rivlin (2001) show that it has created an increase in the level of productivity in the United States economy since the mid-1990s, while the ubiquitous adoption of broadband and the current generation of technologies generate USD 63.6 billion of capital expenditures in the United States economy, according to Crandall, Jackson and Singer (2003). The other studies concluding the importance of broadband can be found in Katz (2009), which suggests that the multiplier of broadband varies between 1.43 and 3.60, and Liebenau et al. (2009) who found that the impact in the United Kingdom created around 280,500 new jobs following a GBP 5 billion investment in broadband deployment. The Strategic Network Group (2003) also estimated that the impact of the investment in fibre optic networks in a small city in Florida can be investigated through the effect of new job creation, expansion of commercial facilities, increased revenue and decreased cost.
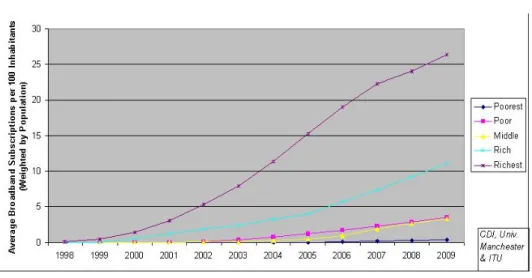
With regard to the current development of broadband deployment, the gap between high-income countries and lower high-income countries is clearly visible. The high-high-income countries had achieved a 20 percent penetration rate by the end of 2007, with the upper middle obtaining 5 percent of the penetration rate. The lower middle income and lower income were left behind with a 1 percent penetration rate. Figure 1 shows the disparity in broadband penetration between the groups
Figure 1. Broadband Penetration
From Figure 1 it can be concluded that without accelerating the supply and demand for broadband access, developing countries require more time to catch up with the broadband
sector gap. Therefore, the investigation to determine the factors that affect broadband access is important, especially in answering which factors play important roles between the demand side and the supply side. Moreover, the need to investigate the impact of broadband development is also important, as the issue is relatively recent for developing countries, which has meant that fewer investigations have been conducted in country-to-country analyses and case studies.
Based on the Global Information Technology 2013 report, mobile broadband user in Indonesia is increasing at 70% per year as well as internet users will grow from 55 million in 2012 to 125 million in 2015, which is expected to accelerate as nationwide. Having achieved a penetration rate for mobile phones of 70 percent at the end of 2009, it is believed that mobile broadband is an effective device to narrow the gap between digital connections in Indonesia. Sabry (2010) argued that mobile telephony is the preferred broadband technology in emerging markets due to the ability to offer a quick and easy approach to address broadband demand. Given the limited capacity of maximum throughput, however, a fixed technology scale should also be developed for high-density areas and greater bandwidth demand, as the complementary policy. Unfortunately, there are still drawbacks in understanding of potential benefits from widespread access to mobile broadband due to the lack of government efforts as well as studies in capturing consumer preferences of mobile broadband. Therefore, there is a need to measure the broadband access, especially for the mobile telephony device, regarding dispersion of technology and infrastructure development to capture variety of user preferences as an important recommendation for the future policy.
1.2 Motivation and Research Objectives
From limited studies on developing countries, the recent study published in “Information and Communication Development 2009” reports on the substantial impact of broadband development in these countries (The World Bank, 2010). The report shows that a 10 percent increase in the penetration rate of broadband will boost the Gross Domestic Product (GDP) by 1.38 percent. Not only will broadband improve the level of productivity through remote monitoring, logistics management, and online procurement, it will also provide an increasingly vital device for accessing information to stipulate economic activity and ensure the implementation of good governance. Thus, the impact on developing countries is more critical and moves beyond merely the economic impact, namely the GDP.
In addition, there are two concurrent aspects of equal importance as determinants. On the one hand, the supply -side analysis places great emphasis on the need to provide wireless networks and infrastructure, whereas, on the other, from the demand perspective, affordability and, thus, income has to be put as an important factor. Income is still widely regarded as a major driving force for the diffusion, because many developing countries have a per capita income of less than 10 percent of those of developed countries.
Consequently, only a limited proportion of the population in countries with a highly skewed income distribution can afford broadband. The reason is that when annual broadband expenditure is priced at more than 2-5 percent of a household’s income, broadband is considered unaffordable.
With the growing numbers of mobile broadband users inline with the popularity of smart devices, the broadband access measurement becomes important for information, communication and technology policy in Indonesia. This study aims to investigate the broadband access in Indonesia by comparing the influences of the supply and demand sides. This study might contribute to the preliminary measurement for further policy, regarding type of technology and dispersion of infrastructure development to capture variety of broadband user demand in each region.
1.3 Research Questions
This study aims to answer the main research questions:
“What are the important factors to be considered in the development of mobile broadband access by measuring its consumer characteristics and observable demographics such as age, education, income, online experiences, urban/rural location?”
This research question identifies the important factors to be considered in the development of mobile broadband access, with greater emphasis on the question of whether income and/or geographical characteristics matter in determining access.
2. Country Overview and Macro Level Perspectives on the
Telecommunication Sector
Indonesia, a Southeast Asian archipelago of nearly 17,500 islands, was considered an Asian tiger of the second wave till its economy was badly hit by the Asian crisis in late 1990s. The economy has been gradually recovering since then. In spite of showing a slight setback in the wake of global financial crisis of 2008‐9, Indonesia has reported a growth rate of 4.5% for 2009.
Since 2008 significant reforms in the financial sector, including tax and customs reforms, the use of Treasury bills, and capital market development and supervision have been introduced. Indonesia's debt‐to‐GDP ratio has declined steadily since 2005 because of increasingly robust GDP growth and sound fiscal policies. Though it still struggles with poverty (29.4% of population living below USD 1.25 PPP in 2010) and unemployment (8.1% in 2009), literacy level below that of developed world (92% in 2010) inadequate infrastructure, corruption, a complex regulatory environment, and unequal resource distribution among regions, Indonesia can look forward optimistically for a better future. (CIA, 2011 & UNDP, 2011)
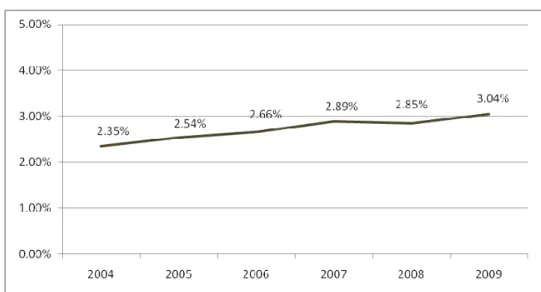
The role of consumption in driving Indonesia’s economic growth can be seen in its in sectoral GDP, the growth of which was spurred to a large extent by non‐tradable sectors, such as electricity, gas and water utilities, construction, the transport and communications sector and services. Transport and communications grew by 15.53% in 2009, with a strong performance driven by ongoing market penetration in the communications subsector. As Figure 2 illustrates the communication (including broadcasting) subsector’s contribution to GDP has increased from 2.35% in 2004 to 3.04 in 2009 (Bank Indonesia, 2009).
Figure 2 . Communication Subsector (including broadcasting) percentage of GDP
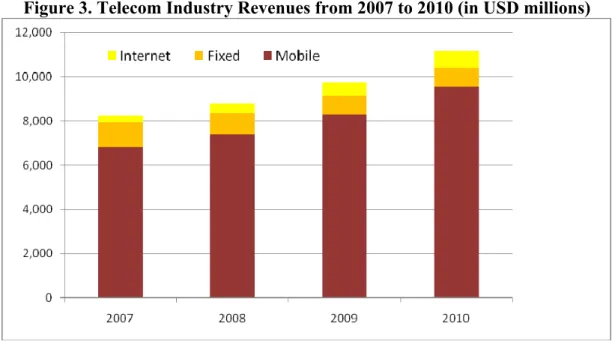
For a considerably long period, Indonesian telecom market has been a poor reflection of the market potential of the fourth most populated nation with a population of over 237 million as of 2010 end (BPS, 2011). Now it is gradually attaining maturity both in terms of revenue and penetration. The aggregate revenue from telecom industry in 2010 was USD 11,000 million. (Figure 3)
Figure 3. Telecom Industry Revenues from 2007 to 2010 (in USD millions)
Source: Firmansyah 2011
An UNCTAD survey lists Indonesia as the 9th out of the 15 most desirable regions for Foreign Direct Investment (FDI). Telecommunication is an attractive sub sector along with a few other service industries, though Bank Indonesia does not provide the exact FDI figures in its annual report. Despite this telecom is being labelled by the protectionists, including those in government, as one of the ‘high‐polluting industries’ (in economic, not environmental sense) and for ‘national interests’ the government has imposed mandatory foreign investment caps. Foreign investments in mobile and fixed‐line telecommunication sub sectors were capped at 65% and 49% respectively in 2007, down substantially from the previous 95% cap for both. This rule was not for Singaporean and Malaysian investors, who already owned large chunks of Indonesia's major telecom operators. (Asia Times, 2007) This can be one of the key barriers that restrict FDI inflows to Indonesia telecom industry.
2.1 Market Structure and Market Dynamics
With 240 million people, Indonesia is a huge market to develop further. Nevertheless, given the varied geographical area, it is difficult for Indonesia to increase the level of telecommunication infrastructure, especially for fixed lines. The fixed line penetration rate was around 15.83% as of 2010. In contrast, the cellular market recorded a dramatic
boost with a growth rate of 91.72%, and hence the number of subscribers reached about 220 million by 2010.
In 2001, the use of computers with application programs in the Indonesian language was implemented. In the same year, the country implemented a Five-Year Action Plan for the development of ICT in the country. Under this plan, ICT will play a key role in the education system by enhancing collaboration between the ICT industry and the education institutions. Later, based on the National Middle Term Development Planning (Rencana Pembangunan Jangka Menengah Nasional, RPJMN), Indonesia set the target to achieve 30% broadband connection, 50% Internet penetration and 75% broadband penetration for cities and regional capitals by the end of 2015.
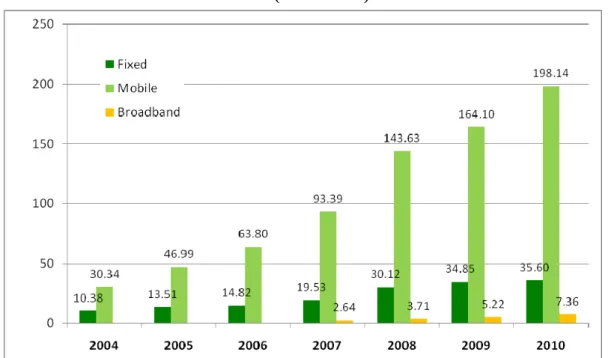
Indonesia has started its movement away from copper and towards waves. In the voice category mobile demonstrates the highest growth over the last five years followed modestly by fixed wireless access (FWA). The five year CAGR (from 2005 to 2010) is 33% for mobile and 21% for fixed. Fixed wireline, after reaching its climax in early ‘00s now shows a gradual decline. In the data category HSPA based services appears to have solved the issued faced by the Indonesia broadband users for decades. Figure 4 shows the subscriber growth in fixed (wireline and wireless), mobile1 and broadband2 sectors since 2004. Indonesia is one of the four countries in Asia Pacific (the others being China, India and Japan) that has increased its number of telecom users by over 100 million since the year 2000.
Figure 4. Subscriber Growth in Fixed, Mobile (Sims) and Broadband from 2004 to 2010 (In Millions)
Source: Directorate General of Postal and Telecommunication, 2011; Firmansyah, 2011.
1 This is the number of SIMs issued and not number of unique subscribers, which should be less because of
the single user multiple SIM ownership phenomenon.
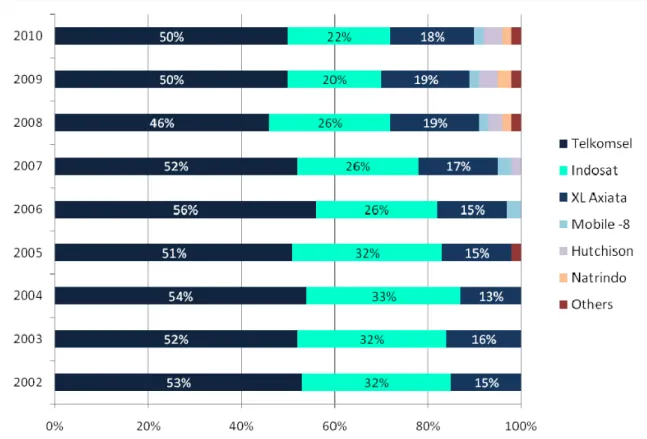
Indonesia now has eleven operators providing mobile services. This makes it the country with third largest number of mobile operators in Asia Pacific, following India (15) and Bangladesh (12). (GSMA & Kearny, 2008) Nine operators provide services at national level, though the market is dominated by three of them: PT Telkomsel with its products Halo and Simpati, PT Indosat with Matrix and Mentari, and XL Axiata with XL. As of December 2009, Telkomsel had nearly 50% of the subscriber market share with other two having 20% each. (Directorate General of Postal and Telecommunication, 2011). Telkomsel is the mobile arm of the main incumbent PT Telkom. 65% of it is owned by Telkom while the remaining 35% by Singapore Telecommunications (SingTel). Indosat is 45% owned by public, 41% by Qtel and 14% by Indonesian government. XL Axiata is owned by Axiata Investment (Indonesia) Sdn Bhd (67%); Etisalat (13%); and public 20%. The rest are privately owned by international and domestic firms. Market share of the key players has changed since 2002 with PT Telkom and Indosat losing their share (significantly in case of the latter) with XL Axiata and others gaining subscribers. (Figure 5)
Figure 5. Market Shares of the Key Mobile Operators (number of subscribers) from 2002 to 2009
Source: Directorate General of Postal and Telecommunication, 2011; Firmansyah, 2011.
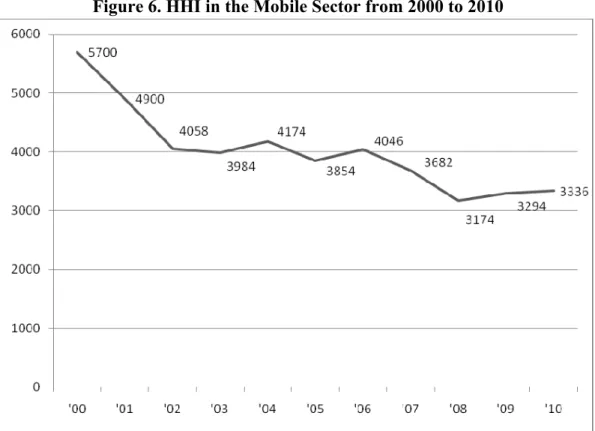
declined from 2000 to 2009, but has never gone below 30003. (Figure 6) This high level of market concentration is due to Telkomsel’s dominant position.
Figure 6. HHI in the Mobile Sector from 2000 to 2010
Source: Directorate General of Postal and Telecommunication, 2011; Firmansyah, 2011.
Indonesia shows some common trends seen in mobile markets in the region over the last few years. There has been a clear shift from Postpaid to prepaid mode. Prepaid subscribers accounted for 98% of the total mobile subscribers in 2008. (Wireless Intelligence quoted by GSMA & Kearny, 2008) The market also shows signs of saturation with the number of SIMS gradually approaching the population. The over 50% growth rate in 2008 has decreased to 14% in 20097 and gained a slight increase to 20% in 2010. Both Frost and Sullivan and GSMA research attributes this growth more to multiple SIM usage than to real expansion.
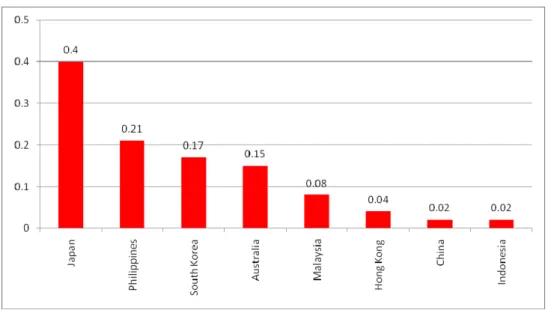
Intense competition in the mobile sector has also resulted in drastic reductions in prices and change of strategies by operators. Average Revenue Per Minute (ARPM) of all three key mobile operators have dropped from IRD 1,000 (USD 0.10) to 200 (USD 0.02) per minute from the first quarter of 2007 to the fourth quarter of 2008 and remained steady till the end of 2010. (Firmansyah, 2011) This has Indonesia recording lower ARPMs compared to what its South East Asian/East Asian and Pacific neighbours. (Figure 7)
3 The minor variations in the 2007‐10 period can be attributed to the absence of reliable subscriber data for
Figure 7. Average Revenue per Minute in Mobile Telecom Services for Selected Markets in Asia Pacific, 2008 (In USD)
Source: GSMA & Kearny 2008
2.2 Infrastructure: Availability, Usage and Quality
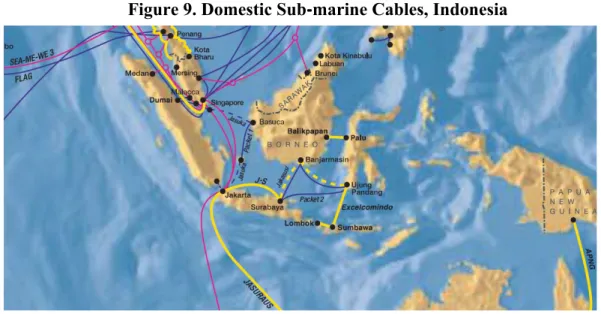
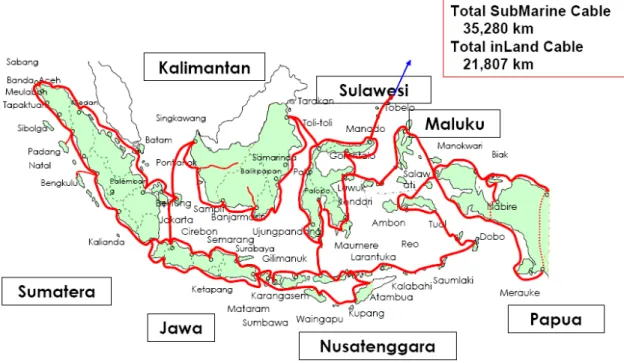
Indonesia connects to the world using two different modes: submarine cables and satellite. Sub‐marine cable access is gained through multiple points in the islands Borneo, Sumatra and Java with Jakarta. They have the best connectivity thanks to four international cables. (Figure 8). Some of the other key islands, which still do not have direct international connectivity, are linked via domestic submarine links by operators. (Figure 9) This still leaves the vast majority of the 17,500 islands unconnected.
Figure 8. International Sub‐marine Cables, Indonesia
Figure 9. Domestic Sub‐marine Cables, Indonesia
Source: Directorate General of Postal and Telecommunication, 2011
Indonesia also has an ambitious satellite communication program, which started in mid 1970s. Four sets of communication satellites named Palapa Ax to Dx were launched since then. Except for the Palapa D, launched in August 2009, the rest were mainly for broadcasting purposes. Palapa D will have a data link that will be used for providing broadband facilities.
Some of the mobile and FWA operates faced difficulties in tower construction but now the issue has been largely addressed. According to the regulator, any operator, irrespective of whether they are ‘domestic’ or ‘foreign’ (conveniently defined by Indonesian press to demarcate firms with significant foreign investment ) can erect their own towers, if they do so themselves. The earlier rule that prevented ‘foreign’ operators from building towers is no longer valid. If outsourced, both the tower provider and contactor have to be 100% ‘domestic’. The only exception is publicly owned tower providers. Indonesian regulator strongly encourages tower sharing in an attempt to reduce infrastructure costs. This has become successful where competition is not too high.
Releasing 2.6 GHz frequency range, identified as ideal for 4G LTE services, will be a problem as it has already been allocated for satellite communications. This will seriously delay the 4G availability in Indonesia, despite the operators’ enthusiasm. Some operators have already completed trials. The other possible frequencies that can be allocated to LTE, include 1.8GHz, 900MHz, and 700MHz. However re‐farming needs to be done since 1.8GHz has is already allocated for 2G and 3G services. 700MHz is still occupied by some organizers of free‐to‐air television broadcasts. Freeing that too might be a problem though all national broadcasters (both radio and television) are expected to migrate to digital broadcast by 2018. India and China have held a first commercial LTE in 2.3GHz frequency. The technology used is TDD (Time Division Duplex)‐LTE. Studies in both countries shows feasibility but in Indonesia 2.3 GHz is already allocated for WiMAX services. (Slikers Weblog, 2010)
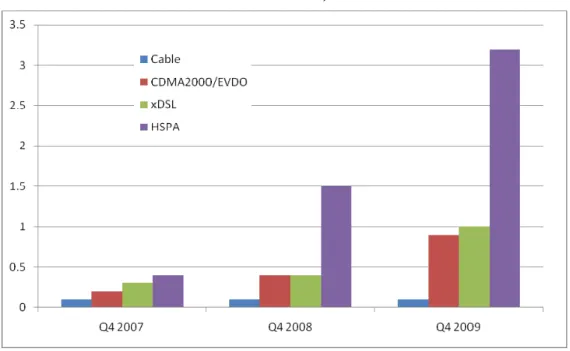
Broadband landscape is changing. The movement from fixed broadband to mobile broadband is most visible. But subscriptions to packages based on other technologies, except cable, are also on the rise. (Figure 10)
Figure 10. Indonesia’s Broadband Evolution by Technology (number of subscribers in millions)
Source: Wireless Intelligence, ITU, 2010
Clear urban rural disparities in telecom services exist. Few other islands show agreeable connectivity rates, but Java remains the most promising island for telecom growth, both voice and broadband. Besides being the most populated island, it shows the relatively strong purchasing power compared to the rest. Sumatra, with a significant population can be treated as the second most promising market. Kalimantan, Sulawesi and Papua and other parts are less attractive to telcos with their low population density and low income levels. At least three major operators have expended their services to these islands, but the bulk of their revenue still comes from Java and Sumatra. Smaller operators are expected to expand their networks outside Java but it would certainly take time (Pefindo Credit Rating Indonesia, 2010)
Donny and Mudiardjo (2009) claims 43,000 of Indonesia villages, 65% of the total, are not served by any network. This situation might have improved by now, but not significantly. A large number of small islands still stay out of the telecom networks, as the connectivity costs are not justified by the market sizes. GSMA estimated 93 million of Indonesian population (approximately 40% of the total) unconnected in 2008. It also places Indonesia among four other countries, namely China, India, Pakistan and Bangladesh that makes 96% of Asia’s unconnected population. (GSMA & Kearny, 2008)
Palapa ring was country’s solution to make easy and affordable access of telecom services for all. Started as a ‘dream’ project in the pre‐Asian crisis era, the initial plan was to use government funds to build this national fiber optic backbone that was to connect the country at large, with special focus on the eastern region ‐ the area within Sulawesi, Bali and Papua triangle. The project objectives, scope and estimates differ among sources, as perhaps the idea has been toyed for a prolonged period. According to Donny and Mudiarjo (2007) the plan was to lay over 25,000 km undersea and terrestrial cables in an integrated ring shape spread out from Sumatra to West Papua. Every ring was to transmit broadband access of about 300–10,000 Gbps. (Figure 11)
Figure 11. Blueprint of (proposed) Palapa Ring
The project is yet to materialize in 2010 end and its future looks uncertain. The government’s effort to get local telcos to fund the project had failed, and all members except PT Telkom have left the consortium. Still the government expects to complete the project by 2012. The latest scope is estimated at 35,280 km undersea and 21,870 km underground fiber‐optic cables. (Jakarta Post, 2010).
3. Literature Review
3.1 The important role of ICT
Technology, human capital and skills were later identified as important factors to support economic growth during the 1960s. Quah (1999) mentioned that Arrow (1962) was among the first economists to be aware of the existence of knowledge as an economic commodity. Knowledge displays infinite expansibility; hence, the consumption of such a commodity will not reduce the physical functionality of the original nor be affected by the barrier of physical distance. Whereas Scherer (1999) stated that Schultz (1961) first introduced the terminology of “a new paradigm of economic growth” when suggesting the importance of human capital, Schultz (1961) stated that despite massive destruction of physical capital during the post-World War II period in Germany, something was not destroyed, namely experience and accumulated skills that made the country rebound afterwards.
The extensions of the study place importance on technology and human capital evolved in the 1980s, for instance, in Romer (1986) and Madisson (1991). Romer (1986) incorporated a knowledge factor as an input to the production function and found that the growth model generated different results compared with the traditional diminishing returns of the production function. In other words, the use of technology supports increasing return to scale for many production processes (Milgrom, 1991). Following this study, Romer (1990) added that the additional portion of human capital consisting of research and development is a stronger determinant of the rate of growth. This conclusion was also found in the study by Lucas (1988), which explained the role of human capital in sustaining the level of economic growth in the long run. The role of human capital and an educated population are thus crucial as determinants of economic growth. This factor is visibly strong in some other studies, for instance, those of Barro (1991), Mankiew, Romer and Wreil (1992), and Levine and Renelt (1992).
In parallel with the theoretical studies conducted by Romer (1986, 1990), Barro (1991) investigated a comparative study of 98 countries during the period 1960-1985. The study concluded that the poorer countries can only catch up with the richer countries if the former can reach a higher level of human capital. In relation to this, Madisson (1991) added that there are only three countries that have been categorized as leaders in technological innovation in the last three centuries: the Netherlands, the United Kingdom and the United States. As a result, the growth rates of these leading countries are always higher than those of any other countries.
Technology became more important following the conception of general purpose technology (GPT). This view is characterized by the potential for the pervasive use of technology in a wide range of sectors; hence, technological dynamism enables generalized productivity gains transferred to the rest of the economy. The concept is also linked to “innovational complementarities” in which productivity in the downstream
sector increases as a consequence of innovation in GPT (Rosenberg, 1982). In relation to this, Steindel and Stiroh (2001) concluded that a major source of improved aggregate performance has been driven by high technology sectors. Faster productivity growth in this rapidly growing sector has directly added to the aggregate growth and a massive wave of investment in high tech by other sectors.
While human capital, skills accumulation and technology together contribute to economic growth based on previous studies, Gould and Ruffin (1993) point out the superiority of technology stating that this variable increases the level of human capital and education and, thus, accelerates the convergence of economic growth. Technology is therefore no longer seen as a traditional investment but, as Bresnahan and Trajtenberg (1995) assert, the role of technology has become more important as a catalyst in the process of innovation. Tightly linked to this view, Scherer (1999, pp. 33-36) emphasizes that the future of economic growth depends on how a country raises the level of innovation in which technological development in terms of research and development (R&D) plays an important role.
At industry level, Athey and Stern (1998) found similar conclusions, indicating the importance of technology. The study found complementarity between information technology, organizational factors and economic performance. In line with this study, Brynjolfsson and Hitt (2000) found that the increase in the level of technology capital in an economic sector is associated with the reduction in vertical integration and lower costs of coordination. The contribution of information technology can therefore be addressed by the creation of a new business, new skills and new organizational and industry structures. Baily and Lawrence (2001) pointed out that purchasing of IT significantly affects the total factor of productivity, in particular, the service industry. Innovation in the IT sectors greatly improved economic performance in recent expansions, affecting both old and new firms.
In an empirical analysis, a study by Hall and Mairesse (1993) investigates a production function in France. The manufacturing sectors are based on unbalanced panel data from 1980-1987. Of these firms, 210 had R&D information back to 1971. The results confirm the positive feedback and contribution of IT in raising the efficiency and productivity level. The study found that the return of R&D activities ranged from 6 to 7%. Similar studies can be found in Mairesse and Cuneo (1985), Griliches (1980, 1986), Cuneo and Mairesse (1984), and Griliches and Mairesse (1983).
On the direction of ICT to economic growth, Dutta (2001) found that the causality pattern of ICT (e.g. telecommunication infrastructure) and economic growth was almost the same for industrialized and developing countries. Another study by Chakraborty and Nandi (2011) shows that the impact of telecommunication infrastructure investment on GDP growth varies even between developing countries inferred from the model employing some control variables. The study is conducted by relating the country-specific data to
mainline (fixed) teledensity and per capita growth using the Granger causality test within a panel cointegration framework. The results suggest that growth effects vary considerably across country groupings showing the different levels of development with teledensity and per capita growth strongly reinforcing each other for relatively less developed countries. The study suggested that the investment in telecommunication infrastructure, with its potential to generate a high growth return, may serve as the critical engine for driving the development process in the less developed countries.
3.2 The Demand of Mobile Broadband
It is difficult to estimate demand for broadband service, and more importantly for specific characteristics of broadband service with data currently available. For example, while there is information about subscription rates to Internet access, pricing and plan choice are not generally available publicly. As a result, it would be difficult to implement the discrete choice methods of Berry et. al. (1995). Moreover, even if these data were available, there is insufficient variation in product characteristics to identify important marginal utility parameters of interest. Previous studies have typically used demographic variables to explain the demand for broadband Internet service (“Digital Divide Studies”) or have collected market and/or experimental data from household surveys to explain how price and non-price characteristics affect demand (“Price and Non-Price Characteristics”). A. Digital Divide Studies
Several studies have examined the potential for a digital divide in both the deployment and use of high-bandwidth Internet infrastructure in the United States. Pew Internet and American Life provide results from periodic surveys of large numbers of households that provide a timeline for studying the characteristics of adoption at any point in time. For example, Horrigan (2009) provides survey results that show that broadband Internet service was adopted by 63 percent of households as of 2009, and that adoption rates differed by income, age and education.
Gabe and Abel (2002) adopt a supply-side approach and count the number of telephone lines with integrated services digital network (ISDN) capability in each United States state from 1996 to 2000. They find considerably more ISDN infrastructure in urban areas and suggest that rural demand for broadband services is generally insufficient to attract new investments in advanced telecom infrastructure. Prieger (2003) estimates a reduced-form model that relates the decision by a broadband carrier to enter geographic markets to expected demand, costs and entry by other firms. Using FCC zip-code data for 2000, he finds little evidence of unequal broadband availability based on income or on black or Hispanic concentration. He also finds that rural location decreases availability; market size, education and commuting distance increase availability.
examine racial differences in the demand for Internet service. He models the household‟s decision to purchase Internet service as a function of race and various demographic characteristics. His model estimates suggest that racial differences in education, income and occupation contribute substantially to the black/white and Hispanic/white divide in home Internet service. Fairlie also finds a negative correlation between rural location and the likelihood of subscribing to Internet services.
Using Forrester data from 18,439 United States households at 2001, Goldfarb and Prince (2008) show that while income and education correlate positively with Internet adoption, they are negatively related with hours spent online. They argue that with fixed connection and near-zero usage fees, low-income people spend more time online due to their lower opportunity costs of time. They suggest that if given the opportunity to go online, Americans without access would likely use the Internet to engage in many of the activities policymakers have stated as the goals of Internet access subsidies.
Prieger and Hu (2008) examine the racial gap in Internet demand in states served by Ameritech at 2000. Because they have incomplete data on the availability and characteristics of all options, they model the probability that at least one household in the census block subscribes to digital subscriber line (DSL) service. They find that race matters independently of income, education and location, in the demand for DSL, and that rural locations have lower demand. Service quality, measured by distance from the central office, has the largest marginal effect on demand and omitting this variable leads to under-estimates of the DSL gap for Hispanics. Prieger and Hu conclude that the lack of options and competition in promotional prices may play a role in creating some dimensions of the digital divide.
In summary, the existing “Digital Divide Studies” have typically used aggregated data and reduced-form model specifications to estimate the effects of income, education, race and location on Internet penetration rates. They do not measure the direct impacts of prices and other quality characteristics on Internet demand and, as such, provide little information on the value households place on different Internet services and individual service characteristics.
B. Price and Non-Price Characteristics
Several other studies use survey and/or experimental data to examine how price and non-price characteristics affect the choice of Internet service. Goolsbee (2006) uses stated preference data from a 1999 survey of about 100,000 consumers to estimate the probability of choosing cable modem Internet service. After controlling for individual demographics, model results show an increase in the likelihood of cable modem service for people with lower prices.
The elasticity of demand for cable Internet with respect to price ranges from -2.8 to -3.5. Hausman et. al. (2001) estimate a reduced-form model that relates the price of broadband
to dial-up price, presence of RoadRunner service, and demand and cost variables. Model results cannot reject the hypothesis that dial-up prices do not constrain broadband prices, and they conclude that broadband Internet is a separate relevant market for competitive analysis. However, the finding of zero cross-price elasticity should be qualified to some extent as they do not control for variation in the quality-adjusted prices of Internet service.
Using a sample of 5,255 households in 2000, Rappoport et. al. (2002) estimate a nested logit model where the first branch considers the choice between dial-up and broadband, and given broadband, the second branch considers the choice between cable modem and DSL. Model estimates provide own price elasticities for cable and DSL of –0.587 and – 1.462, respectively, and also suggest that dial-up service is not a substitute for broadband users. However, cross-price elasticities of 0.618 and 0.766, respectively, indicate that cable and DSL are strong substitutes for one another.
Dutz et. al. (2009) employ market data from Forrester for over 30,000 households and a similar methodology to Rappoport et. al. (2002) to estimate elasticities of Internet demand. They find that dial-up Internet is not a strong substitute for broadband and that the own-price elasticity of broadband declined from -1.53 in 2005 to -0.69 in 2008. Dutz et. al. argue that their own-price elasticity finding indicates that “broadband is progressively being perceived by those who are using it as a household necessity.” They also calculate that the net consumer surplus from broadband relative to dial-up service increased by about 60 percent from 2005 to 2008, to $31.9 billion.
Varian (2002) uses experimental data to estimate how much people are willing to pay for speed. During 1998 and 1999, 70 users at UC Berkeley were able to choose various bandwidths from 8 to 128 kbps through a degraded integrated services digital network line. Varian estimates reduced-form demand for bandwidth with own-price elasticities ranging from -1.3 to -3.1. Cross-price elasticities are generally positive and indicate that one-step lower bandwidths are perceived as substitutes for chosen bandwidth. A regression of time costs on demographics shows that users are not willing to pay very much for bandwidth. Unless new applications and content are forthcoming, or broadband prices fall, Varian suggests there may not be a large surge in broadband demand in the near future.
4. Empirical Strategy, Data and Results
4.1 Empirical Strategy
Together with other socio-economic variables, it is generally conceived that income is an important factor in determining the level of diffusion of ICT devices. Hausman et al. (2001) and Rappoport (2002) argue that household income is a critical predictor of broadband adoption. Cadman and Dineen (2008) found that broadband penetration in the OECD is strongly influenced by income, with a 1 percent increase in income leading to a 0.78 percent increase in demand. This is consistent with the study by Rosston and Savage (2010). A study by Jackson et al. (2010) employs a nationwide mail survey and aims to construct a profile of residential Internet access and investigate consumer preferences for bundled attributes in the U.S. The conclusions are that demand attributes and willingness to pay (for speed, always on, and reliability) vary between high and low-income users with higher income users’ value attributes being higher than those of lower income users. Besides this, the study shows that the willingness to pay for the speed attribute also increases with income.
Many studies place importance on the geographical area variable when determining broadband access (Rappoport (2002) and Steinberg et al. (2008)). Rosston and Savage (2010) conclude that rural households value connection speed at approx. USD $3 more per month than urban households. The study also stresses that the availability of broadband connection largely depends on the urbanization rate, whereas ubiquitous broadband is also supported by a sufficient number of businesses and households to justify the cost of extending broadband services to that region. Therefore, even though the dichotomy between urban-rural also reflects the demand -side factor, when it affects the infrastructure development, the notion can also reflect the supply -side factor adopted in this study.
In the context of developing countries, the importance of geographical area is also a consideration in the study by Srinuan et al. (2010), which investigated the determinants of the digital divide in ASEAN countries with the conclusion that beside the significant impact of income, geographical area is also an important factor in determining the digital divide. This means that as more people live in urban areas, the digitization index will increase. Thus, digitization policy also depends on how governments prioritize the infrastructure sector as part of the road map of development programs.
With regard to broadband development in Indonesia, the White Paper by the Ministry of Communication and Information (2010) reports in detail on the current state of development of the telecommunication sector in Indonesia. In view of the diffusion of Internet access, it is reported that during 2007-2008, the proportion of households with internet connection increased from 5.58 percent to 8.56 percent, even though the figure is still dominated by Java, which recorded a penetration rate of 9.95 percent in 2008. The report also elaborated that except for Maluku and Papua, the majority of internet access is
connected through DSL (approx. 60 percent), whereas dial-up is still used as the means of connection by 30 percent of the users. Given the current situation, efforts are still needed, especially to achieve the goal set by the government, as mandated in the National Middle Term Development Planning (Rencana Pembangunan Jangka Menengah Nasional, RPJMN) (2010). The document set the target to achieve 30 percent broadband connection, 50 percent Internet penetration, and 75 percent broadband penetration for cities and regional capitals by the end of 2015.
In this study, the investigation into mobile broadband access adopts the typical choice model commonly used in telecommunication demand estimation. The model can be found in Perl (1978), Train et al. (1987), Bodnar et al. (1988), Train et al. (1989), and Taylor and Kridel (1990). The model basically measures the probability of being a subscriber of telecommunication devices (telephony, internet, etc.) as a function of some independent variables. For this study, the model is drawn in equation 1 below, employing the Probit model
P (1| x) = G (β0 + β1Income + β2 Age + β3 Education + β4 Geographical area + βi other control variable + e) (1)
From equation (1), it can be inferred that the Probit model estimates the likelihood of being a mobile broadband user (Y=1), which is influenced by some socio-economic characteristics as the independent variables. Equation 1 is basically an access demand estimation of the interplay of the impact between the demand side and the supply side. A Similar discussion can be found in Koutrompis (2009) for the case of the simultaneity of the broadband demand, and Thurman (1986), Bettendorf and Verboven (1998) for the more basic endogeneity problem when estimating the demand equation. Thus, in this study, the access demand for mobile broadband is affected by income (demand side) and geographical area (supply side). A couple of additional variables are also added to explain the likelihood of being a mobile broadband subscriber following previous studies; marital status, education and specific occupation, and bearer of payment. A complete derivation of the Probit model and the investigated variables are presented in the Appendix.
The independent variables in this study are chosen following similar studies in technology adoption. Morris and Venkatesh (2000), for instance, suggest that age is the key element in the adoption of new technology. Their study shows that older people have “a perception of new technology and subjective norms” to a more significant degree than younger people do, especially during long periods of observation. In relation to age, Pagani (2004) stressed that different age groups led to differently perceived values toward technology adoption. The study by Varian (2001) described that the occupation and typical users influence the decision to access broadband, as well as typical heavy internet users. The latter is also part of the conclusion, based on the study by Jackson (2010), which states that high-speed users value the attributes of internet access and usage more highly than other users do. The study also shows the importance of other independent
variables, for instance, age and education. With regard to education, it was found that respondents with a college degree value speed more, thus, the willingness to pay is positively correlated with education level. This conclusion is also echoed by Burton and Hicks (2005), who state the importance of the education variable as one of the main determinant when estimating broadband demand.
4.2 Data
The data sources come from Teleuse at the bottom of the pyramid, or Teleuse@BOP survey that has been conducted by LIRNEAsia. Based on household surveys. The survey conducted on the main islands of Indonesia to more than 800 questions. The survey was carried out using a face-to-face method between the interviewer and the respondents and aimed to describe the characteristics of ICT access and usage. This section on mobile broadband is only one part of the whole data collection concerning other ICT devices: cellular, fixed line, TV, Cable TV, computer, etc.
The point of interest in this study, and the dependent variable of the model, is mobile broadband subscribership. The survey reveals that only 5.2 percent of the respondents currently subscribe to mobile broadband. Having collected answers from 3470 respondents, this proportion leads to a conclusion that only 180 respondents currently subscribe to mobile broadband in this sample. This proportion is reasonably consistent with that reported by the ITU (2011). At the end of 2009, the penetration of mobile broadband was recorded as 3.5 percent (7.95 million subscribers), which was an increase on the previous figures in 2008, which were only 1.47 percent (3.3 million subscribers). It is therefore reasonable to have a penetration rate of about 4-5 percent in Indonesia in 2009, based on the survey figure.
Two independent variables that are important in this study are explained further. The variable of household expenditure is used as the proxy for income and is divided into four classes. Based on this classification, almost 40 percent of the respondents are in the first category (lower expenditure), 9 percent in lower middle income, and 5 percent and 2.5 percent represent the upper middle and higher incomes respectively. In terms of the geographic variable, the distribution of the sample is centered on Java Island and its main cities (Jakarta, Bandung, Semarang, and Surabaya). This is understandable, given the distribution of the population in Indonesia, which is also concentrated in these areas. The other cities investigated in this study are Medan, which represents the western part of Indonesia (Sumatera Island), and Makassar and Balikpapan, which represent the eastern part of Indonesia (Sulawesi and Kalimantan Island). Of the respondents in the survey, 65 percent live in Java, giving the best proxies concerning the actual distribution of the population. Amid the disproportion of the sample, this study is able to picture the actual population distribution in Indonesia. The Central Bureau Statistics of Indonesia (BPS) (2004) reported that the distribution of the population over the 32 provinces is not even.
Almost 59 percent of the total population inhabits Java, an island with an area covering only 7 percent of the total land area of the country. The rest, 41 percent, inhabits the other islands. In contrast, Papua with an area covering about 19 percent of the total land area is inhabited by only 1 percent of the total population. The survey also shows that there is a huge disparity in access, with 82 percent of mobile users living in an urban area. This data suggest unavailability of the existing wireless technology infrastructure to enable subscription from a rural one, which is also confirmed by the report by the Indonesian National Regulatory Agency (NRA), BRTI (2010).
As discussed earlier, the decision to subscribe to mobile broadband is predicted by employing other socio-economic variables. In terms of education level, 5.7 percent obtained a higher education degree, which means that they have at least graduated from high school (Sekolah Menengah Atas, SMA). The respondents are quite well distributed in terms of age classification, denoted by the proportion of age1 (<25 years old), age2 (25-39 years old) and age3 (40 years old<). The proportions are quite similar, with age1 slightly below the other groups and age3 slightly over-represented. The detail explanation regarding independent variables in this study is presented in the Appendix.
4.3 Results
As presented earlier, this study emphasizes broadband access in Indonesia, in particular for determining the supply and demand side as the important drivers. To obtain the range of the supply -side investigation, Model 1 generalizes the urban vs. rural classification; Model 2 explains the differentiation between Java vs. non-Java, while Model 3 observes the difference in terms of cities. The results are presented in Table 1.
Table 1. Demand Equation Estimates
Variables Model 1 Model 2 Model 3
Male 0.014 0.013 0.014 Higher education 0.089 0.085 0.084 Age1 0.059 0.059 0.057 Age2 0.029 0.031 0.028 Expenditure2 - 0.02 -0.022 -0.019 Expenditure3 0.006 -.004 0.005 Expenditure4 -0.009 -0.011 -0.008 Urban 0.023 Java 0.027 Jakarta 0.041 Bandung 0.036** Surabaya 0.065* Semarang 0.066
Note: Significant at 1%; *, **, denotes the significant at 5% and 10%
Table 1 shows the Probit output from equation 1. Among the control variables, which consist of age, gender, and education, all the variables are found to be consistent in explaining the likelihood of being a mobile broadband subscriber. Age has a positive impact, indicating that teenagers and people of middle age have a higher likelihood of being subscribers (6 percent and 3 percent higher respectively) compared with the elderly. A higher educated respondent has 8-9 percent greater likelihood of being a subscriber, whereas gender gives a 1.3-1.4 percent greater edge for males to be subscribers. Married respondents are 3 percent less likely to be subscribers than unmarried respondents. This study confirms a priory hypothesis showing that the specific occupation of manager has the highest likelihood of broadband access, whereas this impact does not exist for technician. The impact of heavy internet users (defined by users on the 60th percentile of Internet usage within the sample of the study) is also important, and they are 6 percent more likely to be subscribers than the rest of the sample. In addition to that, respondents who pay the billing of mobile phone on their own have the higher likelihood as the mobile broadband users.
While there are many aspects can be drawn on the other interesting independent variables, the analysis in this study centers on the comparison between the demand side and the supply side. Income (proxied by expenditure), as the demand -side variable, plays a less important role in determining the likelihood of being a mobile broadband subscriber. The results show that a middle-lower income respondent has a lower likelihood of being a subscriber, but there is no statistical evidence explaining the conclusion for the higher income user. In contrast, geographical area plays a more important role based on the model. The urban respondent is 2 percent more likely to be a mobile broadband subscriber than a rural respondent (Model 1). If the dummy for geographic location is represented by Java and non-Java, the inference indicates that a respondent living in Java is 2.7 percent more likely to be a mobile broadband user. In addition, if the dummy for the geographical location is represented by cities, the results find, accordingly, that Surabaya, Semarang, Jakarta, and Bandung are the spots of the market, while Batam, Medan, and Balikpapan are not statistically significant.
Medan -.0003
Makasar 0.002
Balikpapan -0.003
Batam -0.005
Heavy internet users 0.057* 0.043** 0.054*
Married -0.031 -0.033* -0.029
Own payment 0.019 0.019 0.016
Technician 0.003 -0.007 0.004
5. Conclusion and Study Limitations
Previous studies have identified that a common problem of ICT diffusion in developing countries is related to the lack of infrastructure development and other socio-economic factors, namely income, age and education (Nikam, Ganesh & Tamizhchelvan 2004; Bowonder & Boddu 2005; Narayanan, Jain & Bowander 2005; Gamage & Halpin 2007; Ramirez 2007). It will be difficult, however, for the countries to solve all the problems at times. Figure 12 accentuates the chain of the problem faced in the diffusion of ICT in Asia.
Figure 12. Chain of the problem of diffusion of ICT in Asia
Based on Figure 12, the following assessment deals with the question: If the policy should be chosen between the demand side and the supply side (e.g. lack of infrastructure development and income level), which one should be considered first to support the diffusion of ICT devices in Indonesia.
The study is motivated by the evidence that broadband has undoubtedly contributed to economic development. Yet, there are still few studies investigating the broadband
There is a clear digital gap in Asia. Only cellular devices have been diffused equally
Supply and demand problems simultaneously problematize this gap.
Which policy should be applied immediately?
economy in developing countries that make the investigation important. In addition, supported by the fact that mobile broadband is becoming more important in closing the broadband gap between developed and developing countries, the observation on mobile broadband access is an important agenda. Furthermore, the study aims to identify the demand and supply factors that determine mobile broadband access. Two variables are proposed to obtain this aim, with income being used to represent the affordability issue, thus explaining the demand -side factor, whereas geographical characteristics are used to mimic the disparity in infrastructure development and, thus, show the impact of the supply -side factor.
The study concludes that income plays a less important role in its effect on mobile broadband access than geographical area, indicating that affordability is not an issue to further develop broadband. The importance of geographical characteristics confirms the studies by Rappoport (2002) and Steinberg, Degagne and Dough (2008). The fact that urban areas, and Java and its cities, are more developed in terms of broadband development leads to a need to develop infrastructure more evenly throughout the country. A schema for Universal Service Obligation (USO) is therefore needed, for instance, the type of partnership between the government and the private sector. The results strongly reinforce the need to speed up infrastructure development in countries with a massive disparity like Indonesia.
Due to the lack of data resources, the analysis has not yet included analysis of willingness to pay for the broadband access in Indonesia. Realizing that infrastructure provision in telecommunications requires such huge investment, future research should be carried out in an attempt to identify the willingness to pay for broadband and the demand for broadband usage in each region.
6. References
Badan Pusat Statistik (BPS). (2004). Country paper. Official statistics and its
development in Indonesia. Jakarta: BPS.
Bettendorf, L., & Verboven, F. (1998). Competition on the Dutch coffee Marmet. The Hague: Central Planning Bureau.
Bodnar, J., Dilworth, P., & Iacono, S. (1988). Cross-sectional analysis of residential telephone subscription in Canada. Information Economics and Policy, 3, 359-378.
Burton, M. L., & Hicks, M. J. (2005). The residential and commercial benefits of rural
broadband: Evidence from Central Appalachia. Charleston: West Virginia Development
Office.
Cadman , R., & Dineen, C. (2008). Price and income elasticity of demand for broadband
subscriptions: a cross-sectional model of OECD countries. Norwich: SPC Network.
Crandall, R W, C L Jackson, and H J Singer. The Effect of Ubiquitous Broadband
Adoption on Investment, Jobs and US Economy. Washington, D.C, Criterion Economics,
L.L.C., 2003.
Davis, B., Caccappolo, G., & Chaudry, M. (1973). An econometric planning model for AT& T. Bell Journal of Economics and Management Science, 4(1), 29-56.
DG Postel, Government of Indonesia. (2008). Statistics of Post and Telecommunication. Jakarta.
Dobell, A., Taylor, L., Waverman, L., Liu, T., & Copeland, M. (1972). Telephone communications in Canada: demand, production, and investment decisions. Bell Journal
of Economics and Management Sciences, 3(1), 175-219.
Galperin, H. (2004). Wireless Networks and Rural Development: Opportunities for Latin America. The Latin American Studies Association Conference. Las Vegas
Handler, D. P., & Grossman, R. (2009). The role of income distribution and broadband
penetration in developing countries. Cisco IBSG.
Hausman, J., Sidak, J., & Singer, H. (2001). Residential demand for broadband telecommunications and consumer access to unaffiliated Internet content providers. Yale
Infodev. (2010). Broadband policy for developing countries. ESW Concept Notes, Washington, DC.
International Telecommunication Union. (2010, October 19). ITU. Retrieved September 08, 2011, from News room-Press release:
http://www.itu.int/net/pressoffice/press_releases/2010/39.aspx
International Telecommunication Union. (n.d.). ITU. Retrieved September 9, 2011, from ITU News Magazine:
http://www.itu.int/itunews/manager/display.asp?lang=en&year=2008&issue=01&ipage= WT_ICT_indicator&ext=html
Jackson, M., Lookabough, T., Savage, S., & Waldman, D. (2010). Broadband demand
study: Final Report. Telecommunication Research Group, University of Colorado.
Kementrian Komunikasi dan Informatika. (2010). Komunikasi dan informatika Indonesia:
whitepaper 2010. Jakarta: Kementrian Komunikasi dan Informatika, Republik Indonesia.
Kementrian Perencanaan Pembangunan Nasional. (2010). Rencana Pembangunan Jangka Menengah (RPJM) Nasional. Jakarta: Bappenas.
Koutrompis, P. (2009). The economic impact of broadband on growth: a simultaneous approach. Telecommunication Policy, 33, 471-485.
Lehr, W, C Osorio, S Gillet, and M Sirbu. "Measuring Broadband Economic Impact." The
33rd Research Conference on Communications, Information and Internet Policy.
Arlington, VA, 2006
Perl, L. J. (1978). Economic and demographic determinants of residential demand for
basic telephone service. London: National Economic Research Associates, Inc.
Proenza, F. J. (2006). The road to broadband development in developing countries is through competition driven by wireless and Internet telephony. Information Technologies
and International Development, 3(2), 21-39
Rappoport, T., & Taylor, L. D. (2002). Willingness to pay and the demand for broadband services. ICFC Conference. San Francisco
Reynolds, T., & Samuels, A. (2004). Building digital bridges with emerging technologies.
Digital Bridges Symposium, Seoul: International Telecommunication Union (ITU).
Rosston, G. L., Savage, S. J., & Waldman, D. M. (2010). Household demand for broadband Internet in 2010. The B.E. Journal of Economic Analysis & Policy, 10(1), Article 79.
Sabry, W. (2010). Broadband wireless access Indonesia: Peluang tantangan. Jakarta: Alcatel Lucent, Masyarakat Telekomunikasi (Mastel).
Santosa, S. P. (2010). The acceleration of economic development through fixed broadband network. Jakarta: Masyarakat Telekomunikasi (Mastel).
Steinberg, S., Degagne, R., & Gough, M. (2008). Broadband demand aggregation: Planning broadband in rural Northern California. The ESRI User Conference
Proceedings. San Diego.
Srinuan, C., Rohman, I. K., Srinuan, P., & Bohlin, E. (2010). Digital divide in ASEAN countries: explaining the gap. In P. Gugler, & J. Chaisse (Eds.), Competitiveness of
ASEAN countries. London: Edward Elgar.
Thurman, W. (1986). Endogeneity Testing in a Supply and Demand Framework. Review
of Economics and Statistics, 68, 638–646.
Train, K. E., McFadden, D. L., & Ben-Akiva, M. (1987). The demand for local telephone service: a fully discrete model of residential calling patterns and service choices, Rand
Journal of Economics, 18, 109-123.
Varian, H. R. (2001). The demand for bandwidth: Evidence from the INDEX project. In R. W. Crandall, & J. H. Alleman (Eds.), Broadband: Should We Regulate High-Speed
Internet Access? Washington, D.C: Aei-Brookings Joint Center for Regulatory Studies,