HAL Id: hal-01932698
https://hal.archives-ouvertes.fr/hal-01932698
Submitted on 18 Mar 2019
HAL is a multi-disciplinary open access
archive for the deposit and dissemination of
sci-entific research documents, whether they are
pub-lished or not. The documents may come from
teaching and research institutions in France or
abroad, or from public or private research centers.
L’archive ouverte pluridisciplinaire HAL, est
destinée au dépôt et à la diffusion de documents
scientifiques de niveau recherche, publiés ou non,
émanant des établissements d’enseignement et de
recherche français ou étrangers, des laboratoires
publics ou privés.
Growth rate of alpine phytoplankton assemblages from
contrasting watersheds and N-deposition regimes
exposed to nitrogen and phosphorus enrichments.
Coralie Jacquemin, Céline Bertrand, Benjamin Oursel, Maxine Thorel,
Evelyne Franquet, Laurent Cavalli
To cite this version:
Coralie Jacquemin, Céline Bertrand, Benjamin Oursel, Maxine Thorel, Evelyne Franquet, et al..
Growth rate of alpine phytoplankton assemblages from contrasting watersheds and N-deposition
regimes exposed to nitrogen and phosphorus enrichments.. Freshwater Biology, Wiley, 2018.
�hal-01932698�
Growth rate of alpine phytoplankton assemblages from
contrasting watersheds and N
‐deposition regimes exposed to
nitrogen and phosphorus enrichments
Coralie Jacquemin
| Céline Bertrand | Benjamin Oursel | Maxine Thorel |
Evelyne Franquet | Laurent Cavalli
Abstract
1. High mountain lakes are a network of sentinels, sensitive to any events occurring
within their waterbodies, their surrounding catchments and their airsheds. By
modifying nutrient balance and availability in water, both local and global
changes are expected to alter primary productivity and to trigger strong
ecologi-cal impacts in these ecosystems.
2. Predicting ecological trajectories under future change is a key challenge for both
scientists and conservation managers. French alpine lakes, in the most southern
and western part of the European Alps, have received surprisingly little attention
to date. In this article, we address how variations in nitrogen (N) and phosphorus
(P) supply are likely to impact the area
’s phytoplankton growth. We performed N
and/or P enrichment microcosm experiments under controlled conditions on 12
phytoplankton assemblages sampled during the summer 2016 in four French
alpine lakes with contrasting catchments and N-deposition regimes.
3. The nutrients limiting phytoplankton growth varied according to the nutrient
sto-ichiometry of the lake water. In the lakes exposed to high N-deposition rates
(
≈700 kg N km
–2year
–1), the water contained more N than P and phytoplankton
growth in microcosms was either limited by P or not limited by either N or P. In
the lakes exposed to low N-deposition rates (
≈500 kg N km
–2year
–1), N
avail-ability relative to P was lower in the lake with vegetated catchment than in the
lake with rocky catchment, resulting in a switch from P to NP colimitation of the
phytoplankton in microcosms.
4. Our data clearly indicate that French alpine lakes do not host the same diversity
and structure of phytoplankton communities and that phytoplankton composition
influenced phytoplankton growth in microcosms. First, we show that nonmotile
colonial chlorophytes appeared in late summer assemblages, with lower growth
rates but P-storage abilities. Second, our findings indicate that the growth of
phytoplankton assemblages dominated by diatoms was increasingly limited by
sil-ica (SiO
2) throughout the summer, along with a 70% decrease in SiO
2concentra-tion in lake water.
5. The forecast global changes in the French Alps should increase phytoplankton
growth in most high mountain lakes where P is the main limiting nutrient, before
NP colimitation. These changes are likely to be of lesser extent in lakes with
large vegetated catchments in the northern area with lower N-deposition rates
and of greater extent in the southern area with higher N-deposition rates and
future P-deposition rates.
6. By investigating the relationship between nutrient availability, phytoplankton
composition and phytoplankton growth rate, this experimental laboratory
micro-cosm study will help interpret current multifactorial data from in situ monitoring
networks in the Alps. It will also be helpful to develop models to better predict
the sentinel lake responses to local and global changes.
K E Y W O R D S
microcosms, mountain lakes, nitrogen deposition, nutrient limitation, phytoplankton growth
1
|
I N T R O D U C T I O N
Lakes are a network of sentinels, sensitive to any events occurring within their waterbodies, their surrounding catchments and their air-sheds (Adrian et al., 2009; Williamson, Saros, Vincent, & Smol, 2009). Human influence in high mountain lakes dates to Neolithic times (ca. 6000–3000 B.C.) through deforestation, pasturing prac-tices, tourism in the catchments and fish introduction (Giguet‐Covex et al., 2011; Knapp, Matthews, & Sarnelle, 2001). More recently, these lakes have been strongly exposed to global changes. For instance, the warming rate in the European Alps has been twice as high as the global warming of the Northern Hemisphere since the twentieth century, reaching an annual increase of about 2°C (Auer et al., 2007). Compounds emitted by human activities, such as nutri-ents, metals and persistent organic pollutants, have been found to be transported over long distances, intercepted by mountain ranges and finally drained to remote lakes (Battarbee, Kernan, & Rose, 2009).
Both local and global changes have triggered modifications in the physical, chemical and biological functioning of high mountain lake ecosystems (Williams, Baron, Caine, Sommerfeld, & Sanford, 1996). Changes with strong ecological impacts include variation in nutrient availability and alteration of the balance of nutrients in lake water (Schindler, Knapp, & Leavitt, 2001; de Senerpont Domis et al., 2013; Winder & Sommer, 2012). Nitrogen (N) and phosphorus (P) are key limiting nutrients of phytoplankton growth in fresh waters (Reynolds, 2006; Sterner, 2008). The increased anthropogenic emission and deposition of N following population rise, industry and agricultural expansion in the twentieth century (Galloway et al., 2004) resulted in a switch from N‐limitation to P‐limitation of numerous unproduc-tive lakes of the Northern Hemisphere, including in the European Alps (Bergstrom, Blomqvist, & Jansson, 2005; Bergstrom, Jonsson, & Jansson, 2008; Elser, Kyle, Steger, Nydick, & Baron, 2009). In some regions, local increases in P emissions induced by climate changes or human management of natural areas caused a further reversion from P to N limitation in lakes, as noted in the Sierra Nevada mountain ranges in Spain (Camarero & Catalan, 2012) or in the United States
(Vicars, Sickman, & Ziemann, 2010). All changes in lake nutrient limi-tation recorded in these previous studies, whether by in situ moni-toring, experimental bioassays or palaeolimnological studies, involved enhanced phytoplankton productivity, biomass accumulation and the appearance of more mesotrophic phytoplankton species (Bergstrom & Jansson, 2006; Brahney, Ballantyne, et al., 2015; Wolfe, Van Gorp, & Baron, 2003). Evidence of nutrient influence on geographical dis-tribution, inter‐ and intra‐annual variability in phytoplankton assem-blages and productivity in high mountain lakes is becoming prevalent (Anneville, Souissi, Gammeter, & Straile, 2004; Tolotti et al., 2006; Villar‐Argaiz, Medina‐Sanchez, Cruz‐Pizarro, & Carrillo, 2001). By inducing changes in intracellular stoichiometry and community com-position, nutrient limitation can decrease the quality of food avail-able to higher trophic levels and affect the overall food webs in lakes (Bullejos et al., 2014; Delgado‐Molina, Carrillo, Medina‐San-chez, Villar‐Argaiz, & Bullejos, 2009; Elser et al., 2010).
The southernmost and westernmost chain of the European Alps, the French alpine chain, is particularly exposed to strong environ-mental changes (Gobiet et al., 2014). Forecast changes include intense warming, lower average rainfall, stronger heat waves and more extreme precipitations during the summer. P‐deposition rates are likely to increase in the southern French Alps along with enriched P‐dust emissions from the North African region (Moulin & Chiapello, 2004). N‐emissions are projected to slightly decrease or to remain steady at least until 2050 (Galloway et al., 2004). All these events will impact N and P biogeochemical cycles in lakes (Rajczak, Pall, & Schar, 2013). Predicting ecological trajectories under future change is a key issue for both scientists and conservation managers, but the French alpine lakes have still received little attention to date. In order to increase knowledge in this area, physical, biological, and social scientists have recently created a network, Sentinel Lakes, which monitors how high mountain lakes respond to multistressor changes (Birck et al., 2013). In addition, it would be essential to know which nutrient limits alpine phytoplankton, in which lake and when. The most commonly used method to identify the limiting nutrient is the colimitation experiment, in which the growth of natu-ral phytoplankton is monitored after adding nutrients to the native
lake water (Beardall, Young, & Roberts, 2001). It would also be inter-esting to determine how the phytoplankton composition can influ-ence the extent of phytoplankton growth in case of nutrient enrichment in lakes. Although small‐scale experiments offer tight control over experimental conditions, only few studies discuss the quantitative responses obtained in enrichment bioassays.
In this article, we address how variations in nitrogen (N) and phosphorus (P) supply are likely to impact the phytoplankton growth rate in the high mountain lakes of the French Alps. We sampled natural phytoplankton assemblages in four French alpine lakes with contrasting catchments and N‐deposition regimes during the summer 2016 and subjected them to different nutrient enrich-ments (N and/or P) under controlled laboratory conditions in microcosms. First, we hypothesise that P limitation of the phyto-plankton is favoured by high N:P ratios in lakes water, as expected in the lakes with mineral catchments exposed to high rates of N‐deposition. Second, we investigate how the phytoplank-ton growth induced by nutrient addition can vary among early, mid‐ and late summer assemblages, according to community com-position. This work provides new insights on how forecast envi-ronmental changes will influence N and P availability in French alpine lakes, and how these changes are likely to impact the phy-toplankton growth.
2
|
M E T H O D S
2.1
|
Study area and sampling
The French Alps, the southernmost and westernmost part of the European alpine chain, stand at the crossroads of Mediterranean, Provencal, Ligurian and Alpine climatic influences. This mountain range contains a wide range of glacially formed waterbodies, with almost 130 lakes as defined by Rivier (1996) (depth> 3 m, lake area> 0.5 ha) in the three protected areas of Ecrins National Park, Queyras Regional Nature Park and Mercantour National Park, above the tree‐line (1,800 m < altitude < 2,800 m).
For our colimitation laboratory experiments, we sampled four lakes located within two geographical areas of the French Alps. Within the northern area (area 1), we sampled the Lake Pisses (PIS) in the Champsaur Valley and the Lake Cordes (COR) in the Fonts de Cervières Valley. Within the southern area (area 2), we sampled the Lake Fremamorte (FRE) and the Lake Trécolpas (TRE), both in the Vésubie Valley (Figure 1).
The environmental and morphological characteristics of the stud-ied lakes are summarised in Table 1. For each area, annual N ‐deposi-tion rates were extracted from the European Monitoring and Evaluation Programme (EMEP) website (Fagerli et al., 2015; Figure 2) and averaged over the period 2000–2013. Area 1 lakes were exposed to a lower average N‐deposition rate (486.63 kg N km– 2year–1± 27.59) than area 2 lakes (698.88 kg N km–2year– 1± 22.50; Table 1). Whatever the area, all four lakes, at intermediary elevations ranging from 2,150 to 2,500 m, are ice‐covered from November to June. The dominant lithology of the catchments differs
according to the valleys: Sandstone, Shale, Granite or Gneiss. Two lakes are characterised by small rocky catchments (PIS and FRE), while the other two have larger catchments with more developed soils and meadows (COR and TRE). Pasture practices are propor-tional to the soil cover and therefore to the size of catchment area. All the lakes are small, with depth comprised between 7 and 9 m, and lake area between 0.8 and 1.8 ha.
The four lakes were sampled three times over the ice‐free period in 2016, after the snowmelt (C1 = late June or early July), in mid-summer (C2 = late July or early August) and at the end of the grow-ing season (C3 = September). Before each campaign, we characterised the physicochemical properties of the water column at the site of maximal depth in lakes. Water temperature, pH, dissolved oxygen, turbidity, conductivity and chlorophyll a (chl a) profiles were recorded using an Exo2 multiparameter probe (YSI, United States; Supporting Information Figures S1–S4). The depth of the aphotic layer was estimated using a Secchi disc. All presampling data indi-cated that the lakes were not or weakly stratified, with no aphotic and/or anoxic layer, and highest chl a at the bottom. Thus, all water samples were collected using a Niskin bottle at 1 m above the bottom.
The 6.5 L sampled water was filtered through a 50‐μm mesh to minimise grazing by zooplankton. This filtered water was stored in a sterilised opaque HDPE 8‐L container, placed in a cool box and transported to the laboratory as soon as possible (between 5 and 6 hr later). The phytoplankton was acclimatised overnight in growth chambers before colimitation experiments.
2.2
|
Colimitation experiments under controlled
conditions
2.2.1
|
Experimental design
For each colimitation experiment, the natural phytoplankton assem-blages were homogenised and transferred in 12 bottles to implement 12 microcosms. Each microcosm consisted of a 500‐ml sterilised transparent polycarbonate plastic bottle (Nalgene®) filled with 350 ml of sampled water to allow for gas exchanges. Four distinct nutrient enrichments were applied to these microcosms according to the protocol used by Bergstrom, Faithfull, Karlsson, and Karlsson (2013) among others: no addition (control N0P0), N addition (N1P0), P addition (N0P1) and N plus P addition (N1P1).
Added nutrients increased the concentrations of N to 110μg/L and/or the concentrations of P to 30 μg/L according to a factorial design. These concentrations were within a range of realistic concen-trations found in European alpine lakes (Camarero et al., 2009). To optimise algal growth, added nutrients were the forms of N and P most readily available in water (NH4NO3for N, and KH2PO4for P) according to the Redfield ratio (7:1 on a mass basis). The latter is the mean ratio of N and P in phytoplankton nutrient demand, assuming standard stoichiometric compositional ratios of phytoplank-ton cells (Reynolds, 1958). Each nutrient enrichment was processed in triplicate.
Natural phytoplankton assemblages were incubated under fixed experimental conditions of irradiance, circadian cycle and temperature (T =+10°C, irradiance = 45 ± 2 μmol m–2s–1, light– dark cycle = 14:10) for 6 days. These parameters were monitored throughout the experiments in the growth chambers with HOBO data loggers (HOBO, United States). The temperature of 10°C corresponded to the average summer tem-perature in the studied lakes and did not differ more than ±5°C from the in situ temperatures recorded during the sampling cam-paigns. The irradiance of 45 ± 2μmol m–2s–1 was sufficiently high to avoid light limitation in the microcosms (Dubourg et al., 2015).
2.2.2
|
Initial conditions
To define the initial conditions for our colimitation experiments, the nutrient concentrations and phytoplankton composition of the sampled water were analysed before microcosm nutrient enrichments. Subsam-ples of acclimatised water were filtered through precombusted 25‐mm glass filters (Whatman GFF, 0.7μm) for estimation of dissolved inor-ganic nitrogen (DIN = NH4++ NO2−+ NO32−), soluble reactive phos-phorus (SRP = PO43−) and silica (SiO2) concentrations. The dissolved fraction was stored in a 125‐ml HDPE bottle, placed in a cool box and frozen (−18°C) until analysis. Dissolved anions, cations and SiO2were determined by ionic chromatography (Metrohm, 930 Compact IC Flex F I G U R E 1 Location of the four French Alpine lakes studied
T A B L E 1 Environmental and morphological characteristics of the four lakes studied. Geographical coordinates are expressed according to Lambert 93 projection. Average and standard errors (±SE) of N‐deposition rates are calculated from data available on the EMEP website (http://webdab.emep.int/Unified_Model_Results/) for the period 2000–2013. Lithological data are from the website of the French office of geological and mining research (http://infoterre.brgm.fr/)
Area
N‐deposition rate (kg N
km−2year−1±SE) Lakes
Longitude (X) Latitude (Y) Altitude (m) Lithology Catchment area (ha) Soil cover (%) Lake area (ha) Maximum depth (m) 1 Low 486.63 ± 27.59
PIS 967507 6408301 2,495 Sedimentary Rock 21 10 1.7 7.5 (Champsaur
Sandstone)
COR 999315 6423409 2,447 Metamorphic Rock 140 60 1.8 9 (Blue Shale)
2 High
698.88 ± 22.50
FRE 1039746 6347961 2,348 Igneous Rock (Granite and Aplite)
75 5 0.8 9
TRE 1047261 6344711 2,150 Metamorphic Rock (Gneiss)
combined with 863 Compact Autosampler). Subsamples of acclimatised phytoplankton were fixed in alkaline Lugol solution (0.5%) and stored in 500‐ml HDPE bottles at +4°C for phytoplankton composition analyses. Counts of phytoplankton cells were carried out according to the Uter-möhl (1958) method at 40‐fold magnification under an inverted micro-scope (Olympus IX 70; Lund, 1981). Phytoplankton taxa were identified at 100‐fold magnification using appropriate taxonomic guides.
Beyond taxonomic composition, the α‐ and β‐diversity indices were used to characterise the structure of the phytoplankton assem-blages and interassemblage differences in species composition. The α‐diversity was estimated by calculating two indices. The richness index (S) measured the number of species identified. The Pielou (1974) index (J′) measured how evenly individuals were distributed among the species identified, varying between 1 (all species having the same abundance) and 0 (most individuals belonging to one spe-cies, the other species being represented by only one individual). The β‐diversity was estimated by calculating the dissimilarity index of Wilson and Shmida (1984) to measure the degree of change in species composition between campaigns. Considering two assem-blages A and B, it varied between 0 (all species were common to A and B) and 1 (no species were common to A and B).
2.2.3
|
Responses to nutrient enrichments
Chl a content can vary in phytoplankton cells depending on taxon-omy and physiological state, for example due to nutrient and light deficiency (Felip & Catalan, 2000). Therefore, we chose cell counting and growth rate calculation to quantify and to compare the responses of phytoplankton assemblages to microcosm nutrient enrichments. The number of phytoplankton cells was estimated using a Nageotte counting chamber (Guillard, 1973, 1978), and the growth rates were calculated using the following formula (Padisák, 2004):
τ ¼ lnðNtf=Nt0Þ
t
where τ = growth rate (per day); Nt0= cell numbers at t0 (cells/L); t0 = first day of the experiment; Ntf= cell numbers at tf (cells/L);
tf = last day of the experiment; t = duration of the experiment (day)
The nutrient concentrations were analysed in microcosms after the nutrient enrichments and after the incubation periods (Support-ing Information Figure S5).
2.3
|
Statistical analyses
For each colimitation experiment, we first performed one‐way ANO-VAs with Tukey’s post hoc test (p < 0.05) to test for significant vari-ation in growth rates among microcosm nutrient enrichments. The results were used to determine the categories of nutrient limitation of the phytoplankton assemblages, as defined by Harpole et al. (2011): (a) simultaneous colimitation by N and P (Sim‐NP), with greater growth rates compared to controls in N1P1 only; (b) inde-pendent colimitation by N and P (Ind‐NP), where growth rates were greater than in controls in N1P0, N0P1 and N1P1; (c) single N ‐lim-itation (Single‐N) or single P‐limitation (Single‐P), where growth rates were greater relative to controls in N1P0 or N0P1, respectively, but did not differ from growth rates in N1P1; (d) serial limitation by N (Serial‐N) or P (Serial‐P), similar to Single‐N or Single‐P, but with greater growth rates in N1P1 relative to N1P0 or N0P1; e) no limita-tion (No lim), where all growth rates in treatment microcosms were not significantly different from controls.
Second, for each lake we assessed whether phytoplankton growth rates varied between sampling campaigns. We performed a mixed‐effect model using the package “lmerTest” (Kuznetsova, Brockhoff, & Christensen, 2016) on the R software environment (v.3.1.1). The response variable was the growth rate (τ) estimated in microcosms. The first explanatory variable was the nutrient treat-ment (Treattreat-ment), of two types: enrichtreat-ment with limiting nutrients or not. The second explanatory variable was the sampling time dur-ing the ice‐free period (Campaign), expressed as number of days since the first day of sampling in summer 2016 (June 28). We assumed a linear relationship betweenτ and Campaign, and the sam-pling campaigns (C1, C2 and C3) were included as a random effect to account for pseudoreplication. When we checked for normality, homogeneity and independence of residuals, we did not detect any clear violation of the standard assumptions that would have compro-mised the use of this statistical model (Zuur, Ieno, Walker, Saveliev, & Smith, 2009).
3
|
R E S U L T S
3.1
|
Initial conditions in the sampled water
3.1.1
|
Nutrient concentrations and ratios
Dissolved inorganic nitrogen (DIN) concentrations in the sampled water from the four studied lakes ranged from 0.011 to 0.776 mg/L (Figure 3a). Average DIN concentrations were significantly different between lakes FRE and COR (Kruskal–Wallis, p‐value < 0.01). The highest DIN concentrations were measured in Lake FRE F I G U R E 2 Annual atmospheric N‐deposition rate in area 1 and
area 2 over the period 2000–2013. Data are extracted from the EMEP website (http://webdab.emep.int/Unified_Model_Results/), for the two longitude–latitude (i;j) grid cells (50 × 50 km2) corresponding to area 1 (69;33) and area 2 (71;32)
(0.655 ± 0.064 mg/L) and the lowest in Lake COR (0.136 ± 0.072 mg/L). DIN values decreased significantly throughout the summer in all the lakes studied (Kruskal–Wallis, p‐value < 0.05).
Soluble reactive phosphorus (SRP) concentrations varied slightly over the summer, from 0.004 to 0.011 mg/L (Figure 3b), in samples from all four lakes. The low SRP concentrations were within the range of values of oligotrophic (0.004 mg/L < annual mean total phosphorus< 0.010 mg/L) to mesotrophic states (0.010 mg/L < an-nual mean total phosphorus< 0.035 mg/L) according to the Organi-zation for Economic Co‐operation and Development (OECD) classification (Hart, 1984). Average SRP concentrations were signifi-cantly different between lakes FRE (0.006 ± 0.001 mg/L) and TRE (0.009 ± 0.002 mg/L; Kruskal–Wallis, p‐value < 0.01). We observed no common pattern of SRP evolution across sampling campaigns in water from the four lakes.
DIN:SRP ratios ranged from 2 to 127 (Figure 3c) in all the lakes. Average DIN:SRP ratios did not differ significantly between lakes PIS and TRE, but were higher in Lake FRE (113 ± 1) and lower in Lake COR (14 ± 7; Kruskal–Wallis, p‐value < 0.001). DIN:SRP ratios were significantly lower in September during C3 than during previous sampling campaigns for lakes PIS, COR and TRE (two‐way ANOVA,
p‐value < 0.05).
Silica (SiO2) concentrations ranged from 0.286 mg/L to 1.248 mg/ L (Figure 3d) in all the lakes. The lowest values were found in Lake
FRE in September during C3 and the highest values in Lake PIS in early July during C1. Average SiO2concentrations in lakes PIS and COR were not significantly different from the concentrations in lakes FRE and TRE. However, SiO2concentrations were significantly lower in Lake FRE (0.466 ± 0.049 mg/L) than in Lake TRE (0.944 ± 0.013 mg/L; Kruskal–Wallis, p‐value < 0.01). The highest variation in SiO2 concentrations across sampling campaigns was observed in Lake PIS, with a 70% decrease between the first (C1) and the third (C3) sampling campaigns in summer 2016, from 1.248 mg/L at C1 to 0.358 mg/L at C3 (p‐value < 0.05).
3.1.2
|
Composition of the natural phytoplankton
assemblages
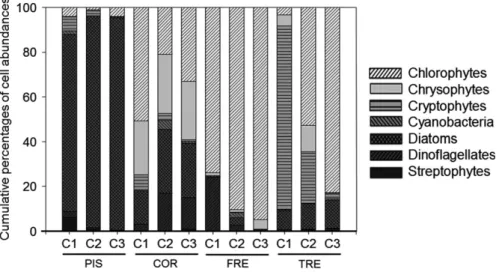
The cell abundances of phytoplankton assemblages in Lake PIS were dominated by diatoms (90 ± 5%) for all the sampling campaigns (Fig-ure 4). The richness ranged from 11 to 14 identified phytoplankton species, and the evenness was low (J′ < 0.40; Table 2). The dissimi-larity index was high between the sampling campaigns (Wilson– Shmida> 0.50; Table 2).
In Lake COR, four taxonomic groups represented more than 90% of the cell abundances in the phytoplankton assemblages (Figure 4). The phytoplankton species consisted of chlorophytes (35 ± 9%), chrysophytes (25 ± 1%), diatoms (23 ± 4%) and dinoflagellates
F I G U R E 3 Chemistry of the water sampled from each lake and for each sampling campaign (C1, C2 and C3): (a) dissolved inorganic nitrogen—DIN; (b) soluble reactive phosphorus—SRP; (c) DIN:SRP ratio; (d) silica—SiO2
(4 ± 11%). The richness ranged from 14 to 19 identified species, and the evenness was high (J′ > 0.64; Table 2). The dissimilarity index was low between the sampling campaigns (Wilson–Shmida < 0.50), especially between C2 and C3 (Wilson–Shmida = 0.03; Table 2).
The phytoplankton assemblages in Lake FRE were dominated by chlorophytes (86 ± 6%) for all the sampling campaigns, although dinoflagellates were also well represented during C1 (9%) (Figure 4). The richness ranged from 5 to 11 identified species, and the even-ness was low (J′ < 0.45; Table 2). The dissimilarity index was high between the sampling campaigns (Wilson–Shmida > 0.63; Table 2).
The phytoplankton assemblages in Lake TRE were dominated either by cryptophytes in late June during C1 (82%) or by chloro-phytes in September during C3 (83%) (Figure 4). The richness ranged from 17 to 19 identified species and the evenness from 0.35 to 0.73 (Table 2). The dissimilarity index was high between the sampling campaigns (Wilson–Shmida > 0.50; Table 2).
3.2
|
Phytoplankton responses to nutrient
enrichments in microcosms
3.2.1
|
Categories of nutrient limitation
Based on the ANOVA and post hoc Tukey tests performed for each colimitation experiment, growth rates induced by the microcosm nutrient enrichments (N1P0, N0P1, N1P1) were compared to growth rates observed in controls (N0P0). The categories of nutrient limita-tion identified from colimitalimita-tion experiments are presented in Table 3. Of the five possible categories as defined by the classifica-tion of Harpole et al. (2011), only three were evidenced in our study.
The phytoplankton was strictly limited by P (Single‐P) in eight cases (p‐value < 0.05). The growth rate increased relative to control when P was added alone (N0P1) or in combination with N (N1P1). Growth rates in N1P1 microcosms were never significantly higher than growth rates in N0P1 microcosms, indicating that there was no
synergistic effect from simultaneous addition of N and P on phyto-plankton growth.
Two cases of N and P simultaneous colimitation (Sim‐NP) were observed among the colimitation experiments (p‐value < 0.05). Growth rates were higher compared to control only when N was added with P (N1P1). These microcosms contained the phytoplank-ton sampled from Lake COR during C2 and C3.
At last the colimitation experiments revealed two cases of no limitation, where the growth rates under nutrient enrichments did not differ significantly from controls. The phytoplankton of these microcosms was sampled from Lake TRE during C2 and C3.
3.2.2
|
Amplitude of phytoplankton growth
Microcosm phytoplankton growth rates measured under different nutrient enrichments are presented in Figure 5, per lake where the phytoplankton was initially sampled and per summer sampling time. Only two types of phytoplankton response were observed in micro-cosms: (a) growth rates not significantly different from controls, the τ‐control category; (b) growth rates significantly higher than controls, and not significantly different from the response in N1P1 micro-cosms, theτ‐enrichment category.
Table 4 summarises the effects and interactions of the two explanatory variables “Treatment” (τ‐control and τ‐enrichment) and “Campaign” (sampling time during summer) on phytoplankton growth rates measured in microcosms, for the four different lakes.
The addition of limiting nutrients had a positive effect on growth rates in enriched microcosms compared to controls (p‐value < 0.001). This effect was twice higher for the phytoplankton from Lake PIS (Treatment effect = 0.211) than for the phytoplankton from Lake COR (Treatment effect = 0.092), from Lake FRE (Treatment effect = 0.139) or from Lake TRE (Treatment effect = 0.141).
The variable“Campaign” had a positive effect on growth in con-trols for the phytoplankton from lakes TRE (Campaign effect = 0.002, p‐value < 0.001) and FRE (Campaign effect = 0.001, p‐
value< 0.001). The growth rates measured in controls did not vary over successive summer sampling campaigns for the phytoplankton from lakes COR and PIS.
A negative interaction between “Treatment” and “Campaign” affected growth in microcosms for the phytoplankton from lakes PIS (Treatment: Campaign effect =−0.001, p‐value < 0.001) and TRE (Tre atment: Campaign effect =−0.001, p‐value < 0.01). The later in sum-mer the phytoplankton was sampled, the more significant the decrease in amplitude betweenτ‐control and τ‐enrichment in microcosms.
4
|
D I S C U S S I O N
This experimental laboratory microcosm study contributes to addressing the following issues:
4.1
|
Growth of alpine phytoplankton assemblages
under controlled conditions
Given the strong environmental constraints at high altitude, only a restricted pool of phytoplankton species can develop (Rott, 1988; Tolotti et al., 2006). However, it appears fairly clear from our data that French alpine lakes cannot be considered similar in the diver-sity and structure of their phytoplankton communities. In colimita-tion experiments, examining differences in growth between enriched and control microcosms enabled us to assess (a) the phy-toplankton growth induced by the limiting nutrients already avail-able in the sampled water and (b) the ability of the natural phytoplankton assemblages to convert a defined level of added nutrients into new cells. We focused here on how changes in the water nutrient stoichiometry and the phytoplankton composition T A B L E 2 Diversity indices calculated from the phytoplankton sampled from each lake and for each sampling campaign (C1, C2 and C3). Alpha‐diversity (α‐diversity) is estimated by the richness index (S) and the evenness index of Pielou (1974) (J′). Beta‐diversity (β‐diversity) is estimated by the Wilson–Shmida index (1984)
Area N‐deposition rate Lakes Campaign
α‐Diversity Campaign β‐Diversity S J Wilson–Shmida 1 Low PIS C1 14 0.40 C1‐C2 0.85 C2 12 0.13 C2‐C3 0.65 C3 11 0.11 C1‐C3 0.52 COR C1 14 0.65 C1‐C2 0.39 C2 19 0.83 C2‐C3 0.03 C3 18 0.64 C1‐C3 0.44 2 High FRE C1 10 0.40 C1‐C2 0.71 C2 11 0.28 C2‐C3 0.63 C3 5 0.45 C1‐C3 1.00 TRE C1 18 0.35 C1‐C2 0.51 C2 19 0.73 C2‐C3 0.56 C3 17 0.63 C1‐C3 0.83
T A B L E 3 Results of ANOVAs and categories of nutrient limitation defined by Harpole et al. (2011), for each lake, each sampling campaign (C1, C2 and C3) and each colimitation experiment (No addition—N0P0, N addition—N1P0, P addition—N0P1, N plus P addition—N1P1)
Area N‐deposition rate Lakes Campaign
ANOVA p‐values (df = 3.8)
Category
N0P0‐N1P0 N0P0‐N0P1 N0P0‐N1P1
1 Low PIS C1 0.196 <0.001*** <0.001*** Single (P)
C2 0.956 <0.001*** <0.001*** Single (P) C3 0.718 <0.001*** <0.001*** Single (P)
COR C1 0.436 0.018* 0.030* Single (P)
C2 0.946 0.653 0.020* Sim (NP)
C3 0.799 0.126 0.002** Sim (NP)
2 High FRE C1 0.997 0.021* 0.038* Single (P)
C2 0.266 0.039* 0.028* Single (P) C3 0.875 0.026* 0.010** Single (P) TRE C1 0.266 0.039* 0.028* Single (P) C2 / / / No lim C3 / / / No lim Significant p‐values: <0.001***; <0.05**; <0.01*.
impact the growth induced by nutrient enrichment during the sum-mer.
Our colimitation experiments revealed three configurations of nutrient limitation. Phytoplankton was either strictly limited by P, simultaneously limited by N and P or not limited by N and P. Limita-tion by P or no limitaLimita-tion was found when DIN concentraLimita-tions and DIN:SRP ratios were high in the sampled water, while NP colimita-tion occurred at the lowest DIN (DIN< 0.05 mg/L) and DIN:SRP ratios (DIN:SRP< 6). In accordance with previous studies, the types of nutrient limitation found in microcosms were closely linked to the N and P stoichiometry of the water (Morris & Lewis, 1988). Assum-ing standard stoichiometric compositional ratios of phytoplankton cells, the probability of P‐limitation or N‐limitation increases when the N:P ratio in water is respectively above or below the mean nutri-tional demand of phytoplankton, corresponding to the Redfield ratio of 7:1 on a mass basis (Loladze & Elser, 2011). At lower ratios, Berg-ström et al. (2008) have shown in unproductive lakes of northern Europe that strict limitation by N predominates when the ratio of bioavailable N to bioavailable P in water is below the threshold of 1.5 on a mass basis. In our study, the occurrence of NP simultaneous colimitation was consistent with DIN:SRP ratios ranging between these two thresholds, while P limitation or no limitation was found at higher ratios.
The phytoplankton in Lake COR mainly consisted of chloro-phytes, chrysochloro-phytes, diatoms and dinoflagellates. The community F I G U R E 5 Linear regression between phytoplankton growth rates in microcosms and sampling time during the ice‐free period, according to the two types of nutrient conditions (τ‐control in dotted line and τ‐enrichment in limiting nutrients in solid line). Results are presented for each lake, for each sampling campaign represented as the number of days since the first day of sampling (C1, C2 and C3) and for the four initial microcosm nutrient enrichments (no addition—N0P0, N addition—N1P0, P addition—N0P1, N plus P addition—N1P1). White symbols are for the microcosms attached to theτ‐control category and black symbols for the τ‐enrichment category
T A B L E 4 Summary of the mixed‐effect models performed for each lake. The response variable is the growth rate achieved in microcosms. The explanatory variables are sampling time during the ice‐free period (Campaign) and nutrient treatment (Treatment). The effects of explanatory variables on growth rates are expressed relative to controls Area N‐deposition rate Lakes Explanatory variables Estimate Pr(>|t|)
1 Low PIS Campaign 0.000 0.132 Treatment 0.211 <0.001*** Treatment: Campaign −0.001 <0.001*** COR Campaign −0.001 0.221 Treatment 0.092 <0.001*** Treatment: Campaign 0.000 0.614
2 High FRE Campaign 0.001 <0.001*** Treatment 0.139 <0.001*** Treatment: Campaign 0.000 0.263 TRE Campaign 0.002 <0.001*** Treatment 0.141 <0.001*** Treatment: Campaign −0.001 0.005** Significant p‐values: <0.001***; <0.05**; <0.01*.
composition varied little in the successive sampling campaigns, as supported by the low dissimilarity indices. In that case, the phyto-plankton growth induced by nutrient enrichment (i.e., the difference between the growth rates in the control and the enriched micro-cosms) did not significantly vary throughout the summer.
The community composition in Lake PIS also varied slightly in the successive sampling campaigns. The low evenness and the high dissimilarity indices resulted from the dominance of a small centric diatom, Cyclotella comensis (data not shown) and from the replace-ment of the rare species in the phytoplankton assemblages. How-ever, in that case, the phytoplankton growth induced by nutrient enrichment decreased throughout the summer. Previous research has found that other nutrients than N or P can play a role in limiting phytoplankton growth in unproductive lakes (Vrede & Tranvik, 2006). SiO2is an essential component of diatom cell walls (Reynolds, 2006). The threshold of 0.5 mg/L was reported as a necessary con-centration to permit further diatom cell divisions in water (Lund, 1950). In Lake PIS, Si concentrations sharply decreased throughout the summer and probably limited the extent of diatom growth in enriched microcosms.
The phytoplankton in Lake FRE was dominated by chlorophytes, although dinoflagellates were also well represented in early summer. The low evenness and the high dissimilarity indices further illustrated how the dominance moved from the small chlorophytes Chlorella
vul-garis in early summer to the larger chlorophytes Planktosphaeria gelatinosa in late summer (data not shown). Such changes in
commu-nity composition did not imply changes in the phytoplankton growth induced by nutrient enrichment throughout the summer.
The phytoplankton in Lake TRE varied in the successive sampling campaigns. The highest evenness found in midsummer was a transi-tional state from a community dominated by small flagellated crypto-phytes in early summer, such as Plagioselmis nannoplanctica and
Cryptomonas sp., to a community dominated by larger nonmotile
colonial chlorophytes in late summer, such as Oocystis lacustris,
Cru-cigeniella pulchra and Coelastrum microporum Nägeli (data not shown).
In the one hand, the growth rates increased more in the control microcosms than in the enriched microcosms throughout the sum-mer, to eventually reach identical growth rates in late summer. On the other hand, the added P was always consumed during the incu-bation periods in the enriched microcosms. These results likely high-lighted a larger P‐storage ability of the late summer phytoplankton in Lake TRE. Indeed,“storage adapted species” can uptake and store a large amount of P when temporarily available in water, and draw upon the stored P to support growth for multiple generations under low P conditions (Sommer, 1984). Internal storage of P occurs in all organisms, including phytoplankton. The storage efficiency greatly varies among phytoplankton species (Reynolds, 2006) and can be high in chlorophytes (Grover, 1991b). In addition, the larger the size, as in Lake TRE’s chlorophytes, the greater the potential internal stor-age (Grover, 1991a; Lin, Litaker, & Sunda, 2016).
Overall, the colimitation experiments reveal P to be the main lim-iting nutrient of phytoplankton and the potential for simultaneous colimitation with N depending on nutrient stoichiometry. Changes in
phytoplankton composition throughout the summer may result in significant declines in growth rates under nutrient enrichment if spe-cies with P‐storage abilities are present in assemblages. Phytoplank-ton growth may be limited by nutrients other than N and P, such as SiO2, according to the requirements of specific taxa such as diatoms dominating the phytoplankton assemblages.
4.2
|
Specific inferences for the phytoplankton of
French alpine lakes
In the high mountain lakes of the Northern Hemisphere, phytoplank-ton development is particularly subject to nutrient limitation during the ice‐free summer, when temperature and light reach nonlimiting levels (Bergstrom et al., 2013; Lewis, 2011). In this article, we stud-ied the summer phytoplankton of four French alpine lakes charac-terised by contrasting N‐deposition rates and contrasting catchments.
Previous studies have suggested that the chemistry of atmo-spheric deposition plays a role in determining the N and P stoi-chiometry, the trophic status and the type of phytoplankton nutrient limitation in unproductive remote lakes (Brahney, Mahowald, Ward, Ballantyne, & Neff, 2015; Lepori & Keck, 2012). In diverse mountain ranges of North America (Elser et al., 2009) or in Europe (Bergstrom et al., 2008), N‐limitation appears to be a natural state found in lakes exposed to low rates of N‐deposition (<250 kg N km−2year−1). P limitation appears to be a derived character induced by the enhanced N anthropogenic emission observed in the Northern Hemisphere during the last century (Galloway et al., 2004) and now commonly found under high rates of N‐deposition (≥500 kg N km−2 year−1). Colimitation by N and P is found at intermediate ranges of N‐deposition. However, some authors have reported a further possi-ble reversion from P‐ to N‐limitation when lakes are exposed to high rates of N‐deposition, but proximal to P‐emission sources (Camarero & Catalan, 2012; Vicars et al., 2010).
The P limitation of the phytoplankton sampled in lakes FRE and TRE was consistent with the high level of N‐deposition prevailing in area 2, above the critical load found to favour P limitation in lakes (500 kg N km−2year−1; Bergstrom & Jansson, 2006). However, it is interesting to note different patterns of nutrient limitation for lakes PIS and COR in area 1, exposed to N‐deposition rates overlapping this threshold. The phytoplankton from Lake PIS was only P‐limited, while the phytoplankton from lake COR was either P‐ or NP‐colim-ited depending on the sampling campaign.
In addition to atmospheric influence, different catchment charac-teristics have already been shown to cause variations in phytoplank-ton nutrient limitation in lakes sharing similar N‐deposition and climatic conditions (Nydick, Lafrancois, Baron, & Johnson, 2003). The catchments have a buffering capacity and can partly retain the ele-ments deposited from the atmosphere. The N‐retention capacity in catchments is a function of the maximum biological uptake of N, which increases with the amount of soil, the extent of vegetative cover and the microbial N‐cycling processes in soils (Burns, 2004; Kopacek, Stuchlik, & Wright, 2005). When the deposited N exceeds
the nutritional demand by plants and microorganisms, the incoming N is leached below the rooting zone and reaches surface water, increasing nitrate concentrations in lakes (Wright et al., 2001). Through these processes, similar levels of N‐deposition can result in substantially different rates of N‐leaching among catchments. Con-versely, the P‐retention capacity decreases with the amount of soil and biological activity in catchments, because P‐leaching increases with the terrestrial export of dissolved organic matter. As a result, P deposits are better retained by rocky catchment (Kopacek, Hejzlar, Vrba, & Stuchlik, 2011).
Lakes PIS and FRE have rocky catchments, a landscape naturally conducive to lower TP relative to DIN supply in lakes and favouring P limitation. Lakes COR and TRE have catchments with more devel-oped soils, meadows and pasture practices, favouring higher TP rela-tive to DIN supply in lakes and N‐limitation. Supporting these assumptions, the mean DIN concentration of the lakes with large vegetated catchments was lower than the lakes with small rocky catchments in each area. In area 2, where N‐deposition rates are high, the characteristics of the catchments influenced the nutrient stoichiometry in lakes FRE and TRE without altering the P limitation of the phytoplankton. In area 1, where N‐deposition rates are low, the characteristics of the catchments influenced the nutrient stoi-chiometry in lakes PIS and COR and led to a switch from P to NP colimitation in Lake COR. An interesting inference from our study is that nutrient limitation in the lakes located in the northern French alpine lakes is more likely to vary according to differences in catch-ment characteristics than that of the southern French alpine lakes.
Furthermore, our results showed that DIN concentrations decreased during the summer in all lakes. This decrease is consistent with the dynamics of DIN in high‐altitude lakes noted by some authors (Rogora, Arisci, & Marchetto, 2012). A large flow of N‐ enriched water enters the lakes during the snowmelt and results in a large pool of DIN available in spring. DIN concentration then tends to decline because N‐supply from run‐off and precipitation events fails to compensate for N losses by biological uptake, denitrification and exports downstream from lakes (Bergstrom et al., 2008; Molot & Dillon, 1993). Therefore, the seasonal DIN variation in these ecosystems is a factor favouring late summer NP simultaneous col-imitation in high mountain lakes, as shown for Lake COR here.
The growth rates of the phytoplankton from area 2 (lakes FRE and TRE) increased in the control microcosms throughout the sum-mer, which was not the case for the phytoplankton from area 1 (lakes PIS and COR). This increase cannot be explained by the pres-ence of faster growing species in late summer assemblages. Indeed, in that case, the difference between the growth rates in the control and the enriched microcosms would have increased too. Another possible explanation is the increased availability of the limiting nutri-ent, P, in lake water over the summer. The southern French Alps is on the trajectory of enriched P‐dust emitted from the Sahara Desert and the semi‐arid Sahelian region (Moulin & Chiapello, 2004). P‐dust transport is known to increase during the summer at high altitude, between 1500 and 4000 m above sea level (Talbot et al., 1986). The SRP concentrations measured in lakes FRE and TRE did not
significantly increase and remained low over the summer. SRP being the most readily available form of P for aquatic organisms, it is rapidly processed in water and does not reflect the total bioavailable pool of P for phytoplankton growth (Lewis & Wurtsbaugh, 2008). That is probably why the influence of P‐deposition on the water chemistry was not evidenced by the SRP concentrations. We never-theless suggest that North African dust deposition may increase the total availability of P over the summer in the southern French alpine lakes, as noted in the neighbouring Spanish Sierra Nevada lakes (Camarero & Catalan, 2012; Villar‐Argaiz et al., 2001). What is more, P‐deposition rates seem to be insufficient to counterbalance N‐ deposition rates and to switch the P limitation of the phytoplankton to N‐limitation.
Our results also revealed that the phytoplankton response to N and/or P enrichment can vary throughout the summer according to community composition. First, we found in Lake TRE that the growth rate of alpine phytoplankton assemblages limited by P can decrease throughout phytoplankton succession by the appearance of P‐storage‐adapted species. It is interesting that these results contrast with experimental studies conducted on the Spanish Sierra Nevada lakes that predict the development of fast‐growing chlorophytes species in late summer under enriched P‐dust deposition (Delgado‐ Molina, Carrillo, et al., 2009; Delgado‐Molina, Medina‐Sanchez, Villar‐Argaiz, Bullejos‐Carrillo, & Carrillo, 2009). In case of P load in lakes, such differences in growth rates will induce slower short‐term phytoplankton response following nutrient enrichment in lakes. However, it does not predict lower ecological repercussions of phy-toplankton growth, that is, the maximum growth possible and the gain in biovolume induced by a given nutrient enrichment.
Second, in Lake PIS, we observed that the growth of phytoplank-ton dominated by diatoms is likely to be limited by SiO2when other limiting nutrients are available in water. The main source of silica in mountain lakes comes from the weathering of siliceous bedrock in catchments. During the snowmelt in spring, a large flow of water replenishes the pool of SiO2in lakes (Znachor, Visocka, Nedoma, & Rychtecky, 2013). In Lake PIS, SiO2concentrations declined by 70% over the summer. The supply from run‐off and recycling processes probably failed to compensate for consumption by diatoms, losses by diatoms sinking and/or losses by washout (Hobbs et al., 2010). In such conditions, our results further highlight that silica‐colimitation is likely to increase in late summer. Indeed, the available silica determi-nes the capacity of the water to support diatom growth when other limiting nutrients are plentiful (Lund, 1950). The maximum size of dia-tom populations declines when silica is depleted (Thackeray, Jones, & Maberly, 2008). Third, we showed in Lake COR that changes in nutri-ent limitation, from P to NP simultaneous colimitation, did not induce changes in the growth of phytoplankton assemblages.
4.3
|
Future scenarios of phytoplankton growth
under global changes
The French Alps are predicted to experience major environmental changes in the future (Gobiet et al., 2014; Rajczak et al., 2013).
Changes expected during summer in this area include intense warm-ing, lower average rainfall, stronger heat waves and more extreme precipitation events (Rajczak et al., 2013). Among other conse-quences, warming will strengthen stratification processes in water-bodies and will enhance weathering processes and soil development in catchments. These phenomena will increase P‐leaching from sedi-ments and catchsedi-ments, and catchment N‐retention capacity. In addi-tion, P‐deposition rates are likely to increase in the southern French Alps in line with increased emissions of enriched P‐dust from the North African region (Moulin & Chiapello, 2004). N‐emissions are projected to slightly decrease or to remain steady at least until 2050 (Galloway et al., 2004). Extreme precipitation events will increase the transfer of nutrients from catchments to lakes and result in less frequent but stronger pulses of DIN or TP in lakes.
The forecast global changes should thus converge to decrease the N:P ratios in lakes. Until NP colimitation, an increase in phyto-plankton growth is expected in most high mountain lakes where P is the main limiting nutrient. These changes are likely to be of lower extent in lakes with large vegetated catchments in the northern area with lower N‐deposition rates and of higher extent in the southern area with higher N‐deposition rates and future P‐deposition rates. Based on these assumptions, the extent of phytoplankton growth and the ecological impact in high mountain lakes will further vary according to (a) the composition of the phytoplankton assemblages; (b) other growth‐limiting factors in lakes, such as light or tempera-ture, micronutrient availability or zooplankton predation; (c) parame-ters influencing nutrient availability in lakes, such as pH or lake depth.
By investigating the relationship between nutrient availability, phytoplankton composition and phytoplankton growth rate, this experimental laboratory microcosm study will help interpret current multifactorial data from in situ monitoring networks in the Alps. It will also be helpful to develop models to better predict the sentinel lake responses to local and global changes.
A C K N O W L E D G M E N T S
We thank the Ecrins and Mercantour national parks staff and the “Hautes Alpes” departmental unit of French National Agency for Bio-diversity for help with the field sampling, Flavia Dory for her help with the experiments and Dr. Morgan Dutilleul for his help with the statisti-cal analyses. This work was funded by the French National Agency for Biodiversity and is a part of Coralie Jacquemin’s PhD thesis.
O R C I D
R E F E R E N C E S
Adrian, R., O’Reilly, C. M., Zagarese, H., Baines, S. B., Hessen, D. O., Kel-ler, W.,… Winder, M. (2009). Lakes as sentinels of climate change.
Limnology and Oceanography, 54(6), 2283–2297. https://doi.org/10.
4319/lo.2009.54.6_part_2.2283
Anneville, O., Souissi, S., Gammeter, S., & Straile, D. (2004). Seasonal and inter‐annual scales of variability in phytoplankton assemblages: Com-parison of phytoplankton dynamics in three peri‐alpine lakes over a period of 28 years. Freshwater Biology, 49(1), 98–115. https://doi. org/10.1046/j.1365-2426.2003.01167.x
Auer, I., Bohm, R., Jurkovic, A., Lipa, W., Orlik, A., Potzmann, R.,… Nie-plova, E. (2007). HISTALP– historical instrumental climatological sur-face time series of the Greater Alpine Region. International Journal of
Climatology, 27(1), 17–46. https://doi.org/10.1002/joc.1377
Battarbee, R. W., Kernan, M., & Rose, N. (2009). Threatened and stressed mountain lakes of Europe: Assessment and progress. Aquatic
Ecosys-tem Health & Management, 12(2), 118–128. https://doi.org/10.1080/
14634980902905742
Beardall, J., Young, E., & Roberts, S. (2001). Approaches for determining phytoplankton nutrient limitation. Aquatic Sciences, 63(1), 44–69. https://doi.org/10.1007/pl00001344
Bergstrom, A. K., Blomqvist, P., & Jansson, M. (2005). Effects of atmo-spheric nitrogen deposition on nutrient limitation and phytoplankton biomass in unproductive Swedish lakes. Limnology and Oceanography,
50(3), 987–994. https://doi.org/10.4319/lo.2005.50.3.0987
Bergstrom, A. K., Faithfull, C., Karlsson, D., & Karlsson, J. (2013). Nitro-gen deposition and warming– Effects on phytoplankton nutrient limi-tation in subarctic lakes. Global Change Biology, 19(8), 2557–2568. https://doi.org/10.1111/gcb.12234
Bergstrom, A. K., & Jansson, M. (2006). Atmospheric nitrogen deposition has caused nitrogen enrichment and eutrophication of lakes in the northern hemisphere. Global Change Biology, 12(4), 635–643. https://doi.org/10.1111/j.1365-2486.2006.01129.x
Bergstrom, A. K., Jonsson, A., & Jansson, M. (2008). Phytoplankton responses to nitrogen and phosphorus enrichment in unproductive Swedish lakes along a gradient of atmospheric nitrogen deposition.
Aquatic Biology, 4(1), 55–64. https://doi.org/10.3354/ab00099
Birck, C., Epaillard, I., Leccia, M. F., Crassous, C., Morand, A., Miaud, C., … Arnaud, F. (2013). Sentinel lakes: A network for the study and management of mountain lakes in the French Alps and in Corsica.
Eco Mont‐Journal on Protected Mountain Areas Research, 5(1), 63–69.
Brahney, J., Ballantyne, A. P., Kociolek, P., Leavitt, P. R., Farmer, G. L., & Neff, J. C. (2015). Ecological changes in two contrasting lakes associ-ated with human activity and dust transport in western Wyoming.
Limnology and Oceanography, 60(2), 678–695. https://doi.org/10.
1002/lno.10050
Brahney, J., Mahowald, N., Ward, D. S., Ballantyne, A. P., & Neff, J. C. (2015). Is atmospheric phosphorus pollution altering global alpine Lake stoichiometry? Global Biogeochemical Cycles, 29(9), 1369–1383. https://doi.org/10.1002/2015gb005137
Bullejos, F. J., Carrillo, P., Gorokhova, E., Medina-Sanchez, J. M., Balseiro, E. G., & Villar-Argaiz, M. (2014). Shifts in food quality for herbivorous consumer growth: Multiple golden means in the life history. Ecology,
95(5), 1272–1284. https://doi.org/10.1890/13-0410.1
Burns, D. A. (2004). The effects of atmospheric nitrogen deposition in the Rocky Mountains of Colorado and southern Wyoming, USA – a critical review. Environmental Pollution, 127(2), 257–269. https://doi. org/10.1016/s0269-7491(03)00264-1
Camarero, L., & Catalan, J. (2012). Atmospheric phosphorus deposition may cause lakes to revert from phosphorus limitation back to nitro-gen limitation. Nature Communications, 3, 5. https://doi.org/10.1038/ ncomms2125
Camarero, L., Rogora, M., Mosello, R., Anderson, N. J., Barbieri, A., Botev, I., … Wright, R. F. (2009). Regionalisation of chemical variability in European mountain lakes. Freshwater Biology, 54(12), 2452–2469. https://doi.org/10.1111/j.1365-2427.2009.02296.x
de Senerpont Domis, L. N. D., Elser, J. J., Gsell, A. S., Huszar, V. L. M., Ibelings, B. W., Jeppesen, E.,… Lurling, M. (2013). Plankton dynamics
under different climatic conditions in space and time. Freshwater
Biol-ogy, 58(3), 463–482. https://doi.org/10.1111/fwb.12053
Delgado-Molina, J. A., Carrillo, P., Medina-Sanchez, J. M., Villar-Argaiz, M., & Bullejos, F. J. (2009). Interactive effects of phosphorus loads and ambient ultraviolet radiation on the algal community in a high‐ mountain lake. Journal of Plankton Research, 31(6), 619–634. https://d oi.org/10.1093/plankt/fbp018
Delgado-Molina, J. A., Medina-Sanchez, J. M., Villar-Argaiz, M., Bullejos-Carrillo, F. J., & Bullejos-Carrillo, P. (2009). Induced algal community changes by UV radiation and nutrient inputs: A long-term experimental study in Lake La Caldera (Sierra Nevada, Spain). In J. Jones, & J. Faaborg (Eds.), International Association of theoretical and applied limnology, Vol
30, Pt 6, Proceedings, Vol. 30 (pp. 919–922). Stuttgart, Germany: E
Schweizerbart’sche Verlagsbuchhandlung.
Dubourg, P., North, R. L., Hunter, K., Vandergucht, D. M., Abirhire, O., Silsbe, G. M.,… Hudson, J. J. (2015). Light and nutrient co‐limitation of phytoplankton communities in a large reservoir: Lake Diefenbaker, Saskatchewan, Canada. Journal of Great Lakes Research, 41, 129–143. https://doi.org/10.1016/j.jglr.2015.10.001
Elser, J. J., Kyle, M., Steger, L., Nydick, K. R., & Baron, J. S. (2009). Nutri-ent availability and phytoplankton nutriNutri-ent limitation across a gradi-ent of atmospheric nitrogen deposition. Ecology, 90(11), 3062–3073. https://doi.org/10.1890/08-1742.1
Elser, J. J., Peace, A. L., Kyle, M., Wojewodzic, M., McCrackin, M. L., Andersen, T., & Hessen, D. O. (2010). Atmospheric nitrogen deposi-tion is associated with elevated phosphorus limitadeposi-tion of lake zoo-plankton. Ecology Letters, 13(10), 1256–1261. https://doi.org/10. 1111/j.1461-0248.2010.01519.x
Fagerli, H., Tsyro, S., Simpson, D., Schulz, M., Gauss, M., Jonson, J. E.,… Valiyaveetil, S. (2015). EMEP Status Report 2015– Transboundary
par-ticulate matter, photo-oxidants, acidifying and eutrophying components.
Norwegian Meteorological Institute.
Felip, M., & Catalan, J. (2000). The relationship between phytoplankton biovolume and chlorophyll in a deep oligotrophic lake: Decoupling in their spatial and temporal maxima. Journal of Plankton Research, 22(1), 91–105. https://doi.org/10.1093/plankt/22.1.91
Galloway, J. N., Dentener, F. J., Capone, D. G., Boyer, E. W., Howarth, R. W., Seitzinger, S. P., … Vorosmarty, C. J. (2004). Nitrogen cycles: Past, present, and future. Biogeochemistry, 70(2), 153–226. https://d oi.org/10.1007/s10533-004-0370-0
Giguet-Covex, C., Arnaud, F., Poulenard, J., Disnar, J. R., Delhon, C., Fran-cus, P.,… Delannoy, J. J. (2011). Changes in erosion patterns during the Holocene in a currently treeless subalpine catchment inferred from lake sediment geochemistry (Lake Anterne, 2063 m a.s.l., NW French Alps): The role of climate and human activities. Holocene, 21 (4), 651–665. https://doi.org/10.1177/0959683610391320 Gobiet, A., Kotlarski, S., Beniston, M., Heinrich, G., Rajczak, J., & Stoffel,
M. (2014). 21st century climate change in the European Alps‐A review. Science of the Total Environment, 493, 1138–1151. https://d oi.org/10.1016/j.scitotenv.2013.07.050
Grover, J. P. (1991a). Nonsteady state dynamics of algal population growth– Experiments with 2 chlorophytes. Journal of Phycology, 27 (1), 70–79. https://doi.org/10.1111/j.0022-3646.1991.00070.x Grover, J. P. (1991b). Resource competition in a variable environment:
Phytoplankton growing according to the variable internal stores model. The American Naturalist, 138(4), 811–835. https://doi.org/10. 1086/285254
Guillard, R. R. L. (1973). Division rates. In J. R. Stein (Ed.), Handbook
of phycological method – Culture methods and growth measurements
(pp. 289–311). London, UK: Cambridge Univ. Press.
Guillard, R. R. L. (1978). Counting slides. In A. Sournia (Ed.), Phytoplankton
manual. A guide to the measurement of marine primary production under some special conditions, Vol. 6 (pp. 182–189). Paris, France:
Uni-ted Nations Educational, Scientific and Cultural Organization.
Harpole, W. S., Ngai, J. T., Cleland, E. E., Seabloom, E. W., Borer, E. T., Bracken, M. E. S.,… Smith, J. E. (2011). Nutrient co‐limitation of pri-mary producer communities. Ecology Letters, 14(9), 852–862. https://doi.org/10.1111/j.1461-0248.2011.01651.x
Hart, B. T. (1984). Eutrophication of waters – Monitoring, assessment and control – OECD. Search, 15(1–2), 50. https://doi.org/10.1002/ iroh.19840690206
Hobbs, W. O., Lalonde, S. V., Vinebrooke, R. D., Konhauser, K. O., Weid-man, R. P., Graham, M. D., & Wolfe, A. P. (2010). Algal‐silica cycling and pigment diagenesis in recent alpine lake sediments: Mechanisms and paleoecological implications. Journal of Paleolimnology, 44(2), 613–628. https://doi.org/10.1007/s10933-010-9441-5
Knapp, R. A., Matthews, K. R., & Sarnelle, O. (2001). Resistance and resi-lience of alpine lake fauna to fish introductions. Ecological
Mono-graphs, 71(3), 401–421. https://doi.org/10.1890/0012-9615(2001)
071[0401:raroal]2.0.co;2
Kopacek, J., Hejzlar, J., Vrba, J., & Stuchlik, E. (2011). Phosphorus loading of mountain lakes: Terrestrial export and atmospheric deposition.
Limnology and Oceanography, 56(4), 1343–1354. https://doi.org/10.
4319/lo.2011.56.4.1343
Kopacek, J., Stuchlik, E., & Wright, R. F. (2005). Long‐term trends and spatial variability in nitrate leaching from alpine catchment – Lake ecosystems in the Tatra Mountains (Slovakia‐Poland). Environmental
Pollution, 136(1), 89–101. https://doi.org/10.1016/j.envpol.2004.12.
012
Kuznetsova, A., Brockhoff, P. B., & Christensen, R. H. B. (2016). lmerTest:
Tests in Linear Mixed Effects Models. R package version 2.0-33.
Retrieved from https://CRAN.R-project.org/package=lmerTest. Lepori, F., & Keck, F. (2012). Effects of atmospheric nitrogen deposition
on remote freshwater ecosystems. Ambio, 41(3), 235–246. https://d oi.org/10.1007/s13280-012-0250-0
Lewis, W. M. (2011). Global primary production of lakes: 19th Baldi Memorial Lecture. Inland Waters, 1(1), 1–28. https://doi.org/10.5268/ iw-1.1.384
Lewis, W. M., & Wurtsbaugh, W. A. (2008). Control of Lacustrine phyto-plankton by nutrients: Erosion of the phosphorus paradigm.
Interna-tional Review of Hydrobiology, 93(4–5), 446–465. https://doi.org/10.
1002/iroh.200811065
Lin, S. J., Litaker, R. W., & Sunda, W. G. (2016). Phosphorus physiological ecology and molecular mechanisms in marine phytoplankton. Journal
of Phycology, 52(1), 10–36. https://doi.org/10.1111/jpy.12365
Loladze, I., & Elser, J. J. (2011). The origins of the Redfield nitrogen‐to‐ phosphorus ratio are in a homoeostatic protein‐to‐rRNA ratio. Ecology
Letters, 14(3), 244–250. https://doi.org/10.1111/j.1461-0248.2010.
01577.x
Lund, J. W. G. (1950). Studies on Asterionella formosa Hass II. Nutrient depletion and the spring maximum. Part II. Discussion. Journal of
Ecol-ogy, 38, 15–32. https://doi.org/10.2307/2256523
Lund, J. W. G. (1981). Citation classic– The inverted microscope method of estimated algal numbers and the statistical basis of estimations by counting. Current Contents/Agriculture Biology & Environmental Sciences, 43, 20.
Molot, L. A., & Dillon, P. J. (1993). Nitrogen mass balances and denitrifi-cation rates in central Ontario lakes. Biogeochemistry, 20(3), 195–212. https://doi.org/10.1007/bf00000787
Morris, D. P., & Lewis, W. M. (1988). Phytoplankton nutrient limitation in Colorado mountain lakes. Freshwater Biology, 20(3), 315–327. https://doi.org/10.1111/j.1365-2427.1988.tb00457.x
Moulin, C., & Chiapello, I. (2004). Evidence of the control of summer atmospheric transport of African dust over the Atlantic by Sahel sources from TOMS satellites (1979–2000). Geophysical Research
Let-ters, 31(2), 4. https://doi.org/10.1029/2003gl018931
Nydick, K. R., Lafrancois, B. M., Baron, J. S., & Johnson, B. M. (2003). Lake‐specific responses to elevated atmospheric nitrogen deposition
in the Colorado Rocky Mountains, USA. Hydrobiologia, 510(1–3), 103–114. https://doi.org/10.1023/b:hydr.0000008636.13361.47 Padisák, J. (2004). Phytoplankton. In P. E. O’Sullivan, & C. S. Reynolds
(Eds.), The lakes handbook – Limnology and limnetic ecology, Vol. 1 (pp. 251–309). Hoboken, NJ: Blackwell Science Ltd.
Pielou, E. C. (1974). Population and community ecology. Chicago, IL: G. Beach.
Rajczak, J., Pall, P., & Schar, C. (2013). Projections of extreme precipita-tion events in regional climate simulaprecipita-tions for Europe and the Alpine Region. Journal of Geophysical Research‐Atmospheres, 118(9), 3610– 3626. https://doi.org/10.1002/jgrd.50297
Reynolds, C. S. (1958). The biological control of chemical factors in the environment. The American Scientist, 46(3), 205–221.
Reynolds, C. S. (2006). The ecology of freshwater phytoplankton. New York, NY: C. U. Press. https://doi.org/10.1017/CBO9780511542145 Rivier, B. (1996). Lacs de haute altitude: méthodes d’échantillonnage
ichtylogique, gestion piscicole. Série Gestion des milieux aquatiques.
Coll. Etudes du CEMAGREF (11), 1–122.
Rogora, M., Arisci, S., & Marchetto, A. (2012). The role of nitrogen depo-sition in the recent nitrate decline in lakes and rivers in Northern Italy. Science of the Total Environment, 417, 214–223. https://doi.org/ 10.1016/j.scitotenv.2011.12.067
Rott, E. (1988). Some aspects of the seasonal distribution of flagellates in mountain lakes. Hydrobiologia, 161, 159–170. https://doi.org/10. 1007/bf00044108
Schindler, D. E., Knapp, R. A., & Leavitt, P. R. (2001). Alteration of nutri-ent cycles and algal production resulting from fish introductions into mountain lakes. Ecosystems, 4(4), 308–321. https://doi.org/10.1007/ s10021-001-0013-4
Sommer, U. (1984). The paradox of the plankton– Fluctuations of phos-phorus availability maintain diversity of phytoplankton in flow‐ through cultures. Limnology and Oceanography, 29(3), 633–636. https://doi.org/10.4319/lo.1984.29.3.0633
Sterner, R. W. (2008). On the phosphorus limitation paradigm for lakes.
International Review of Hydrobiology, 93(4–5), 433–445. https://doi.
org/10.1002/iroh.200811068
Talbot, R. W., Harriss, R. C., Browell, E. V., Gregory, G. L., Sebacher, D. I., & Beck, S. M. (1986). Distribution and geochemistry of aerosols in the tropical North‐Atlantic troposphere – Relationship to Saharan dust. Journal of Geophysical Research‐Atmospheres, 91(D4), 5173– 5182. https://doi.org/10.1029/JD091iD04p05173
Thackeray, S. J., Jones, I. D., & Maberly, S. C. (2008). Long‐term change in the phenology of spring phytoplankton: Species‐specific responses to nutrient enrichment and climatic change. Journal of Ecology, 96(3), 523–535. https://doi.org/10.1111/j.1365-2745.2008.01355.x Tolotti, M., Manca, M., Angeli, N., Morabito, G., Thaler, B., Rott, E., &
Stuch-lik, E. (2006). Phytoplankton and zooplankton associations in a set of Alpine high altitude lakes: Geographic distribution and ecology.
Hydro-biologia, 562, 99–122. https://doi.org/10.1007/s10750-005-1807-8
Utermöhl, H. (1958). Toward the improvement of the quantitative phytoplank-ton method. Mitteilungen International Verieningung für Limnologie, 9, 1–39. Vicars, W. C., Sickman, J. O., & Ziemann, P. J. (2010). Atmospheric
phos-phorus deposition at a montane site: Size distribution, effects of wild-fire, and ecological implications. Atmospheric Environment, 44(24), 2813–2821. https://doi.org/10.1016/j.atmosenv.2010.04.055 Villar-Argaiz, M., Medina-Sanchez, J. M., Cruz-Pizarro, L., & Carrillo, P.
(2001). Inter‐ and intra‐annual variability in the phytoplankton
community of a high mountain lake: The influence of external (atmo-spheric) and internal (recycled) sources of phosphorus. Freshwater
Biology, 46(8), 1017–1034. https://doi.org/10.1046/j.1365-2427. 2001.00734.x
Vrede, T., & Tranvik, L. J. (2006). Iron constraints on planktonic primary production in oligotrophic lakes. Ecosystems, 9(7), 1094–1105. https://doi.org/10.1007/s10021-006-0167-1
Williams, M. W., Baron, J. S., Caine, N., Sommerfeld, R., & Sanford, R. (1996). Nitrogen saturation in the Rocky Mountains. Environmental
Science & Technology, 30(2), 640–646. https://doi.org/10.1021/
es950383e
Williamson, C. E., Saros, J. E., Vincent, W. F., & Smol, J. P. (2009). Lakes and reservoirs as sentinels, integrators, and regulators of climate change. Limnology and Oceanography, 54(6), 2273–2282. https://doi. org/10.4319/lo.2009.54.6_part_2.2273
Wilson, M. V., & Shmida, A. (1984). Measuring beta diversity with pres-ence‐absence data. Journal of Ecology, 72, 1055–1064. https://doi. org/10.1046/j.1365-2656.2003.00710.x
Winder, M., & Sommer, U. (2012). Phytoplankton response to a changing climate. Hydrobiologia, 698(1), 5–16. https://doi.org/10.1007/s10750-012-1149-2
Wolfe, A. P., Van Gorp, A. C., & Baron, J. S. (2003). Recent ecological and biogeochemical changes in alpine lakes of Rocky Mountain National Park (Colorado, USA): A response to anthropogenic nitrogen deposition. Geobiology, 1(2), 153–168. https://doi.org/10.1046/j. 1472-4669.2003.00012.x
Wright, R. F., Alewell, C., Cullen, J. M., Evans, C. D., Marchetto, A., Mol-dan, F., … Rogora, M. (2001). Trends in nitrogen deposition and leaching in acid‐sensitive streams in Europe. Hydrology and Earth
Sys-tem Sciences, 5(3), 299–310.
https://doi.org/10.5194/hess-5-299-2001
Znachor, P., Visocka, V., Nedoma, J., & Rychtecky, P. (2013). Spatial heterogeneity of diatom silicification and growth in a eutrophic reser-voir. Freshwater Biology, 58(9), 1889–1902. https://doi.org/10.1111/ fwb.12178
Zuur, A. F., Ieno, E. N., Walker, N. J., Saveliev, A. A., & Smith, G. M. (2009). Mixed effects models and extensions in ecology with R. New York, NY: Springer. https://doi.org/10.1007/978-0-387-87458-6