UNIVERSITÉ DE MONTRÉAL
ESTIMATION AND VALIDATION OF POST-PEAK BEHAVIOUR OF HARD ROCKS
ARASH KHOSRAVI
DÉPARTEMENT DES GÉNIES CIVIL, GÉOLOGIQUE ET DES MINES (CGM) ÉCOLE POLYTECHNIQUE DE MONTRÉAL
THÈSE PRÉSENTÉE EN VUE DE L’OBTENTION DU DIPLÔME DE PHILOSOPHIAE DOCTOR
(GÉNIE MINÉRAL) AOÛT 2016
UNIVERSITÉ DE MONTRÉAL
ÉCOLE POLYTECHNIQUE DE MONTRÉAL
Cette thèse intitulée :
ESTIMATION AND VALIDATION OF POST-PEAK BEHAVIOUR OF HARD ROCKS
présentée par : KHOSRAVI Arash
en vue de l’obtention du diplôme de : Philosophiae Doctor a été dûment acceptée par le jury d’examen constitué de :
M. LI Li, Doctorat, président
M. SIMON Richard, Ph. D., membre et directeur de recherche M. BELEM Tikou, Ph. D., membre
DEDICATION
I dedicate this work to
ACKNOWLEDGEMENTS
First of all, I would like to thank my supervisor, Professor Richard Simon for giving me the opportunities to study at École Polytechnique de Montréal for my Ph.D. I would also like to thank my committee members Prof. Li Li from École Polytechnique de Montréal and Prof. Tikou Belem from UQAT, and my external examiner Prof. Ferri Hassani from McGill University for the time they have dedicated to reviewing my dissertation.
I would like to express my gratitude to Raglan mine (Glencore group) for providing the rock samples used in this study. Without the rock samples it was not possible to fulfill this research successfully.
I would also like to express my special thanks the technicians of the laboratories Rock and Soil Mechanics at École Polytechnique Mr. André Ducharme and Mr. Etienne Bélanger and Mr. Samuel Chénier for their technical support, encouragement and helps. I have learned a lot from these gentlemen.
I would like to acknowledge and thank Prof. Patrice Rivard and the technicians Mr. Danick Charbonneau and Mrs. Ghislaine Luc for their supports to conduct a big part of my laboratory tests at University of Sherbrooke and also for any progress in my thesis.
I would also like to thank Prof. Ferri Hassani and Mr. Pejman Nekoovaght for their support and opportunity in preparing my first rock samples at the rock mechanics laboratory at McGill University.
I have a lot of things from friends in the department of mining engineering at Ecole Polytechnique of Montreal. This help and friendship is appreciated and acknowledged.
Finally, I would like to express my deepest gratitude to my lovely wife Nooshin and my son Arya for their endless love and support, without which, this life and thesis would not be possible.
RÉSUMÉ
Travailler en profondeur sous terre peut générer des situations dangereuses. Des précautions particulières doivent être prises lors de la phase de conception et d'exploitation. La rupture fragile du massif rocheux (coup de terrain) est l'un des instabilités qui peut se produire dans les roches dures ayant une faible porosité à cause de la concentration de contrainte élevée. Il est important de prévoir le comportement du massif rocheux lié à la phase post-pic lors de ruptures. La compréhension du comportement post-pic et le comportement en cisaillement d'un plan de rupture induite sous une condition de limite de chargement particulier est cruciale pour réduire les risques. Jusqu'ici, de nombreuses recherches ont été menées sur la surveillance sismique des excavations souterraines en situation potentielle de coups de terrain. Par ailleurs, quelques méthodes de prévision des coups de terrain ont été proposées basée sur les mathématiques logiques. La solution analytique est également l'une des approches fiables basées sur les travaux expérimentaux dans lesquels les propriétés mécaniques de la roche intacte et des fractures sont prises en compte.
L'objectif principal de cette thèse est de prédire la courbe post-pic de roches dures en utilisant des essais de compression triaxiale et de cisaillement direct et la caractérisation des fractures en utilisant le modèle CSDS (Simon, 1999) et l'approche proposée par Simon et al. (2003). Les résultats de la caractérisation de la surface de rupture montrent que comment les différents modes de chargement affectent les paramètres de rugosité des fractures. Les résultats indiquent également la variation de la rugosité de la surface de rupture avec la contrainte de confinement appliquée. La rugosité sur chaque surface de rupture indique la variation de la rugosité dans les échantillons en fonction de la distribution des contraintes.
La variation de la rugosité de la surface de rupture à la traction induite par l'essai Brésilien dévoile un effet combiné de la direction de chargement, la taille du grain, et le rapport L/D sur la valeur de la rugosité. Il est démontré que les profils de rugosité parallèles et perpendiculaires à la direction de chargement ont une variation de la rugosité distincte. Une nouvelle méthode de chargement appelée « chargement en dommage-contrôlé cyclique » proposée permet d'obtenir la courbe post-pic des roches dures, en utilisant une procédure spécifique. Les courbes complètes de contrainte-déformation de deux roches dures ont été obtenues par cette méthode.
Les résultats montrent que l'énergie élastique accumulée dans les échantillons en utilisant cette nouvelle procédure est moindre et comment la procédure influe sur la configuration de fracturation. Une approche existante basée sur le modèle constitutif CSDS pour les joints de roche a également été vérifiée afin d'estimer le comportement post-pic de roches dures. Il est démontré que cette approche est capable d'estimer les propriétés du modèle requis en utilisant les essais de compression triaxiale et de cisaillement direct et la caractérisation de la surface de rupture.
ABSTRACT
Working in deep underground opening is often accompanied by hazardous situations. Special care must be taken in the design and operation phase. Brittle fracturing of the rock mass (rockburst) is one of instabilities that occurs in hard rocks with low porosity due to high stress concentration. It is important to predict the rockburst behaviour that corresponds to the post-peak phase. Understanding of the post-peak behaviour and the shear behaviour of an induced failure plane under a particular loading boundary condition is a critical issue in order to prevent risks. To date, many researches have been conducted on the seismic monitoring of deep underground openings. Also, a few rockburst prediction methods have been proposed based on logical mathematics. Analytical solution is also one of the reliable approaches based on the experimental works in which the mechanical properties of both intact rock and fracture surface are taken into account.
The main objective of this thesis was to predict the post-peak curve of hard rocks using triaxial and direct shear tests and rock surface characterization by using the CSDS model (Simon, 1999) and the proposed approach by Simon et al. (2003). The results of fracture surface characterization show how different loading modes affect the roughness parameters of the fractures. The results also indicate the variation of the fracture roughness with the applied confining stress. The roughness on each fracture surface indicates the roughness variation in the samples due to the stress distribution.
Roughness variation of the tensile fractures induced by Brazilian tests reveals a combined effect of the loading direction, grain size, and the L/D ratio on the roughness value. It is shown that the roughness profiles parallel and perpendicular to the loading direction have a unique roughness variation. A new proposed damage-controlled cyclic method is used to obtain the post-peak curve of hard rocks using a specific procedure. The complete stress-strain curves of two hard rocks were obtained by this method.
The results show that the elastic energy accumulated in the specimens using this new procedure is lower and that the procedure influences the fracturing pattern. An existing approach based on the CSDS constitutive model for rock joints was also verified in order to estimate the post-peak behaviour of hard rocks. It is shown that this approach is able to estimate the required model properties using triaxial compression and direct shear tests and the surface characterization.
TABLE OF CONTENTS
DEDICATION ... III ACKNOWLEDGEMENTS ... IV RÉSUMÉ ... V ABSTRACT ... VII LIST OF TABLES ... XIV LIST OF FIGURES ... XVI
INTRUDUCTION ... 1 CHAPTER 1 Introduction ... 2 1.1 Problem statement ... 6 1.2 Thesis objective ... 7 1.3 Relevance of the thesis ... 8
1.4 Contribution ... 8
1.5 Outline of the thesis ... 9
1.6 THEORETICAL BACKGROUND- ROCKBURST AND ROCK JOINT CHAPTER 2 MECHANICAL BEHAVIOUR ... 12 Introduction ... 12 2.1 Rockburst definition ... 13 2.2 Rockburst types and mechanisms ... 15
2.3 2.3.1 Fault-slip burst ... 16
2.3.2 Strain-burst ... 18
2.3.2.1 Exfoliation and slabbing ... 19
2.3.2.2 Pillar burst ... 20
Rockburst origin ... 21
2.4 2.4.1 Brittle Fracturing ... 22
2.4.1.1 Crack initiation and geometry ... 22
2.4.1.2 Crack propagation ... 23
2.4.2 Brittle fracturing process ... 24
2.4.2.1 Pre-peak stage in uniaxial compression ... 24
2.4.2.2 Peak stage in uniaxial compression ... 25
2.4.2.3 Post-peak stage in uniaxial compression ... 26
Rockburst prediction methods: brittleness indices ... 29
2.5 Rock joint mechanical behaviour models ... 33
2.6 2.6.1 Patton’s model ... 34
2.6.2 Ladanyi-Archambault’s (LADAR) model ... 36
2.6.3 Barton et al.’s model ... 37
2.6.4 Saeb and Amadei’s model ... 40
2.6.5 The CSDS model ... 45
Rock joint roughness ... 49
2.7 2.7.1 Roughness ... 49
2.7.2 Roughness parameter ... 50
2.7.2.1 Statistical roughness parameter ... 50
2.7.2.2 Empirical roughness parameter ... 52
2.7.2.3 Fractal roughness parameter ... 52
Selection of a roughness parameter ... 53
2.8 Correlation between JRC and other roughness parameters ... 54
2.9 Roughness measurement techniques ... 56
2.10 Roughness scale dependency ... 58
2.11 Summary and conclusion ... 59 2.12
ARTICLE 1: MORPHOLOGICAL EVALUATION OF FRACTURES CHAPTER 3
CREATED BY DIFFERENT LOADING MODES INTRODUCING THE MODIFIED
SPLITTING TECHNIQUE ... 62
Introduction ... 63
3.1 Roughness parameters ... 65
3.2 3.2.1 Statistical roughness parameters ... 65
3.2.2 Empirical roughness parameter (JRC) ... 67
Fractures created in different modes ... 68
3.3 New 2D roughness profilometery (2DRP) ... 70
3.4 3.4.1 Joint surface replication ... 70
3.4.2 Photography, photo-analysis and digitizing ... 71
3.4.3 Verification of the results ... 72
Roughness variation based on fracturing modes ... 74
3.5 3.5.1 Effect of loading modes on the roughness variation ... 77
3.5.2 Effect of loading direction on the roughness variation ... 79
Fracture trajectory ... 82
3.6 Discussion ... 83
3.7 3.7.1 New 2D roughness profilometry method ... 83
3.7.2 Loading modes and roughness parameter ... 83
3.7.3 Effect of groove size on modified splitting results ... 85
3.7.4 Loading direction in the modified splitting tests ... 86
Conclusion ... 87
3.8 ARTICLE 2: THE SHAPE EFFECT ON THE MORPHOLOGY OF THE CHAPTER 4 FRACTURE SURFACE INDUCED BY THE BRAZILIAN TEST ... 92
Introduction ... 92 4.1
Methodology and experimental procedure ... 96
4.2 4.2.1 Specimen type and Size ... 97
4.2.2 Brazilian tests ... 97
4.2.3 Equipment ... 99
4.2.4 Roughness characterization ... 100
4.2.5 Joint roughness parametrization ... 100
Results ... 102
4.3 4.3.1 Fracturing patterns in terms of L/D ratio ... 102
4.3.2 Variation of the fracture surface morphology ... 103
4.3.2.1 Roughness profiles parallel to the loading axis ... 105
4.3.2.2 Roughness profiles perpendicular to the loading axis ... 107
Discussion ... 111
4.4 4.4.1 Stress distribution and roughness ... 111
4.4.2 Roughness scattering ... 113
4.4.3 Limitation ... 115
Conclusion ... 115
4.5 ARTICLE 3: EFFECT OF PRE-PEAK LOADING CONDITION ON POST-CHAPTER 5 PEAK BEHAVIOUR OF BRITTLE ROCKS ... 121
Introduction ... 121
5.1 Uniaxial compression test ... 124
5.2 5.2.1 Draft ISRM suggested method for the complete stress-strain curve: a review ... 124
5.2.2 Damage-controlled loading method ... 125
New damage-controlled cyclic loading method ... 125
5.3 Sample preparation and equipment ... 126
5.4 Experimental results ... 127 5.5
Discussion ... 130
5.6 5.6.1 Applied procedure and fracture patterns ... 130
5.6.2 Brittleness ... 132
5.6.3 Energy concept ... 135
5.6.4 Effect of loading rate and unload cycles on the results ... 136
5.6.5 Limitations ... 137
Conclusion ... 139
5.7 ARTICLE 4: POST-PEAK BEHAVIOUR OF HARD AND BRITTLE CHAPTER 6 ROCKS: ESTIMATION AND VERIFICATION USING THE CSDS MODEL FOR ROCK JOINTS 142 Introduction ... 142
6.1 The CSDS constitutive model for rock joints: a review ... 145
6.2 6.2.1 Shear stress-shear displacement ... 145
6.2.2 Normal -shear displacement (dilation) ... 147
Post-peak behaviour of brittle rocks: approach review ... 147
6.3 6.3.1 Stress-strain components in post-peak behaviour ... 148
6.3.2 Determination of the shear behaviour of rock joints based on triaxial compression tests 149 6.3.3 Prediction of post-peak behaviour ... 150
Experimental procedure ... 151
6.4 6.4.1 Triaxial compression tests ... 151
6.4.2 Uniaxial compression tests ... 154
6.4.3 Direct shear tests ... 156
Post-peak estimation using the new approach ... 159
6.5 6.5.1 Application to triaxial compression tests ... 159
6.5.2 Application to uniaxial compression tests ... 161
Estimation of the CSDS model properties using the shear test ... 162
6.6 Initial asperity angle ... 165
6.7 Discussion ... 169
6.8 6.8.1 Brittleness ... 169
6.8.2 CSDS model properties obtained from laboratory tests ... 170
6.8.2.1 Results of triaxial compression and direct tests ... 170
6.8.2.2 Triaxial and uniaxial compression tests results ... 175
6.8.3 Proposed CSDS model properties for estimating the uniaxial post-peak behaviour of hard rocks ... 178
Final remarks ... 180
6.9 Conclusion ... 181
6.10 SUMMARY AND GENERAL DISCUSSION ... 189
CHAPTER 7 Main results ... 189
7.1 Discussion ... 195
7.2 CONCLUSIONS AND RECOMMENDATIONS ... 199
CHAPTER 8 Original contributions and practical applications ... 201
8.1 Recommendations ... 203 8.2
LIST OF TABLES
Table 2.1. Wet classification results (Peng, 1986). ... 31
Table 2.2. BIM assessment (Aubertin et al., 1994a). ... 32
Table 2.3. Rockburst classification by Qiao index (1998). ... 32
Table 2.4. Classification of brittle fracturing by Altindag index B4 (2010). ... 33
Table 2.5: Relationships between JRC and Z2, Rp and θmax ∗ (C + 1)2D. ... 55
Table 2.6: Relationships between JRC and D. ... 55
Table 3.1: Statistical roughness parameters used in rock mechanics. ... 66
Table 3.2: Correlation between statistical (𝑍2and 𝑅𝑝 ) and empirical (𝐽𝑅𝐶) parameters. ... 67
Table 3.3: Summary of the total number of tests. ... 70
Table 3.4: Mechanical properties required for Phase2D models. ... 86
Table 4.1: Summary of total number of roughness profiles obtained with profilommeter. ... 101
Table 4.2:Correlation between JRC and Z2. ... 102
Table 4.3: Tensile stress values at the center and end surface of the Brazilian samples as function of L/D ratio (Yu etl., 2006; Von Dinh, 2011). ... 114
Table 5.1: Summary of sample number and rock mechanics tests. ... 128
Table 5.2: Classification of the brittleness indices for microgabbro and basalt. ... 133
Table 6.1: Summary of the triaxial compression tests and the mechanical properties of the samples. ... 153
Table 6.2: Summary of the uniaxial compression test results. ... 156
Table 6.3: Summary of shear tests and obtained mechanical properties. ... 158
Table 6.4: CSDS model properties obtained from triaxial compression tests on microgabbro and basalt. ... 159
Table 6.5: The CSDS model properties used for the prediction of the post-peak behaviour of the uniaxial compression tests. ... 162
Table 6.6: The CSDS model properties obtained from the result of direct shear tests on microgabbro and basalt. ... 164 Table 6.7: The average CSDS model properties based on curve fitting method on uniaxial,
triaxial, and direct shear test results. ... 170 Table 6.8: Source of the model properties for estimation of post-peak uniaxial compression
LIST OF FIGURES
Figure 2-1: Different types of fractures as a consequence of mining (McMahon, 1988). ... 17 Figure 2-2: A stiffness approach related to load-displacement curve: a) Violent failure due to
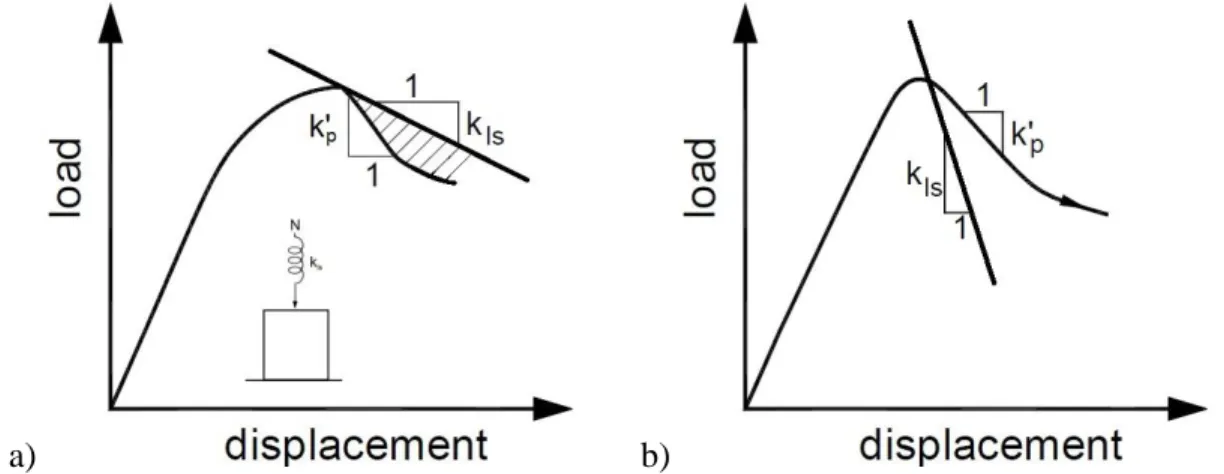
stored energy release; b) gradual failure (kls is loading system stiffness; k'p the rock
post-peak stiffness) (After Salamon, 1974). ... 18 Figure 2-3: The role of loading system stiffness in uniaxial compression test: a) energy
accumulation and violent failure; b) gradual failure (After Cook, 1965). ... 18 Figure 2-4: Slabbing of the face and sidewall of underground excavation (Muehlhaus, 1990). ... 19 Figure 2-5: Slabbing process during uniaxial compression with respect to influence of
confinement (Wawersik and Fairhurst. 1970). ... 20 Figure 2-6: Loading conditions and induced stresses on two dimensional model of a single crack:
a) Griffith model (Griffith, 1920); b) McClintock and Walsh model ( McClintock and Walsh, 1962). ... 23 Figure 2-7: Wing and secondary cracks emanated from a single flaw (After Bobet & Einstein,
1998; Park and Bobet, 2010). ... 24 Figure 2-8: The stress-strain curve resulted from uniaxial compression test of Lac de Bonnet
granite that shows the crack initiation until peak strength (After Martin and Chandler, 1994). ... 26 Figure 2-9: Stress-strain curves for two classes of rock behaviour during uniaxial compression
test (After Wawersik & Fairhurst, 1970). ... 27 Figure 2-10: Damaged-controlled loading method showing post-peak behaviour of class II (After
Martin and Chandler, 1994). ... 28 Figure 2-11: Wet calculation method (After Kidybinski, 1981). ... 30
Figure 2-12: Brittleness Index Modified (After Gill and Aubertin, 1988). ... 31 Figure 2-13: a) Patton’s shear strength bi-linear criterion (1966). b) Non-linear criterion
Figure 2-14: Dimensionless model for shear stress-displacement modeling (Barton et al., 1985).
... 39
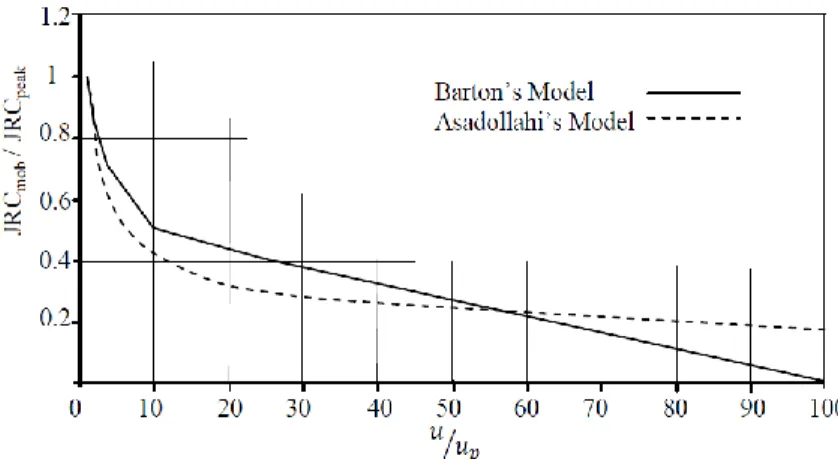
Figure 2-15: Comparison between Asadollahi’s and Barton’s model for post-peak shear strength (Asadollahi, 2009). ... 39
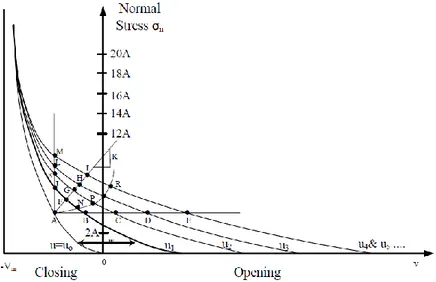
Figure 2-16: Joint response curves for normal stress between 0 and 20A (Saeb and Amadei, 1992). ... 41
Figure 2-17: Normal stress -normal displacement curves at different shear displacement levels (Saeb and Amadei, 1992). ... 42
Figure 2-18: Comparison between the CSDS model and the actual shear test results for rock joint replica made by cement under different constant normal stresses (After Simon, 1999). ... 47
Figure 2-19: First and second order of asperities (Modified after Patton 1966). ... 50
Figure 3-1: Modified Splitting Technique. ... 68
Figure 3-2: Fracture patterns obtained by different loading modes. ... 69
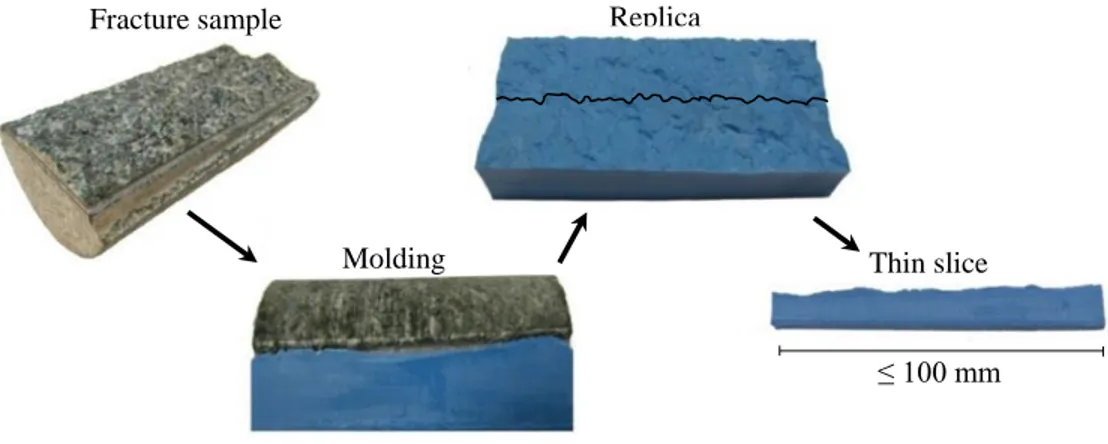
Figure 3-3: Schematic view of the procedure to obtain a thin slice of the replica representative of the roughness profile. ... 70
Figure 3-4: Replica photography and photo-processing. ... 72
Figure 3-5: ATOS II system (adapted from Tatone and Grasselli, 2009). ... 72
Figure 3-6: Comparison between 𝑍2 obtained by ATOS II and the new proposed technique (2DRP) for the fractures created in gabbro by: a) the modified splitting technique; and b) uniaxial compression test. ... 74
Figure 3-7: Roughness profiles selected in the middle part of the fracture surface. ... 74
Figure 3-8: Variation of the roughness parameters: a) Z2; b) Rp and c) Ai of the fractures created in gabbro specimens by different loading modes with sampling span of 0.3 to2.0 mm. ... 76
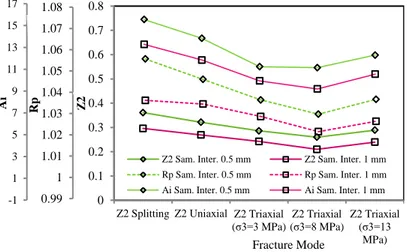
Figure 3-9: Variation of the roughness parameters in the sampling span of 0.5 and 1 mm with different loading modes (gabbro specimens). ... 76
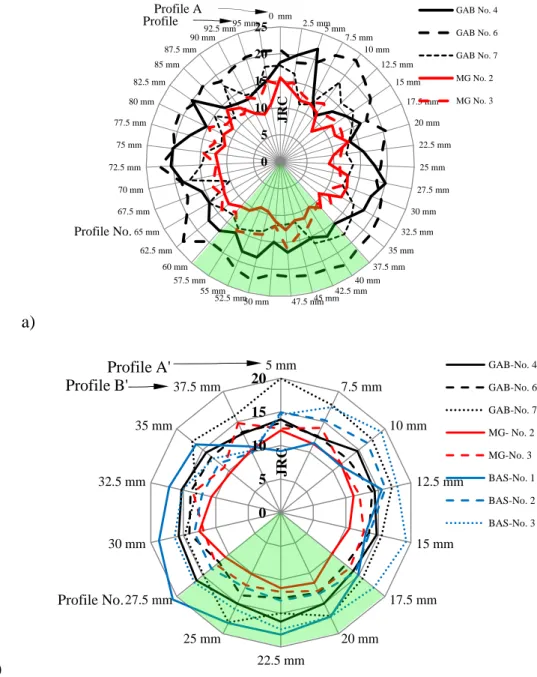
Figure 3-10: Variation of the JRC values with different loading modes for: a) gabbro (GAB); b) microgabbro (MG); c) basalt (BAS). ... 78
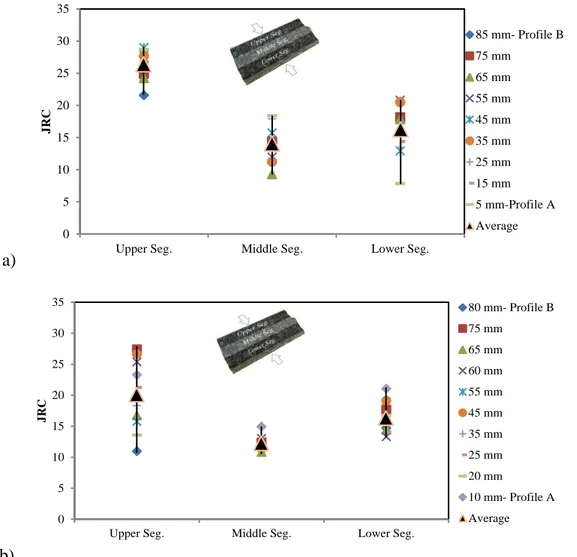
Figure 3-11: Schematic view of the roughness profiles perpendicular and parallel to the loading direction in the sample obtained from Modified Splitting Technique ... 79 Figure 3-12: The regional JRC distribution on the fracture surface created by the modified
splitting technique; a) sample A; b) sample B. ... 80 Figure 3-13: Variation of the roughness in terms of the profiles direction for: (a) Profiles parallel
to the loading axis –gabbro and microgabbro; (b) Profiles perpendicular to the loading axis-gabbro, microgabbro and basalt. ... 81 Figure 3-14: The fracture trajectory in the split specimen (gabbro). ... 84 Figure 3-15: Tensile stress distribution obtained by the Modified Splitting Method with three
different groove sizes (Phase2D). ... 86 Figure 4-1: Loading and displacement modes of fractures: (I) tensile opening; (II) in-plane shear;
(III) out-of-plane tearing (Modified from Brady and Brown 1985). ... 93 Figure 4-2: a) Roughness of the fracture obtained from different loading modes on Gabbro
samples (Khosravi et al. 2014); b) Cylindrical sample with notches and round bar on the top. ... 95 Figure 4-3: Schematic diagram of roughness profiles and three overlapped sections (after Feng et
al. 2014). ... 95 Figure 4-4:Variation of the JRC value with L/D ratio obtained from the parallel roughness
profiles in gabbro sample (Khosravi and Simon, 2015). ... 96 Figure 4-5: Testing machine Tinius Olsen 200 tons at École Polytechnique de Montréal. ... 98 Figure 4-6: Specimens with variety of L/D ratios split by the Brazilian test. ... 98 Figure 4-7: Variation of average ultimate loads and stresses at failure point with L/D ratio in
three rock types. ... 99 Figure 4-8: 3D laser profilommeter used for this study. ... 100 Figure 4-9: Roughness profiles parallel and perpendicular to the loading axis. ... 101 Figure 4-10: a) Fracture types observed in the split samples; b) Fracture pattern of the three rock
Figure 4-11: The size of wedge along the length of the specimens (gabbro and basalt). ... 105 Figure 4-12: Variation of the roughness in the profiles parallel to the loading direction with L/D
ratio. ... 106 Figure 4-13: Mid-length and mid-diameter profiles of a specimen. ... 107 Figure 4-14: Variation of the roughness parallel to the loading direction in the mid-length of the
samples with L/D ratio. ... 108 Figure 4-15: Variation of the roughness perpendicular to the loading axis with L/D ratio. ... 110 Figure 4-16: Schematic variation of the roughness perpendicular to the loading axis and with L/D
ratio. ... 111 Figure 4-17: Variation of the roughness perpendicular to the loading axis in mid-diameter of the
samples with L/D ratio. ... 112 Figure 4-18: Tensile stress distribution in the specimen with L/D=1.0 obtained by 3D FEM
analysis (adapted from Yu et al., 2006). ... 114 Figure 5-1: Two classes of post-peak behaviour in uniaxial compression (Adapted from
Wawersik and Fairhurst 1970). ... 123 Figure 5-2: An example of the procedure applied to obtain the complete force-displacement
curve. ... 126 Figure 5-3: MTS testing machine with an axial force capacity of 2670 kN used for this study at
University of Sherbrooke. ... 127 Figure 5-4: Complete stress-strain curve obtained by damage-controlled cyclic loading method. ... 128 Figure 5-5: Fracture pattern of basalt samples subjected to uniaxial compression test: a) unstable
and violent failure with the entire loss of strength; b) stable fracturing due to damage-controlled cyclic method; c) partial loss of strength in the post-peak phase followed by a total loss. ... 128 Figure 5-6: Fracture pattern of microgabbro samples subjected to uniaxial compression test: a)
damage-controlled cyclic method; c) partial loss of strength in the post-peak phase continuing with total loss. ... 129 Figure 5-7: An example of a successful complete stress-strain curve with a smooth radial
displacement. ... 130 Figure 5-8: Axial and radial deformation in pre- and post-peak stages of a microgabbro sample. ... 131 Figure 5-9: Schematic conception of the BIM (Adapted from Aubertin and Gill, 1988; Aubertin
et al., 1994). ... 133 Figure 5-10: Empirical correlation between BIM and |E/E'| including basalt and microgabbro. 134 Figure 5-11: Empirical correlation between BIM and |E/E'| for fine-grained rocks. ... 135 Figure 5-12: Effect of loading rate and loading cycles on stress-strain curve in hard rock; a)
Comparison between elastic energy obtained from a standard uniaxial test and the proposed damage-controlled cyclic loading test on a basalt specimen; b) Schematic stress-strain curve adapted from Hashiba et al. (2006). ... 137 Figure 5-13: Strain hardening of microgabbro due to the large number of cyclic loadings in the
pre-peak region. ... 138 Figure 6-1: Deformation behaviour of rock under compression. ... 148 Figure 6-2: Shear stress-strain components of the failure plane in a sample subjected to triaxial
compression test (adapted from Simon et al., 2003). ... 149 Figure 6-3: Triaxial compression test: a) 200 tons Tinius Olsen machine at Polytechnique
Montréal; b) sample and LVDTs. ... 152 Figure 6-4: Typical results after triaxial compression tests. ... 153 Figure 6-5: Complete stress-strain curves obtained from the triaxial compression tests on
microgabbro and basalt with σ3 = 15, 20 and 24 MPa. ... 154
Figure 6-6: Typical results after uniaxial compression tests. ... 155 Figure 6-7: Complete stress-strain curves obtained using the uniaxial compression test and strain
Figure 6-8: 300 tons MTS testing machine at University of Sherbrooke. ... 157 Figure 6-9: Results of direct shear tests and sheared joints on: a) microgabbro; and b) basalt. .. 158 Figure 6-10: Application of the proposed approach (Simon et al. 2003) to obtain shear stress-displacement curves for: (a) microgabbro, (b) basalt; and complete triaxial compression stress-strain curves for: (c) microgabbro, (d) basalt ... 161 Figure 6-11: Application of the proposed approach to predict the post-peak behaviour of
specimens subjected to the uniaxial compression test for: a) microgabbro; and b) basalt. .. 163 Figure 6-12: Comparison between the results of the CSDS model and direct shear tests (CNS): a)
Microgabbro specimens with 𝜎𝑛= 10, 14 and 17 MPa; and b) Basalt specimens with 𝜎𝑛= 3, 5 and 8 MPa. ... 165 Figure 6-13: Asperity angle of a rock joint: a) maximum asperity angle in terms of sampling
intervals; b) average asperity angle in shearing direction; c) the role of initial asperity angle on the joint sliding. ... 166 Figure 6-14: Variation of: maximum asperity angle (𝑖𝑚𝑎𝑥) with the sampling interval for (a)
microgabbro and (b) basalt; and variation of: average asperity angle (𝑖𝑎𝑣𝑒) for (c) microgabbro; and (d) basalt. ... 168 Figure 6-15: Relation between brittleness (BIM) and |E/E′| for the current study. ... 169 Figure 6-16: Contact area on the failure surface of microgabbro specimens in a) triaxial
compression test (𝜎3=20 MPa); and b) direct shear test (𝜎𝑛=17 MPa). ... 172 Figure 6-17: Three sections of roughness profiles on the fracture surface. ... 173 Figure 6-18: Sectional variation of the asperity angle: a) 𝑖𝑜 𝑎𝑣𝑒 and b) 𝑖𝑜 𝑚𝑎𝑥. ... 174 Figure 6-19: Estimation uniaxial post-peak curve using the CSDS model properties obtained from
triaxial tests; a)microgabbro; and b)basalt. ... 176 Figure 6-20: Contact area on the failure plane induced by a uniaxial compression test on basalt. ... 178 Figure 6-21: Experimental and model results of triaxial and uniaxial compression (microgabbro). ... 180
List of symbols and abbreviations
CSDS Complete Stress Displacement Surface
L/D Length-to-Diameter
2DRP 2D Roughness Profilometry BIM Brittleness Index Modified JRC Joint Roughness Coefficient 𝜏𝑝 Peak shear strength
𝜏𝑟 Residual shear strength
τ Shear stress on the failure plane
𝜎𝑛 Normal Stress
𝜎𝑇 Ultimate compressive strength
𝜎𝑛 Normal Stress
𝜎1 Major principal stress 𝜎3 Minor principal stress
∆𝜀𝑡 Axial strain component induced by the shear displacement (u) on the failure plane ∆𝜀𝑛 Axial strain component induced by the normal displacement (v) of the failure plane
∆𝜀𝑒 Axial strain component due to the rock matrix compaction 𝜀 Total axial strain
E Elastic modulus
E΄ Post-peak modulus
𝜙𝑜 Angle of friction of intact rock β Angle of failure plane
Vm rock joint closure
v normal displacement
u shear displacement
𝐵0 Ratio of residual to peak strength
as Shear area ratio
i Angle of asperity
𝑖0 Initial angle of asperity 𝜙𝑢 Angle of friction
a, b, c,d and e The CSDS model parameters (joint shear behaviour) β1, β2, β3 The CSDS model parameters (joint dilation behaviour)
𝑢𝑝 Peak shear displacement
𝑢𝑟 Residual shear displacement Sr Shear strength (Mohr-Coulomb)
S0 Cohesion
RMS Root mean square
Ai Average inclination angle of asperity
Z2 The RMS of the first derivative of the roughness profile
Rp Roughness profile index
D Fractal dimension
io max Maximum asperity angle
INTRUDUCTION
CHAPTER 1
Strainbursts occur in deep mines when the post-peak stiffness of failed rock is higher than the stiffness of surrounding layers. The accumulated energy is released suddenly with damage risk to whole mining stope or underground opening as well as workers and equipment. Rockburst can be easily triggered and/or accelerated by seismic waves induced by mining activities. The occurrence of rockbursts is associated with many factors such as geological structures of rock mass, depth, stress conditions, rock mass strength, excavation method, excavation size and rock blasting. The stress state increases as the depth increases, thus, the rock mass instabilities and other safety issues matter.
Many researches have been carried out to predict and prevent rockburst. In the last four decades considerable achievements have been made in rockburst phenomenon based on rock mechanics knowledge. The potential of bursting has been evaluated by measuring the brittleness of rock. Brittleness indices are based on strain energy accumulation and mechanical properties of rock in the loading phase. These indices can be used to estimate the risk of any violent instability.
Since rockburst phenomenon is related to mechanical behaviour of rock mass in the post-peak phase, the knowledge of the peak behaviour of rocks is required. Determination of the post-peak behaviour of brittle rocks in the laboratory is difficult and needs specific procedures to be achieved. Predominantly, the sharp and sudden strength drop is the result obtained at the peak strength. To identify the post-peak phase of an intact rock, modern stiff servo-controlled pressing machines are used. However, even modern technology does not guarantee to acquire the post-peak curve of brittle hard rocks.
Martin (1993) and Martin and Chandler (1994) proposed a damage controlled method to obtain the post-peak curve of rocks under compression experimentally. Fairhurst and Hudson (1999) suggested an alternative control technique by a testing procedure to obtain a complete stress-strain curve. Simon et al. (2003) proposed an indirect analytical approach based on the results of triaxial compression tests and a constitutive model for rock joint- the CSDS model (complete stress-displacement surface) - to estimate the post-peak behaviour of brittle rocks. In this proposed approach, the model properties (as rock mechanical parameters) were obtained from literature on medium rocks using curve-fitting method. This is nonetheless important to validate this approach based on laboratory tests on hard rocks. However, there are still many other factors
that should be considered to estimate the post-peak behaviour of intact rocks. One of these factors is the influence of the created fractures in uniaxial and triaxial loading modes.
The post-peak behaviour of intact rock is controlled by the fracture created at the peak strength. These fractures control the post-peak mechanical behaviour of the rock mass. The mechanical behaviour of the created fractures plays an important role in the severity of the process regarding the applied boundary condition in the post-peak. By characterizing the fracture surface created in triaxial and uniaxial loading modes, the roughness parameter and physical properties of the surface can be quantified. Subsequently, a closer insight into the post-peak behaviour of an intact rock subjected to the compression can be provided. The effect of different loading modes on the roughness also needs to be studied further.
Introduction
1.1
As technology allows for the exploitation of deeper orebodies with higher extraction ratios, mining engineers will most likely have to deal with instability problems. One of the most important, costly and harmful instability problems in Canadian deep mines is rockburst. Rockburst is a violent and suddenly brittle failure of rock in the surrounding rock mass due to the high stress state and huge amount of released energy. Since rockburst occurs suddenly and violently, it can cause injuries including death to workers, damage to equipment and even substantial disruption and economic loss of underground resources. Rockburst is a seismic event that can be easily triggered and/or accelerated by seismic waves induced by mining activities. Rockbursts are regularly classified in two main types: fault-slip burst and strain-burst (e.g. Johnston, 1988). Fault-slip burst occurs where an underground opening approaches a fault or a main geological discontinuity. In this case, normal load on the fault surface can decrease and the induced shear stress exceeds the shear strength and the failure can thus occur violently. Strain-burst takes place in a few manners such as exfoliation, buckling, pillar Strain-burst in which rock ejection and fall are dominant mechanisms. In particular cases, the combination of two types of rockbursts can be observed where a seismic event causes sufficiently high dynamic stress near an underground opening due to remote fault-slip (Kaiser et al., 1995).
In both types of rockbursts, the dominant phenomenon is movement of a discontinuity. The discontinuity controls the post-peak mechanical behaviour of intact rock. Many constitutive
models were established to estimate the mechanical behaviour of a joint subjected to a certain boundary condition, such as Patton (1966), Ladany-Archambault (1970), Barton et al. (1973; 1985), Saeb-Amadei (1992), and Simon (1999). These proposed models showed linear and non-linear behaviours of rock joints in stress-shear and normal strain curves for peak and/or post-peak regions. These researches, among several others, not only indicated the importance of discontinuity shear behaviour in rock engineering, but also demonstrated the influence of discontinuity surface characterization in complex problems related to the field of geotechnics, rock mechanics, mining and petroleum engineering.
Additionally, many studies have been conducted to characterize and correlate the joint surface roughness with the joint mechanical behaviour using 2D and 3D roughness profiling devices (e.g. Mayers, 1962; Barton and Choubey, 1977; El-Soudani, 1978; Tse and Cruden, 1979; Maerz et al., 1990; Yu and Vayssade 1991; Poon et al., 1992; Kulatilake et al., 1995; Belem et al., 2000; Grasselli, 2001; Yang et al., 2001; Kim et al., 2009; Tatone and Grasselli, 2010; and Jang et al., 2014). Fracture roughness has been quantitatively characterized based on several morphological approaches, including empirical (Barton and Choubey, 1977), statistical (Reeves, 1985; Maerz et al., 1990) and fractal approaches (Seidel and Haberfield, 1995; Zhou and Xie, 2003; Babadagli and Develi, 2003).
The effect of loading boundary conditions on morphology of induced fracture has been lately investigated. The effect of different loading modes on the roughness has been studied on rocklike materials (Amitrano and Schmittbuhl, 2002; Seredin et al., 2013). Tang and Kou (1998) investigated the effect of loading modes on a pre-flawed sample using numerical code RFPA2D (Rock Fracture Propagation Analysis). Bobet and Enstein (1998) studied the effect of the loading modes on the crack initiation and propagation by applying uniaxial tensile, uniaxial and triaxial compression tests on samples with a unique pattern of flaws. Feng et al. (2014) carried out an investigation on the fracture surface morphology originated from the Brazilian tests.
Since the strain-type rockburst can be investigated on intact rock using compressive loading, the shear mechanical behaviour of the created joint plays an important role in the severity of post-peak behaviour regarding to the applied boundary condition. To predict rockburst in mines, many attempts were made based on different approaches. Crack growth mechanisms, seismicity, strain energy accumulation, artificial neural networks, numerical modeling, Gaussian process, and
fuzzy modeling are the methods used to predict the rockburst (e.g., Dyskin and Germanovich, 1993; Beer and Mendecki, 1998; Haijun et al., 2003; Wiles, 2005; Su et al., 2009; Adoko et al., 2013 and Dong et al., 2013). These models are based on statistical and mathematical methods in which the mechanical properties of rock mass are not well considered. Aubertin and Gill (1988), Aubertin et al. (1994) and Wang and Park (2001) proposed the brittleness indices to evaluate severity of the brittleness. These indices are based on strain energy accumulation and mechanical properties of rock in loading phase.
Since rockburst phenomenon is related to the energy release in the post-peak phase of intact rock, the post-failure was studied by many researchers using laboratory tests (Cook, 1965; Rummel and Fairhurst, 1970; Wawersik and Fairhurst, 1970; Salamon, 1974; Gill et al., 1993; Aubertin and Simon, 1997; Ray et al., 1999; Xiao et al., 2010). Martin (1993) and Martin and Chandler (1994) proposed a damaged controlled procedure to obtain post-peak behaviour of granite, limestone and potash specimens. Fairhurst and Hudson (1999) suggested an alternative control technique by a testing procedure in which the axial and circumferential strain control along with a computed feedback control were used to obtain a complete stress-strain curve. Simon et al. (2003) also proposed an indirect analytical approach based on triaxial compression tests to predict the post-peak behaviour of hard rock. They used a constitutive model for rock joint- the CSDS model (complete stress-displacement surface) - to estimate the uniaxial post-peak behaviour using a complete stress-strain curve of triaxial tests. The model parameters were obtained from literature on medium strength rocks. This is nonetheless important to validate this approach based on laboratory tests on hard rocks.
The first purpose of this thesis is to validate the proposed indirect approach proposed by Simon et al. (2003) which can be used to predict the post-peak behaviour of rock and the rock burst proneness in underground excavations. This approach can be developed by focusing on the fracture surface quantification. The secondary motivation for this thesis is to perform uniaxial, triaxial and direct shear tests on hard rocks to obtain the CSDS model properties and also to characterize the roughness properties of the created joints considering the loading directions. This indirect approach gives a good estimation of the severity of brittle failure based on the post-peak stress-strain curve. Mining engineers can then use these results for optimized designing of mine layout (i.e. room and pillar mining method) based on the regional stress field (surrounding rock mass stiffness) and the optimum production rate. These results can also be applied in oil well
drilling engineering to predict the wellbore instability in deep wells. Also, the roughness characteristics of rock joints can be better estimated considering different loading conditions. For these purposes, a comprehensive laboratory tests (over 300 tests) were conducted on hard rock specimens, including gabbro, microgabbro and basalt. The created joint surfaces using modified splitting, Brazilian, uniaxial and triaxial compression tests were then characterized using 2D and 3D profilometry devices. The variation of the roughness parameters along the roughness profiles parallel and perpendicular to the loading axis was investigated for different rock types considering grains size. The influence of length-to–diameter ratio (L/D) on roughness parameters obtained from the created joints was also studied. The results specifically show that how the joint surface parameters are affected by different loading condition, grain size and the shape of specimens (L/D ratio). An applied loading procedure was proposed in order to obtain the post-peak curve of samples subjected to uniaxial and triaxial compression. The required properties for the proposed approach based on the CSDS model were also obtained using uniaxial, triaxial and direct shear tests on hard rocks. The results of this study imply that the proposed approach can be used to predict the post-peak behaviour of hard rock using the results of direct shear and triaxial compression tests along with the results of the surface characterization.
This thesis contains the following parts: Chapter 1 presents the research problem and objective with a glance of the methodology. Chapter 2 reviews the literature related to rockburst mechanisms, joint roughness and mechanical shear behaviour models of joints, which are interconnected in order to control the post-failure behaviour of rocks. In Chapter 3, the main focus is on the fracture surface characterization. A new surface roughness quantification (2DRP) method is proposed. The fracture surfaces created using modified splitting method, uniaxial, and triaxial compression tests are investigated using 2DRP method; the results of this study is compared with a 3D roughness profilometry device. This Chapter also addresses the joint roughness characterization based on different loading conditions for three rock types. Chapter 4 illustrates the roughness parameters of fracture surfaces created by tension using the Brazilian tests. The results show the influence of the shape effect and loading direction on the joint roughness parameters. The effect of L/D ratio on the roughness parameters is also presented for three rock types. Chapter 5 presents an experimental procedure to obtain the post-failure curve of brittle hard rocks through the damage-controlling method. Chapter 6 provides the results of the
post-peak stress-strain curves for uniaxial, triaxial and direct shear tests using the proposed approach and based on the CSDS model. These results indicate that how the proposed approach can be used for prediction of the post-peak behaviour of intact rock with respect to the fracture surfaces obtained by different loading modes. Chapters 3 to 6 are presented in the form of paper manuscripts that have been submitted to peer-reviewed journals; because of this paper format, there will be overlaps and repetitions between the chapters. The interpretation of results shown in these chapters is context dependent and, in some cases, may include engineering judgment of the author. Chapter 7 discusses these findings. The last chapter includes a conclusion and recommendations for the future works.
Problem statement
1.2
In practice, the post-peak behaviour of intact rock can be evaluated using direct and indirect approaches. Simon et al. (2003) proposed an indirect analytical approach based on the results of triaxial compression tests to predict the post-peak behaviour of hard rock. A constitutive model for rock joint- the CSDS model (complete stress-displacement surface) – was used to estimate the uniaxial post-peak behaviour of brittle rocks using a complete stress-strain curve of triaxial tests. The model properties were obtained from the test results of the literature on medium strength rocks. There is no validation on the application of this approach for hard rocks based on the laboratory tests.
This dissertation deals with the validation of this approach based on comprehensive laboratory tests on hard rocks to predict the post-peak stiffness of rock. The goal of this thesis is to estimate and adjust the model properties using triaxial, uniaxial, and direct shear tests on hard rocks. In addition, this approach can be developed by focusing on surface quantification of the fractures created by uniaxial, triaxial and direct shear tests. The created joint surfaces using indirect tension, modified splitting, shear, uniaxial and triaxial compression tests are characterized using 2D and 3D profilometry devices. The variation of the roughness parameters along the roughness profiles parallel and perpendicular to the loading axis is also investigated for different rock types considering the grain size and the length-to-diameter (L/D) ratio. The required properties for the proposed approach and the CSDS model are adjusted based on the roughness properties of the created joints considering the loading directions.
Thesis objective
1.3
The main objective of this thesis was to investigate and to validate the proposed approach (Simon et al. 2003) for estimation the post-peak behaviour of hard rock using the CSDS model with respect to the fracture surface characterization. These objectives can be divided into sub-sections:
1- Conduct a review of the past and current methods for joint surface characterization and the joint shear models as well as the prediction of the post-peak behaviour of rock.
2- Carry out comprehensive laboratory tests, including modified splitting, Brazilian, uniaxial and triaxial compression; and direct shear tests for different rock types considering the effect of grain size, the loading direction and the L/D ratio with the following capabilities:
Propose a new 2D roughness profilommetry method (2DRP) which is simple and appropriate for the joint with the length of maximum 100 mm.
Validate a new roughness profilommetry technique (2DRP) using 3D profilommetry devices.
Create fractures in different loading modes in terms of tension or shear by splitting, uniaxial and triaxial compression tests. This process is pursued with characterizing the fracture surfaces based on the different loading modes in terms of the roughness parameter on three hard rocks.
Evaluate the roughness anisotropy in tensile fractures considering the loading direction and length of the sample as well as the effect of grain size and stress distribution in the samples.
3- Perform the uniaxial compression tests on hard rocks by a new damage-controlled cyclic procedure in order to obtain the post-peak curve.
4- Evaluate and validate the proposed approach for prediction of the post-peak behaviour of intact hard rocks and develop the CSDS model parameters considering the induced fracture characterization and the results of laboratory tests.
Relevance of the thesis
1.4
Rockburst is one of the most important instability problems in hard rock mining, civil construction and oil well drilling caused by overstressing and violent release of strain energy stored in the system. This phenomenon usually occurs suddenly, which causes major damages and injuries in underground structures. Many studies have been carried out to predict rockburst occurrence, but few studies paid attention to the rock behaviour in the post-failure stage, which is very important in terms of optimized mining design and required support.
The prediction of post-peak behaviour of hard rock will improve the determination of the load-bearing capacity of the failed rock in order to optimized fulfill of the mining design projects. It may also be possible to select the pillar slenderness based on the regional stress field (boundary stiffness) and the optimum production rate.
This thesis provides a development of the proposed approach (Simon et al. 2003) for the optimum design of deep underground openings based on the post-peak behaviour of hard rocks. The post-peak curve of hard rocks is predicted considering the influence of various factors. The effect of fracture surface characterization in the post-peak curve estimation is also studied. The results of this study also show the effect of the loading direction and L/D ratio on the roughness parameters of the fracture surfaces.
Contribution
1.5
The current research will contribute to predict the behaviour of strain-type rockburst induced by overstressing condition. It may help to better achieve a deep insight of elastic energy release observed in the walls of underground openings. This research may lead to the following benefits:
Proposition of a new 2D profilommetry technique in order to characterize fracture surfaces.
Determination of the mechanical behaviour of rock joints created using different loading modes.
Development of a procedure to obtain uniaxial post-peak curve for very hard rock when using a non-stiff pressing machine.
Optimization of the pre-existing analytical approach in predicting the post-peak curve of intact rocks.
Significant cost saving by an improved prediction of the post-peak behaviour of hard rocks.
Significant risk reduction due to strain-burst phenomenon and improved pillar design and production rates following a better estimation of the post-peak behaviour of intact hard rocks.
The scientific contribution of this project is a thesis that includes the following four manuscripts submitted to peer reviewed journals:
1) Khosravi, A., Simon, R., Falaknaz, N. Morphological evaluation of fractures created by different loading modes focusing on the modified splitting technique. Canadian Geotechnical Journal. Submitted in June 2016.
2) Khosravi, A., Simon, R., Rivard, P. The shape effect on the morphology of fracture surface induced by the Brazilian test. Int. Jrnl. of Rock Mech. and Min. Sci. Submitted in February 2016.
3) Khosravi, A., Simon, R., Effect of the pre-peak loading condition on the post-peak behaviour of the brittle rocks. Int. Jrnl. Of Rock Mech. and Min. Sci. Submitted in June 2016.
4) Khosravi, A., Simon, R. Post-peak behaviour of hard and brittle rocks: Estimation and verification using the CSDS model for rock joints. International Journal of Geomechanics. Submitted in June 2016.
Four other conference papers were also published in the proceeding in the course of this doctoral work (Khosravi et al., 2014; Khosravi and Simon, 2014, 2015, 2016).
It is worth noting that the four manuscripts included in this thesis (Chapters 3 to 6) are based on those initially submitted to journals and may be corrected (as requested by the reviewers and editors) later. These corrections are not included here and the final papers may thus differ from the versions in the thesis.
Outline of the thesis
1.6
Chapter 1 contains the research approach, objectives and the relevance of the thesis. Chapter 2 presents a literature review of the main subjects such as: rockburst definitions, rockburst types
and mechanisms, joint shear behaviour, joint shear models and roughness characterization and parameters.
Chapter 3 introduces a new technique of roughness profilommetry, which has been verified using a 3D profilommetry apparatus (ATOS II). Fracture surface obtained by different loading modes including uniaxial, triaxial and modified splitting tests were characterized in terms of roughness parameters. Three rock types were considered for this investigation. The effect of loading direction on the roughness variation was also studied. The trajectory of the fracture created by the modified splitting was investigated microscopically.
Chapter 4 presents the main results of the fracture characterization created by the Brazilian tests on the samples with different length to diameter (L/D) ratio. The fracture patterns were studied in terms of the L/D ratio. The roughness profiles perpendicular and parallel to the loading direction were also obtained for different L/D ratio for three different rock types. The scale effect on the fracture roughness was also evaluated. Special attention has been also paid on the roughness anisotropy in terms of the loading direction.
Chapter 5 contains a procedure by which the post-peak curve of a hard brittle rock can be obtained by applying a damage-control approach. The results are presented in terms of stress-strain curve for the uniaxial compressive tests. The fracture patterns obtained using this method was studied in this chapter. The influence of the brittleness and energy release concept is addressed by looking at the fracturing pattern on the broken specimens. The results of this method were also validated using BIM (Brittleness Index Modified) and energy concept method. In addition, the brittleness indices were classified for different rock types.
Chapter 6 includes the results of uniaxial, triaxial compression and direct shear tests conducted to estimate the post-peak behaviour of hard rocks. The CSDS model properties were obtained for each test using the proposed approach. Then, the model properties were compared in different tests to obtain fitted model parameters. The uniaxial and triaxial tests were also conducted to characterize the fracture surfaces created in different loading modes. The model properties were then modified based on the fracture surface characterization and the results of the different rock tests. The post-peak stress-strain curve of hard rocks in uniaxial compression was further obtained based on the results of direct shear test, uniaxial and triaxial compression tests and the fracture surface characterization.
Chapter 7 includes a summary and general discussion on the results obtained in this investigation. Chapter 8 contains a conclusion and recommendations for future studies.
THEORETICAL BACKGROUND- ROCKBURST AND
CHAPTER 2
ROCK JOINT MECHANICAL BEHAVIOUR
Introduction
2.1
Underground mines are prone to various dangers. The most feared of these threats have always occurred unexpectedly with violence. Explosions or disturbance of unstable equilibrium, including rockbursts, coal bumps, and rock-fall are examples of these types of events (Salamon, 1993).
One of the most destructive problems associated with underground deep mines is rockburst. Many scholars consider rockburst as a seismic event. A seismic event can trigger rockburst phenomenon, in which, the rockburst emits seismic waves that can lead to other seismic activities. Depending on high or low seismic frequencies, the severity of the consequences can be low or high, respectively. The occurrence of rockbursts is associated with many factors such as the geological structures of rock mass, depth, the stress conditions, the rock mass strength, the excavation method, the excavation size and the rock blasting. As the stress state increases with depth, the rock mass instabilities and other safety issues matter. Rock burst has been reported since the 18th century. In the early 1900’s, rockburst was observed as “air blast” in Coeur d’Alene district and the first injury as fatality was reported in 1914 (Whyatt et al., 2002).
The first recorded rockburst in British coal mine was at Stafford in 1938 (Jiang et al., 2010). Kolar gold mine (India) is one of the earliest mines reached to great depth and encountered rockburst problem at moderate depth (500 m) at the end of 19th century (Morrison, 1942). According to mining history, rockbursts have occurred at all depths and mines with different rock types (Blake, 1972; Blake & Hedley, 2003). It should be mentioned that rockburst occurrence in shallow depth and surface mines (Vermont, U.S.A.) are scarce in comparison with deep hard rock mines. Normally, the seismic events would be observed in the high-stressed regions whether at depth or not. There are many active mines in Canada, in which, relatively notable rockbursts have occurred and led to injuries or loss of a part of ore deposit. For example, a rockburst phenomenon was reported in Director Fluorspar mine in Newfoundland at depth of 150 m (Blake and Hedley, 2003). This problem has been observed in other countries too (e.g. South Africa, Germany, Poland, Russia, Australia, Japan and china) and was studied by many scholars. In the last four
decades, many research strived to alleviate the problems comprehensively (Cook, 1963, 1966, 1978; Salamon, 1970, 1983, 1984, 1993; Petukhov, 1972; Heunis, 1980; Kidyinski, 1981; Blake, 1972 & 2003; Lippmann, 1990; Ortlepp, 1978, 1994, 2000, 2001; Vardoulakis, 1984; Ryder, 1986, 1988; Hedley, 1987; Singh, 1987, 1988, 1989; McMahon, 1988; Gill & Aubertin, 1993; Kaiser et al., 1995; Linkov, 1996; Wu et al., 1997; Frid, 1997, 2000, 2001; Tang, 2000; Wang et al., 2001, 2010; Whyatt, 2000, 2002; Chen et al., 2003; Lee et al., 2004; Mitri, 1993,2007; Jian et al., 2009). Many researches have been done to predict and prevent rock burst while the miners encountered the rockburst problems. In South Africa (Salamon, 1993) and in recent years in Canada (Kaiser et al., 1995), considerable achievements have been made in rockburst phenomenon based on rock mechanics knowledge.
Since rockburst is considered as a time-dependent phenomenon, the prevention methods can be categorized as before, during and after extraction. By considering the mine depth and stress state of the region, the burst-prone area can be determined. Mining layout, mining rate (sequence), ground support and mining method can be modified in the design phase to prevent rockburst. Kaiser et al. (1995) have carried out a comprehensive study about supporting methods in the burst-prone areas in Canadian mines. Different types of ground support used in Canadian mines have been discussed and analysed. De-stress blasting and water infusion are the methods performed during mining. Backfilling of the mined-out area with different methods is another rockburst prevention method, which is applied after extracting each stope.
Rockburst definition
2.2
When an underground opening is excavated, the stress state is changed. As a consequence, the potential energy of the whole system is also changed by mining out of the underground opening. Jaeger and Cook (1979) have shown that one half of the potential energy change can be stored as elastic strain energy and the rest must be released. This released energy can be in the form of rockbursts
Rockburst is a particular expression of underground excavation instability. It accompanies violent fracturing and explosive displacement of rock into the mine opening.
Cook (1963, 1966) addressed rock burst as the excess potential energy changes in rock that leads to brittle fracturing. Hoek and Brown (1980) described rockburst as a product of explosive brittle
fracturing in deep hard rock mines with respect to extreme state of the existing stresses. According to Kaiser et al. (1995, 1997), rockburst is a seismic event that concerns damages to mine opening directly with a sudden and violent manner. Rockburst occurs in all kinds of mining or civil underground openings. Vardoulakis (1984) introduced rockburst in coal mines as a surface instability. Linkov (1996) also allocated rockburst to a local pillar edge fracturing. As a result of rapid convergence and oscillation of the underground excavation wall, periphery slabbing parallel to the maximum principal stress direction and finally failure of the rock occur. Based on slabbing, rockburst can be accounted as a surface buckling phenomenon that can happen at a tiny time (Ortlepp, 1978; Bardet, 1989). These phenomena happen when one productive layer takes place between two layers with lower stiffness.
According to an energy point of view, the magnitude of energy changes as a result of mining activities. Some amount of the energy consume in the transient period to the new state and a part of that is stored in the rock mass in the adjacent of underground opening. In fact, rockburst is a part of the stored strain energy, which is released in rock mass suddenly and violently (Blake, 1972 and Salamon, 1983). This definition is the most common scientifically used one in the research centres such as U.S Bureau of Mines (U.S.B.M.).
Since the geological structures are influenced by pre-mining and mining activities, the strain energy produced by the structural displacements (micro or macro) causes the seismic events (Cook, 1983). Basically most seismic events have no negative side effects to miners and potential harm or damage to underground openings. Only a severe release of energy leads a big seismic event. According to Cook (1966), “all rockbursts are seismic events but not all seismic events become rockbursts”. The emitted seismic energy must have a sufficient magnitude to be able to fracture the different volume of rock and to lead a rockburst (McMahon, 1988). It is observed that the rockburst occurs when the seismicity builds up and follows by dramatic seismicity drop. The longer travel time between seismicity build-up and drop, causes the greater amount of energy release, which can increase the hazardous damage (rockburst).
Rockburst types and mechanisms
2.3
Bath (1984) concluded that the rockburst mechanism was associated with the mine geometry, stress pattern and fracture orientation in the region. A rockburst in the fractured zone occurs due to:
1. Collapse of fractured zone; 2. Weak and inadequate support; 3. Geological disturbances;
4. Other disturbances in the mining area (mining layout, mining method); and, 5. The disturbances originated from the surrounding solid rock.
Different research proposed distinctive classifications for rockburst types. Joughin and Jaeger (1983) addressed two types of rockburst, in which, the fractures or discontinuities are main sources, including where the fault or discontinuities move and where the fractures are exposed on the opening faces.
Brummer and Rorke (1990) categorized three types of rockbursts in South African gold mines, including crush rockburst, pillar foundation failure and shear slip rockburst. In the other researches, rockbursts are divided into two types; The first type (Type I) is directly related to an advancing mine face that is so-called strainbursts; The second type (Type II) is one involving induced movement along pre-existing fault planes that is called fault-slip rockburst (Johnstone, 1988; and Yi and Kaiser, 1993).
Type I is directly associated with the working face fracturing and is a function of excavation rate. In this case, the source of stress redistribution is located near the active working face. The opening geometry and the surrounding rock mass stiffness are the most important parameters involved in the fracturing process. Shear stress increases due to different stiffness of rock masses. Also, any increase in the stresses at immediate roof and floor of the working face can increase shear stress on the surrounding rock mass. In such a condition, mining may be followed by a dynamic event and the damages due to the amount of energy emitted in the brittle strata. This phenomenon can be seen in all types of underground openings with different mining methods. Type II occurs less often than type I. In this case, the rockburst occurs when the pre-existing geological structure (mainly faults) is affected by the stress field. As a consequence, a brittle
fracturing zone in the working face and roof is formed. The condition of critical burst can be achieved by studying the geological and deformational properties of rock mass. It is worth noting that pillar-bursts often occur with a combination of the two mechanisms.
By comparing two types, type I involves the higher rate of released energy and the larger affected area of rock masses due to the fracturing process. Type II is triggered by mining activities close to the pre-existing major discontinuities. The amount of released energy at a time unit is higher in type I than type II while the affected areas in type II are extensive.
2.3.1 Fault-slip burst
As mentioned before, rockburst occurs due to a rapid energy release from rock mass. In the fault-slip bursts, the energy releases by fault-slip along the geological discontinuities such as faults, dykes, joints and bedding plane, when such discontinuities exist in the vicinity of underground opening. These discontinuities can either be persistent or interrupted by rock bridging, opened, closed or filled. All kind of discontinuities would have shear movement when the condition is satisfied. Such events are controlled by the shear stresses and cohesion along the plane. The stress changes may increase the shear stress or reduce the applied normal stress on a discontinuity. It also changes the coefficient of the internal friction (which drops slightly after slip is initiated), cohesion (which affects the shear strength and shear stress level) and the dilation angle. Therefore, it can provoke a violent slip.
Joughin and Jaeger (1983) classified all fractures in an underground gold mine (South Africa) into three types. The strikes of these fractures were almost parallel to the stope faces as shown in Figure 2-1. These three types are expressed as follows:
Fracture type 1: These fractures are inclined created in the relatively high distance ahead from the stope face with no shear displacements. When the stope span is increased, energy release rate grows up and the fractures form with inclination of 80-100o. Actually, these kinds of fractures represent the maximum principal stress direction.
Fracture type 2: These types of fractures are accompanied with displacement with an aperture of few millimetres and an inclination of 60-75o. These fractures form an en-echelon fracture in the vicinity of a fault.
Fracture type 3: These types of fractures are low inclined (20-40o). They are very close to the stope face with no shear displacement. They are created as a result of stress changes in the opening periphery. All three types of fractures may tend to move inside the mine space violently as a rockburst.
Figure 2-1: Different types of fractures as a consequence of mining (McMahon, 1988).
The slip behaviour of the discontinuity depends on three factors: normal stress on the slip surface, surface roughness and stiffness and deformation modulus of surrounding rock mass. The normal stress has a dominant effect on the slip behaviour. When the normal stress decreases beyond a critical stress level (as an unloading process-increase in differential stress), the other type of fault-slip burst (stick-fault-slip) occurs in combination with the existing shear stress (Zou et al., 1989). The surface roughness along discontinuities influences the slip behaviour. Energy gradually builds up during the stick period and releases suddenly at the time of slip. Salamon (1974) developed a stiffness approach to fault-slip rockbursts. Figure 2-2 shows the load-deformation obtained using the direct shear tests on the samples with a planar discontinuity.
When the post-failure stiffness of rock (𝑘𝑝,) exceeds the stiffness of testing machine (loading system-𝑘𝑙𝑠), the stored energy is released and the violent failure occurs (Fig. 2-2a). If the stiffness
equilibrium is satisfied (rock sample stiffness is less than loading system stiffness), there is no dynamic phenomenon and the failure will be occurred smoothly and gradually (Fig. 2-2b).