POLYTECHNIQUE MONTRÉAL
affiliée à l’Université de MontréalSpatially distributed interferometric receiver for 5G wireless communications
and sensing applications
BILEL MNASRI
Département de génie électrique
Thèse présentée en vue de l’obtention du diplôme de Philosophiæ Doctor Génie électrique
Août 2019
POLYTECHNIQUE MONTRÉAL
affiliée à l’Université de MontréalCette thèse intitulée :
Spatially distributed interferometric receiver for 5G wireless communications
and sensing applications
présentée par Bilel MNASRI
en vue de l’obtention du diplôme de Philosophiæ Doctor a été dûment acceptée par le jury d’examen constitué de :
Mohammad S. SHARAWI, président Ke WU, membre et directeur de recherche
Serioja Ovidiu TATU, membre et codirecteur de recherche Cevdet AKYEL, membre
DEDICATION
ACKNOWLEDGEMENTS
First and foremost, I would like to sincerely thank Professor Ke Wu for being my supervisor throughout my doctoral studies. I am very grateful for his excellent guidance, his encouragement and patience during this journey. I particularly appreciate his devotion to research, his ability to combine theoretical aspects with engineering design, and his vast knowledge. Working with Professor Ke Wu has been an enjoyable and invaluable learning experience, which has inspired me to face challenges, question thoughts, and express ideas. My deepest thanks should also go to my Ph.D. co-supervisor, Professor Serioja Tatu for his advices and suggestions during the course of my studies, which have significantly contributed to the improvement my work. I would also thank Professor Tarek Djerafi for training and teaching me the art of microwave engineering. I also extend my gratitude to all jury members who have accepted to take time in order to evaluate this thesis. Their insightful comments have significantly contributed to improving this thesis presentation. In addition, I would like to thank various members of the technical staff of Huawei Technologies Canada for technical discussions and collaboration we had during the years. I am deeply indebted to my colleagues and friends. Their friendships have made my journey truly enjoyable.
I would like to thank Poly-Grames research center staff for their assistance and help over the years. My sincere thanks also go to Nathalie Lévesque, Louise Clément and Rachel Lortie for their friendship and administrative assistance during my studies at Polytechnique Montréal. Finally, I would like to thank my family for all their immense love, presence and support. Nothing could have been possible without the long sacrifice of my parents over the years. This thesis is dedicated to them.
RÉSUMÉ
Les systèmes de télécommunications sans fils ont connu une révolution et un succès sans précédent dans l’histoire humaine, et ce depuis l’introduction de la première génération des réseaux mobiles au début des années 1980. Alors que ce premier standard de communication était essentiellement basé sur des méthodes de modulation analogique du signal, ce qui ne permettait que la transmission de la voix, les générations des systèmes de télécommunications qui ont succédé depuis le deuxième standard mondial GSM, se sont basées sur la transmission numérique qui représente une plateforme universelle pour le traitement des données de toute sorte (voix, donnés texte, vidéos haute définition, etc, ). En effet, le traitement numérique du signal qui a débuté avec les premiers travaux sur la théorie de l’information, aux laboratoires Bell aux États-Unis vers la fin des années quarante du siècle passé, constitue le noyau dur de tous les standards de communication, y-compris la cinquième génération des réseaux 5G, dont la date d’entrée au marché mondial est prévue vers le début de l’année prochaine 2020.
En effet, les réseaux de communications sans fils actuels, avec au sommet de la pyramide le standard 4G-LTE, ne peuvent pas répondre aux attentes des utilisateurs et des entreprises en termes de débit de transmission de données qui ne cesse d’augmenter d’une façon exponentielle, et pouvant atteindre les 40 Exabytes par mois vers 2020. De plus, la naissance du concept de l’internet des objets (IoT) qui consiste en l’interconnexion d’un très grand nombre de mini-capteurs sans fils qui vont gérer des milliers, voire des millions d’activités des toutes sortes, tels que l’aide à la conduite des voitures dans les routes, le contrôle des températures et des feux dans les régions forestières, la transmission des données médicales des patients en temps réel vers les centres hospitaliers, etc.
Dans le but de répondre aux besoins actuels et futurs, la venue de la cinquième génération des réseaux des communications 5G est devenue urgente plus que jamais. En effet, ce nouveau standard ne sera pas une amélioration incrémentale de la 4G-LTE, mais sera plutôt toute une nouvelle plateforme intelligente offrant des débits de données allant jusqu'à plusieurs gigabits par seconde, avec un temps de latence ne dépassant pas 1 milliseconde dans le but d’assurer une qualité de service sans égal.
Pour réaliser toutes ces promesses, les éléments de la couche physique doivent être revisités. En particulier les récepteurs radiofréquences (RF) couramment utilisés dans le contexte des communications sans fils, tels que les architectures homodynes, hétérodynes et superhétérodynes ont des limitations bien qu’ils sont dotés d’un nombre d’excellentes caractéristiques (une plage dynamique large pouvant atteindre 100 dB, flexibilité de conception en basse fréquences, etc-). Ces limitations incluent leur consommation de puissance énorme, qui est due essentiellement à l’utilisation de plusieurs étages de mélange et amplification des signaux faibles pour faire descendre le spectre du signal reçu en bande de base, ce qui devient très couteux, surtout en ondes millimétriques. De plus, les architectures hétérodynes et superhétérodynes souffrent également d’une bande passante réduite qui est difficilement adaptée pour l’opération sur des portions larges du spectre électromagnétique, comme c’est le cas des ondes millimétriques. Par conséquent, de nouvelles architectures de conception des circuits RF doivent être étudiées et validées pour résoudre les problèmes mentionnés et les proposer comme des alternatives aux récepteurs conventionnels. Dans ce contexte, cette thèse présente l’étude de nouvelles techniques interférométriques pour la réalisation de nouveaux récepteurs multi-entrées à démodulation directe et des systèmes de détection d’angle d’arrivée.
Tout d’abord, une architecture est présentée dans le but d’augmenter la plage dynamique des récepteurs RF basés sur les interféromètres six-ports. En effet, un récepteur six-port conventionnel souffre d’une plage dynamique limitée par la largeur de la zone linéaire des détecteurs de puissance utilisés à ses sorties, ce qui limite la taille des modulations que les six-ports peuvent traiter. La nouvelle architecture utilise deux jonctions six-port en parallèle, dont chacune est responsable de traiter une partie d’une large constellation dans le but de maximiser le débit de données offert ainsi que la plage dynamique du récepteur. Ensuite, un interféromètre spatial pour la détection de l’angle d’arrivée (AoA) d’un signal RF, en utilisant seulement trois coupleurs hybrides est présenté tout en analysant le phénomène d’ambigüité lié à la périodicité du AoA mesuré. Le volet suivant de la thèse est consacré pour l’étude théorique et expérimentale d’une nouvelle architecture d’un récepteur RF multi-entrées qui s’inspire de la technologie six-port et se base sur l’interférométrie spatiale dans le but de créer des corrélations qui vont être utilisées pour extraire le signal en bande de base transmis, tout en réduisant à moitié la perte de puissance du signal RF par rapport au récepteur six-port classique.
Dans le but d’augmenter le débit de données transmis, un détecteur de puissance logarithmique ayant un temps de montée de l’ordre de 17 nanosecondes est conçu et fabriqué dans le but de l’utiliser pour la démodulation haut débit avec des vitesses allant jusqu'à 120 Mb/s dans le cas d’une modulation 64-QAM, avec une qualité de réception mesurée par la métrique EVM (Error Vector Magnitude) comparable à celle obtenue par les récepteurs six-port conventionnels. Finalement, une méthode pour la détection du AoA d’un signal RF est proposée en liaison avec le récepteur distribué multi-entrées, tout en se basant sur la transmission de symboles pilotes connues par l’émetteur et le récepteur. A la réception de ces symboles, il est possible de déterminer la différence de phase entre les signaux à l’entrée des antennes et déduire l’angle d’arrivée du signal reçu, tout en suivant un formalisme mathématique expliquant le principe d’opération ainsi que l’étude d’ambigüité concernant la détection du AoA.
ABSTRACT
Wireless communication systems are one of the most famous success stories in the field of engineering in modern era. In fact, the birth of the first generation of mobile communications goes back to the early 1980’s. This first standard was based on analog modulation with the aim of transmitting only voice signals. And with the progress made in signal processing techniques and the large-scale productions of digital integrated circuits, the second generations of wireless communications was introduced in the nineties of the last century. Since then, a new standard for wireless mobile systems has been introduced every ten years or so, with ever increasing data rates, lower latency and better quality of service, thanks to the adoption of sophisticated modulation schemes and robust error correcting codes, in conjunction with improved hardware capabilities over the years. The magic progress in wireless technologies is strongly related to the magnificent research work pioneered by Claude Shannon on information theory in 1948 at Bell-labs, in combination with continuous research efforts conducted by millions of brilliant minds worldwide.
However, the current wireless generation of wireless systems 4G-LTE is unable to follow the explosion of wireless traffic, which is trigged by the exponential demand for higher data rates, which would create monthly traffic of about 40 Exabytes by 2020. Moreover, the birth of Internet of Things (IoT) concept is a driving force towards the emergence of a huge platform of billions of interconnected devices and sensors, used to control and monitor an ever-increasing number of applications (forests fire detection, intelligent cars, real-time health monitoring for sick and old people , etc.). As a matter of fact, the upcoming of the fifth generation (5G) of wireless mobile networks has become a very urgent necessity in order to meet the widely-discussed system requirements in terms of capacity, latency and quality of service.
Consequently, elements of the physical layer must be redrawn and reorganized in order to avoid the prohibited cost of network deployment and power consumption of billions of interconnected devices. In this thesis, we focus on the theoretical study and experimental validation of novel interferometric techniques to be adopted in the design of low-power direct conversion receivers,
which are capable of performing joint demodulation and angle of arrival (AoA) detection of RF signals.
This research topic is motivated by developing an effective approach to mitigating the limitations of conventional heterodyne and super heterodyne radio frequency (RF) receivers, in terms of power consumption along all the stages of mixing and amplification to down convert received modulated signals into baseband. In addition, these receivers are less suitable for operation at 5G millimeter waves because of their design complexity and manufacturing cost, although they present high dynamic range around 100 dB and beyond.
Thus, new alternative architectures for RF receivers must be studied and developed, considering overcoming the limitations of conventional architectures, which have been used for many decades. Within this context, this thesis presents a class of interferometric architectures for direct demodulation and angle of arrival detection for 5G applications and beyond.
First, a dual six-port receiver (SPR) is proposed to overcome the limited dynamic range of conventional six-port receivers and also to process high order modulations. In fact, the dynamic range of six-port receivers is fundamentally limited by the square law-region of power detectors used to detect the envelope of RF signals at their input, which is not linear, in practice, over a large power range. Thus, the proposed architecture makes use of two parallel six-port circuits to down-convert high order modulations and double the dynamic range of the whole receiver, while requiring 3 dB higher local oscillator (LO) power. Another multiport interferometer system for AoA detection is also proposed, along with a theoretical analysis of angular resolution and ambiguity-free detection range.
The main contribution of thesis consists in the theoretical study and experimental validation of a novel spatially distributed multi-input interferometer direct conversion receiver. The proposed architecture inherits the same advantages of conventional six-port receivers, such as design simplicity, low-power consumption, low-cost and easy scaling at millimeter-wave frequencies, while reducing the natural loss of six-port circuits by almost 50 %. This receiver is based on the use of a set of equally spaced antennas at the receiver, and exploits the phase correlation between wave fronts at antenna inputs, in order to create specific and precise correlations needed to extract the in-phase and quadrature components of RF modulated signals. The proof of concept
demonstration of the multi-input interferometer receiver shows excellent measurement results, which agree very well with theoretical foundations and simulations.
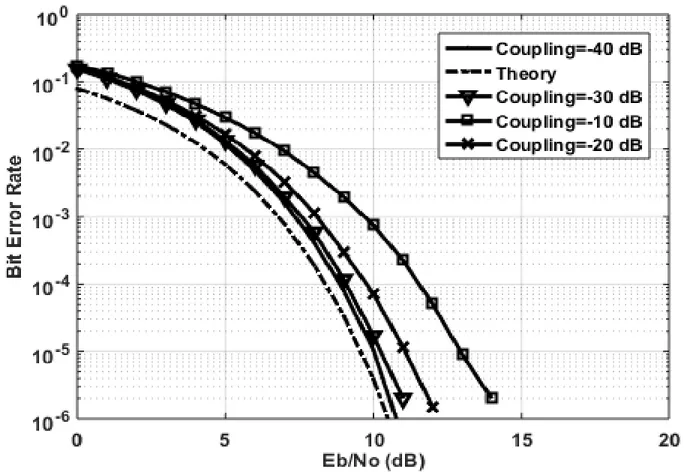
In order to provide experimental results at higher data rates, a power detector is designed and manufactured using the commercial Analog Devices AD8318 integrated circuit (IC), which exhibits a measured rise time of about 17 nanoseconds. This power detector enables the detection of modulated signals with bandwidth of up to 20 MHz, which makes possible the recovery of high order modulations such as 64-QAM at the speed of 120 Mb/s. Error vector magnitude (EVM) is adopted throughout the thesis as a metric to measure the quality of recovered baseband signals and compare it with state-of-the-art results reported in research literature, and all measurements show very promising results as the measured EVM does not exceed 10 % for all modulation schemes, which validate the feasibility of adopting the proposed interferometer receiver for future wireless systems. Moreover, the quality of received signal could be further improved through well-known calibration and linearization techniques. It is worth mentioning that the proposed receiver architecture offers 50 % less internal loss than conventional six-port receivers, while requiring three more antennas to operate in point-to-point communication scenarios. Although this represents more complexity and constraints in terms of coupling between adjacent antennas, which should be about -30 dB, the proposed multi-input architecture provides 3 dB more dynamic range than classic SPR and could be used in the design of multi-functional receivers.
Finally, a new method for detecting the angle of arrival of RF modulated signals using the proposed multi-input interferometric architecture is presented, which is based on sending a training sequence of symbols known at both the transmitter and receiver, and then extracts the phase difference between wave fronts received at the input of antennas using the recovered baseband signals following a mathematical modeling covering the principle of operation, as well as the study of the ambiguity-free detection range. The proposed method provides wider ambiguity-free intervals (up to 180) compared to conventional six-port based AoA detection systems.
TABLE OF CONTENTS
DEDICATION ... III ACKNOWLEDGEMENTS ... IV RÉSUMÉ ... V ABSTRACT ... VIII TABLE OF CONTENTS ... XI LIST OF TABLES ... XV LIST OF FIGURES ... XVI LIST OF SYMBOLS AND ABBREVIATIONS... XX LIST OF APPENDICES ... XXIICHAPTER 1 INTRODUCTION ... 1
1.1 Motivation ... 1
1.2 Overview of 5G wireless standard ... 2
1.2.1 Massive MIMO ... 2
1.2.2 5G ultra-dense network ... 3
1.2.3 Power consumption and energy efficiency in 5G networks ... 5
1.3 Overview of RF receiver architectures ... 5
1.3.1 Super-heterodyne receiver ... 5
1.3.2 Homodyne zero-IF receiver ... 6
1.3.3 Six-port receiver ... 8
1.4 Major contributions ... 10
CHAPTER 2 STATE OF THE ART OF DIGITAL COMMUNICATIONS ... 13
2.1 History of wireless communications going digital ... 13
2.2 Basics of digital modulation ... 14
2.2.1 Amplitude shift keying ... 15
2.2.2 Frequency shift keying ... 16
2.2.3 Phase shift keying ... 16
2.2.4 Quadrature amplitude modulation ... 17
2.3 Quadrature demodulation ... 18
2.4 Quantification of the quality of transmission ... 19
2.4.1 Error vector magnitude ... 19
2.4.2 Bit error rate ... 21
2.5 Conclusion ... 24
CHAPTER 3 DYNAMIC RANGE IMPROVEMENT OF SIX-PORT RECEIVER ... 25
3.1 Operation principle of the six-port receiver ... 25
3.2 Dynamic range of six-port receivers ... 29
3.3 Improvement of six-port receivers dynamic range ... 31
3.3.1 Dual six-port receiver architecture ... 32
3.3.2 Experimental results ... 33
3.4 Conclusion ... 37
CHAPTER 4 INTERFEROMETER BASED ANGLE OF ARRIVAL DETECTION SYSTEM……….38
4.1 Importance of AoA detection ... 38
4.2 Phase measurement principle ... 39
4.4 Conclusion ... 44
CHAPTER 5 SPATIALLY DISTRTIBUTED MULTI-INPUT INTERFEROMETER RECEIVER ARCHITECTURE: ANAYLSIS AND SIMULATIONS ... 45
5.1 Overview of conventional receivers’ architectures and limitations ... 45
5.2 Spatially distributed multi-input interferometer receiver ... 49
5.2.1 Receiver architecture ... 49
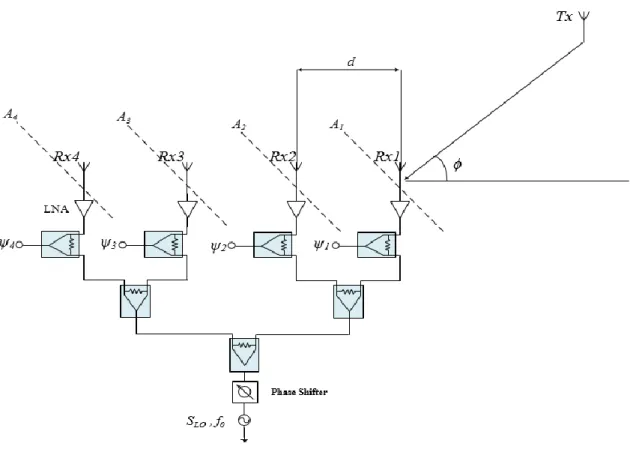
5.2.2 Choice of the inter-element distance ... 53
5.3 Performance assessment as a function of coupling and carrier frequency offset ... 55
5.3.1 The effect of coupling between antenna elements on the performance of the proposed receiver ... 55
5.3.2 Effect of carrier frequency offset ... 57
5.4 System simulations ... 59
5.4.1 Simulation of the proposed receiver demodulation capability ... 59
5.4.2 Simulation of bit error rate for QPSK modulation as a function of angle of arrival .. 62
5.5 Conclusion ... 65
CHAPTER 6 SPATIALLY DISTRTIBUTED MULTI-INPUT INTERFEROMETER RECEIVER ARCHITECTURE: PROTOTYPE AND MEASUREMENT RESULTS ... 66
6.1 Components design and fabrication ... 66
6.2 Test-bench overview and measurement results ... 71
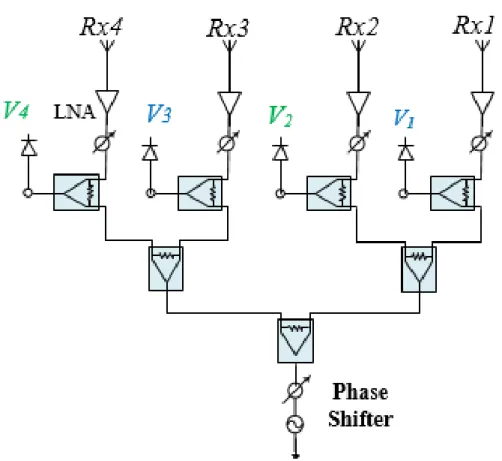
6.3 Alternative architecture of the proposed receiver ... 73
6.4 Error Vector Magnitude measurement results ... 76
6.5 Hardware limitation: Effect of power detector’s rise time ... 77
6.6 Conclusion ... 78
CHAPTER 7 PERFORMANCE ASSESSMENT OF THE MULTI-INPUT RECEIVER ARCHITECTURE ... 79
7.1 Demodulation performance for different values of the received power ... 79
7.2 Design of fast power detectors ... 85
7.3 Characterization of AD8318 power detector ... 88
7.4 Demodulation results using AD8318 power detector ... 91
7.4.1 Experimental test bench ... 91
7.4.2 Data recovery and demodulation at 5 GHz ... 94
7.5 Conclusion ... 95
CHAPTER 8 JOINT DEMODULATION AND ANGLE OF ARRIVAL DETECTION ... 97
8.1 Demodulation at unknown angle of arrival ... 97
8.2 Ambiguity analysis for angle of arrival ... 102
8.3 Angle of arrival detection using training symbols ... 104
8.4 Conclusion ... 108
CHAPTER 9 CONCLUSION AND RECOMMANDATIONS ... 110
9.1 Summary ... 110
9.2 Recommendations for future works ... 112
REFERENCES ... 114
APPENDICES ... 123
LIST OF TABLES
Table 1.1 Comparison of RF receiver architectures ... 9
Table 2.1 Symbol and bit error probabilities for coherent modulation in AWGN channel ... 22
Table 3.1 Wave expressions at the output of the six-port junction ... 27
Table 3.2 EVM improvement through the use of linearization, bias-control and the proposed dual six-port receiver ... 36
Table 4.1 Ambiguity-free range as a function of the inter-element distance d ... 43
Table 5.1 Simulation results for the required SNR to get BER of 10-6 ... 64
Table 6.1 Summary of EVM measurement results and comparison with the state of the art ... 76
Table 6.2 Maximum ratings for the mini-circuit ZX47-55-S+ power detector ... 77
Table 7.1 Summary of the system parameter values ... 82
Table 7.2 EVM results for 8-PSK as a function of the received power ... 84
Table 7.3 Principal features of Analog Devices AD 8318 logarithmic power detector ... 86
LIST OF FIGURES
Figure 1.1 Massive MIMO: spatial multiplexing pushed to a pleasant extreme [28] ... 3
Figure 1.2 5G network densification ... 4
Figure 1.3 Super-heterodyne receiver block diagram ... 6
Figure 1.4 Homodyne receiver block diagram ... 7
Figure 1.5 Six-port receiver architecture ... 8
Figure 2.1 Schematic of bandpass modulator ... 14
Figure 2.2 (a) Waveform and (b) constellation diagram of OOK signal ... 15
Figure 2.3 (a) Waveform and (b) constellation diagram of BFSK signal ... 16
Figure 2.4 (a) Waveform and (b) constellation diagram of BPSK signal ... 17
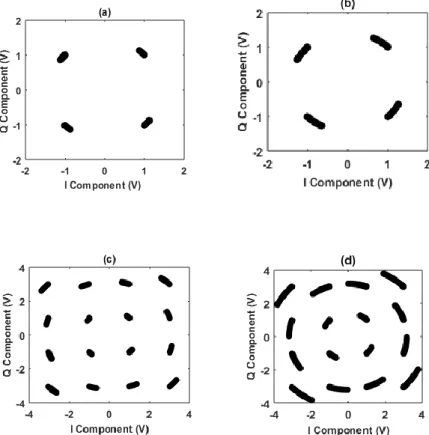
Figure 2.5 Constellation diagram of (a) 4-QAM (QPSK) signal and (b) 16-QAM signal ... 18
Figure 2.6 Block diagram of an ideal quadrature demodulator ... 18
Figure 2.7 Constellation diagram and error vector ... 20
Figure 2.8 Bit-error rate simulation results for BPSK, QPSK, 8-PSK and 16-PSK, over AWGN channel. ... 22
Figure 2.9 Bit-error rate simulation results for QAM-4, QAM-64 and QAM-256, over Rayleigh channel. ... 23
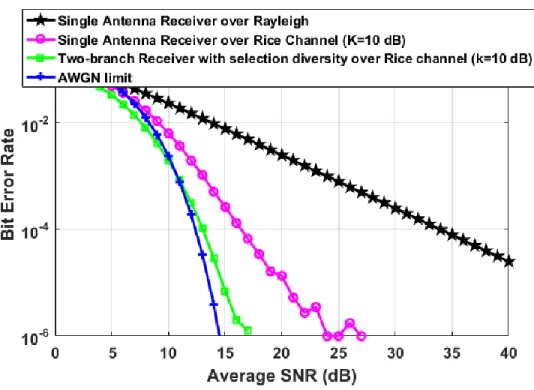
Figure 2.10 Bit error rate simulation results of QAM-16 with selection diversity over Rice channel (K=10 dB) ... 23
Figure 3.1 RF Front-End for a conventional six-port receiver ... 26
Figure 3.2 Square-law region for a typical diode detector ... 30
Figure 3.3 Schematic description of the proposed architecture ... 33
Figure 3.5 Simulated S-parameters magnitude with port 6 as input ... 34
Figure 3.6 Measured S-parameters magnitude with port 6 as input ... 35
Figure 3.7 Measured S-parameters phase with port 6 as input ... 35
Figure 3.8 (a) received constellation using one single six-port circuit, (b) received constellation using the proposed dual six-port architecture ... 37
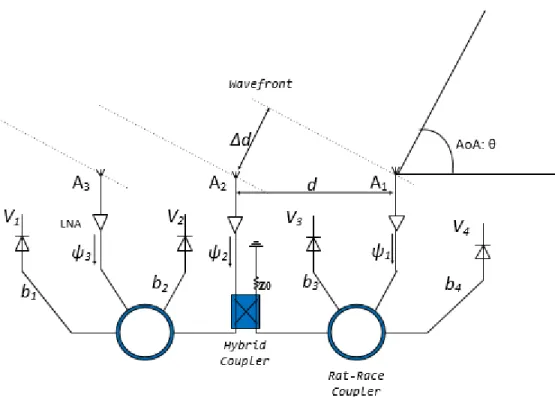
Figure 4.1 Block diagram of the proposed interferometer AoA detection system ... 40
Figure 4.2 Simulation results for the detected AoA (d=0.5λ) ... 43
Figure 4.3 Simulation results for the detected AoA (d=4λ) ... 43
Figure 5.1 bloc diagram of conventional six-port circuit ... 47
Figure 5.2 Proposed model for an SPR system taking into account all the identified system impairments [69]. ... 47
Figure 5.3 Photograph of the prototype demodulator [85] ... 48
Figure 5.4 Schematic of the proposed spatially distributed multi-input receiver ... 49
Figure 5.5 ɸx as a function of the inter-element distance ... 53
Figure 5.6 Block diagram of the proposed signal demodulator with phase shifters ... 54
Figure 5.7 Bit error rate for QPSK as a function of different coupling values. ... 56
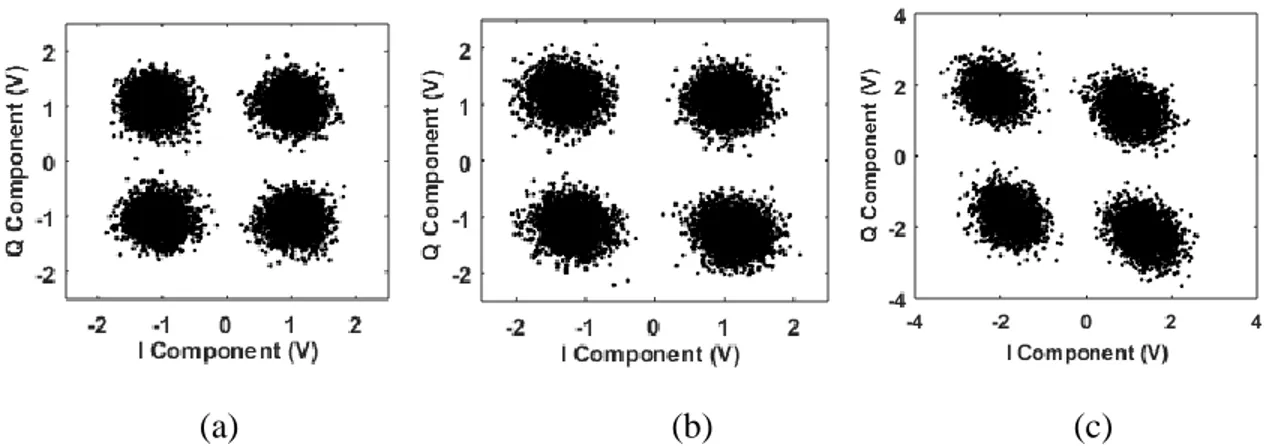
Figure 5.8 Simulated QPSK at 10 dB SNR and coupling of (a) -30 dB (b) -20 dB (c) -10 dB ... 57
Figure 5.9 Simulated QPSK at freq. offset of 50 Hz, (b) Simulated QPSK at freq.offset of 100 Hz, (c) Simulated QAM-16 at freq. offset of 50 Hz, (d) Simulated QAM-16 at freq. offset of 100 Hz ... 58
Figure 5.10 ADS simulation bloc diagram for the proposed multi-input interferometric receiver at 5 GHz ... 60
Figure 5.11 Simulation results for the received BPSK symbols over a period of 100 s ... 61
Figure 5.12 Simulation results for the received BPSK symbols over a period of 100 s ... 61
Figure 5.14 (a) received QAM-16 for a bandwidth of 100 MHz, (b) received QAM-16 for a
bandwidth of 200 MHz ... 62
Figure 5.15 Bit error rate for QPSK for different values for angle of arrival ... 64
Figure 6.1 Set of four patch receiving antennas at 5 GHz ... 66
Figure 6.2 S-parameters simulation results for the receiving antenna set ... 67
Figure 6.3 S-parameters measurement results for the receiving antenna set ... 67
Figure 6.4 Wilkinson based circuit for equal LO power feeding ... 68
Figure 6.5 Layout of the bandpass filter operating at 5 GHz ... 69
Figure 6.6 Simulated S-parameters for the band-pass filter operating around 5 GHz ... 69
Figure 6.7 (a) Filter S-parameters measurement results, (b) Digital photo of the filter under measurement ... 69
Figure 6.8 Digital photo of the fabricated test bench at 5 GHz with received 64-QAM ... 70
Figure 6.9 Digital photo of the fabricated test bench at 5 GHz with received 16-QAM ... 70
Figure 6.10 received I/Q bit stream for BPSK at data rate of 1Mb/s and over 100 s ... 71
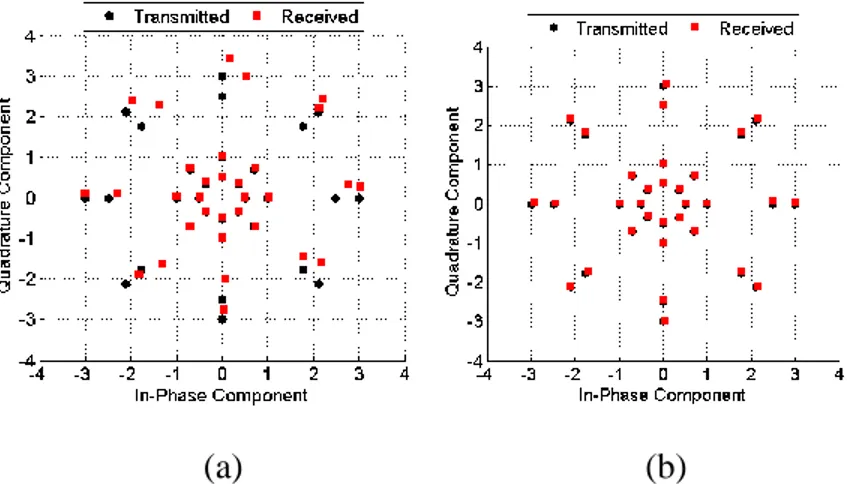
Figure 6.11 (a) received 16-PSK, (b) received 8-PSK, (c) received 16-QAM, (d) received 32-QAM, (e) received 64-32-QAM, (f) received QAM-256 ... 72
Figure 6.12 Alternative receiver architecture ... 73
Figure 6.13 Photo of the proposed spatial interferometry based receiver with delay lines ... 75
Figure 6.14 (a) received BPSK , (b) received QPSK , (c) received 16, (d) received QAM-32, (e) spectrum of received BPSK at 1 Mb/s ... 75
Figure 7.1 Experimental setup for performance assessment (8-PSK modulation) ... 80
Figure 7.2 Experimental setup for performance assessment (QPSK modulation) ... 80
Figure 7.3 Bloc diagram of the experimental test bench ... 82
Figure 7.4 Received 8-PSK for : (a) Pr = - 34 dBm, (b) Pr = - 37 dBm,(c) Pr = - 40 dBm,(d) Pr = - 45 dBm,(e) Pr = - 50 dBm, (f) Pr = - 54 dBm ... 83
Figure 7.5 AD8318 basic connections ... 86 Figure 8.1 Received QPSK constellation for (a) ϕ =70o, (b) ϕ =76o, (c) ϕ =81o ... 97 Figure 8.2 Schematic of the multi-input interferometer receiver for reception at unknown AoA . 98 Figure 8.3 Dead angles as a function of the inter-element distance between receiving antennas 103 Figure 8.4 Angle of arrival ambiguity- free detection range ... 103 Figure 8.5 AoA detection and correction of received QPSK constellation using training sequence ... 106 Figure 8.6 Received 8-PSK:(a) AoA=80o, (b) AoA=75o, (c) AoA=90o,(d) AoA=60o,(e) AoA =50o ... 107 Figure 8.7 Measurement results for AoA using the proposed method ... 108
LIST OF SYMBOLS AND ABBREVIATIONS
1-D One-Dimensional 2-D Two-Dimensional
5G Fifth generation of wireless systems ADS Advanced Design System
AM Amplitude Modulation AoA Angle of Arrival
AWGN Additive White Gaussian Noise BER Bit Error Rate
BPSK Binary Phase Shift Keying CDMA Code Division Multiple Access EVM Error Vector Magnitude
FCC Federal Communications Commission FDD Frequency Division Duplex
GSM Global System for Mobile communication HFSS High-Frequency Structure Simulator
I In-Phase
IC Integrated Circuit IS-95 Interim Standard 95
ITU International Telecommunications Union LO Local Oscillator
MIMO Multiple Input and Multiple Output OFDM Orthogonal Frequency Division Multiplex Q Quadrature
QAM Quadrature Amplitude Modulation RF Radio Frequency
SNR Signal to noise ratio TDD Time Division Duplex
TIA Telecommunications Industry Association UDN Ultra Dense Network
LIST OF APPENDICES
CHAPTER 1
INTRODUCTION
1.1 Motivation
Wireless communications have been one of the best success stories in the engineering field in the modern era. In fact, the Interim Standard (IS-95) was introduced by Qualcomm and then adopted as a standard by the Telecommunications Industry Association in TIA/EIA/IS-95 release published in 1995, as the first generation of Code Division Multiple Access (CDMA) based digital telephony in the United States [1]. Since then, a brand-new generation of wireless systems has been adopted every ten years or so [2]. IS-95 (Interim Standard-95) in the united states and GSM (Global System for Mobile communication) in Europe were at most able to provide data rates of about 9.6 Kb/s in early nineties, which just supported voice transmission and modest short messages service, with microwave carrier frequencies around 800/ 850/ 900/ 1800 MHz and using classic convolution coding, interleaving and simple diversity schemes as well as equalization to combat channel fading [3].
The third and fourth generations of mobile communications pushed the performances of telecommunication networks to unprecedented limits. In fact, the Universal Mobile Telecommunications Service (UMTS) and the Long Term Evolution (LTE) standards were introduced with novel modulation techniques such as Wideband-Code Division Multiple access (W-CDMA) and Orthogonal Frequency Division Multiplex (OFDM) in combination, with Multi-User Multiple Input Multiple Output MU-MIMO [4], and more robust coding schemes, which is needed to provide higher data rates of tens of Mb/s with better quality of service and ever decreasing latency to ensure that critical real time applications are supported [5].
However, with the exponential growth and explosion of mobile data traffic and the birth of a revolution of digital culture all over the planet, as people tend to use smartphones, tablets for data/video streaming, and billions of sensors for different goals are expected to be used by 2020 to connect vehicles, machines and collect/transmit data about temperature, fire activity, vital signals monitoring, the current 4G standard is just unable to carry on with the predicted volume of data traffic which is expected to be in order of tens of Exabytes per month in the coming years [6-10]. This urged the standardization bodies and the international regulatory agencies like the Federal Communications Commission FCC and the International Telecommunications Union
ITU to create special focus groups, which work hand in hand with industry in order to establish technical recommendations and general guidelines to be adopted within the fifth generation of wireless systems 5G [11-13].
1.2 Overview of 5G wireless standard
In order to meet the ever-increasing growth of data traffic in mobile networks, 5G network was introduced as a platform which is able to provide 1000 times more capacity (with a latency less than 1 millisecond) than the proceeding generation of wireless systems, namely 4G-LTE [14]. Although, this figure seems to be very promising, it is worth mentioning that it is very difficult to deploy it in practice using the same architecture of 4G standard. Hence, to get 5G network out of the myth into reality, researchers and engineers in both academia and industry have agreed on multiple critical points that should put 5G on the map within the next few years. Each of these points relates to one or more of OSI layers (Physical, Data link, Network, Transport, Session, Presentation and Application). And because this thesis focuses on some aspects of the physical layer, we will only introduce two features related to this layer of OSI model.
1.2.1 Massive MIMO
After Stanford university professor Paulraj introduced the MIMO concept for the first time in 1994 [15], mobile operators were very excited to apply this technology, which will enhance incredibly the spectral efficiency, and provide many orders of magnitude of wireless channels capacity without any increase in terms of transmitted power or allocated bandwidth. Many researchers invested significant efforts at Bell-Labs to prototype and test first MIMO prototypes [16]. However, it appeared soon that the mathematical modeling is far from reality and the expected scalable data rate with the number of antennas could not be reached in practice. The reason for this failure was discovered to be related to the fact that MIMO is only scalable in rich scattering environments with low correlation between antennas [17].
In real world measurements, the correlation between handset or base station antennas is strong, even in the absence of direct line of sight, which prevented MIMO to be a real revolution in wireless technology [18-20]. Some efforts went into the direction of looking at the problem from another point of view, by using multiple antennas at the base station, with multiple handsets
equipped with one antenna each, which is known as MU-MIMO [21]. However, the complexity of the dirty-paper coding technique to be used with the proposed scheme made MU-MIMO a good topic in academic research, but not for industry. Fortunately, Thomas Marzetta came up with the solution in his 2010 paper entitled: ‘’Noncooperative Cellular Wireless with Unlimited Numbers of Base Station Antennas’’[22], and demonstrated that MU-MIMO is a suitable solution when using so many antennas at the base station with single antenna handsets as illustrated in Figure 1.1. In fact, the use of a couple of hundred antennas at the base station in combination with maximum ratio combining or zero forcing at the base station alleviates even the need to estimate the channel in the downlink, while providing multiple orders of magnitude of increase in the sum spectral efficiency (up to 145 bits/sec/Hz) and allocating the whole the bandwidth to everyone within the cell, and not relying on FDD but rather on TDD [23]. Testbeds at sub-6GHz frequency, have been built in Sweden, England, the United States and China to verify the proposed solution of Marzetta and all of them agreed that Massive MIMO is going to be the benchmark of 5G [24-27].
Figure 1.1 Massive MIMO: spatial multiplexing pushed to a pleasant extreme [28]
1.2.2 5G ultra-dense network
Sub-6 GHz frequencies have been always the preferred part of the electromagnetic spectrum to be used in wireless communications because of the easiness of RF circuits design at those frequencies, their low cost, and especially the ability of low frequencies to reach far distances as the pathloss behaves in free space, as the square of the inverse of the carrier frequency. These
characteristics of microwave frequencies were of great interest for mobile operators, when deploying their networks using large cells with radius of up to 30 km, which reduced the cost of deployment and enabled the fast penetration of past generations into the market.
Unfortunately, because of the scarcity of radio resources at microwave frequencies and the explosion of services and applications to be served in 5G networks, especially with the birth of internet of things (IoT), which would connect machines, sensors, etc.., and enable the automation of thousands of functions, it has been found evident that a migration toward millimeter waves is needed (28, 38 and 60 GHz), where several GHz of bandwidth are available for use [29-30]. Hence, it is obvious that 5G cellular network will be a combination of large umbrella cells using microwaves, where each large cell is subdivided in small cells (with radius in the range of few hundred meters) serving users through millimeter waves [31].
In fact, it is necessary to understand that 5G spectrum is not only about mm-waves, but it is rather a completely new paradigm of sub-6 GHz frequencies serving users with high mobility (e.g. vehicles with high speeds in highways) in order to avoid the traffic of handovers, and using mm-waves for users with low mobility and who demand high data rates, which is illustrated in Figure 1.2.
1.2.3 Power consumption and energy efficiency in 5G networks
The migration from one generation of wireless systems to the next faces many challenges and problems that need to be studied and solved. In fact, 5G networks are not an exception, as they must be planned in such a way to handle the extremely huge volume of data that is expected to be generated by the billions of connected devices. Moreover, the number of nodes in 5G backhaul network is going to be many orders of magnitude bigger than its counterpart in past generations, because of the ultra-densification of cells [32-35]. Thus, it is obvious that the energy consumption of 5G base stations will be greater than 4G network BSs. In addition, all connections in the backhaul subsystem must be wirelessly deployed to enable fast penetration into the market and mainly to reduce the costs, by avoiding fiber optics interconnectivity. There is also the lurking threat behind the promise of 5G delivering up to 1,000 times as much data as today’s networks is that 5G could also consume up to 1,000 times as much energy, which is a big problem, since today’s 4G network power consumption is already huge. Concerns over energy efficiency are beginning to show up at conferences about 5G deployments, where methods for reducing energy consumption have become a hot topic. As a matter a fact, new low-power wireless transceiver architectures must be introduced, studied and validated in order to be used within 5G systems in order to avoid a possible divergence of energy efficiency toward values that would complicate the deployment of the new technology [36-38].
1.3 Overview of RF receiver architectures
1.3.1 Super-heterodyne receiver
The most popular configuration for RF receivers is the super-heterodyne architecture. As depicted in Figure 1.3, this typical architecture is based on multiple down-conversion stages, where the received RF signal is first amplified and translated around an intermediate frequency using a first mixer Mixer 1 and a local oscillator LO1, then, a second down-conversion using LO2 takes place to get the baseband signal. The first band pass filter is used to pre-select the bandwidth of operation (which is essential to reduce the amount of noise gathered at the input of the low-noise amplifier LNA). The second band pass filter is needed for image rejection (the symmetric channel in the frequency domain that would fall around the same frequency after
Mixer1). The third BPF is used for channel selection and both low-pass filters are used to get the baseband in-phase and quadrature components (I and Q) of the RF modulated signal. This architecture has been the most used in wireless receivers since its first introduction by American electrical engineer Edwin Howard Armstrong in his patent of 1917 [39]. In fact, super-heterodyne receivers ensure a good level of sensitivity (allowing lower power signal at receiver input for which there is sufficient signal-to-noise ratio at the receiver output) thanks to the multi-amplification stages, which clearly makes this architecture the best of RF receivers in terms of dynamic range, which could easily reach 120 dB. The good features of the super-heterodyne receiver are not a free lunch, because of the high-power consumption of this receiver (within the multi-amplification stages and the required LO power levels to drive the mixers) [40].
1.3.2 Homodyne zero-IF receiver
Another typical architecture is the zero-IF receiver, also known as the homodyne receiver, which is depicted in Figure 1.4. This architecture is a simplified version of the super-heterodyne receiver, because instead of using two or more down-conversion stages, it converts the RF signal directly to baseband. First, the modulated signal is first selected through a band pass filter, and then it is amplified. Finally, it is directly down converted to baseband using two mixers with a 90o phase shift between them (to get I /Q components separately). Compared to the heterodyne
Figure 1.4 Homodyne receiver block diagram
architecture, this has a clear reduction in the number of analogue components and guarantees a high level of integration thanks to its simplicity. Despite its simplicity compared to the super-heterodyne architecture, many components of the zero-IF receiver are more complex to design and deploy. In addition, the direct translation to DC can generate several problems that have strongly conditioned the use of this architecture over its super-heterodyne counterpart.
Problems like DC offset (which is caused by local oscillator (LO) leakage to RF port resulting in unwanted self-mixing), I/Q mismatch due to errors in I/Q modulation have been widely reported in literature [41-43]. A similar configuration to the previous one is the low-IF receiver, in which the RF signal is mixed down to a non-zero low or moderate IF (few hundred kHz to several MHz) instead of going directly to DC, using quadrature RF down-conversion. This solution attempts to combine the advantages from the zero-IF receiver and the super-heterodyne receiver. This architecture still allows a high level of integration (advantage from zero-IF) but does not suffer from the DC problems (advantage from super-heterodyne), since the desired signal is not situated around DC. However, this architecture continues to suffer from the image frequency, I/Q mismatch problems and the ADC power consumption is increased as high conversion rate is required.
1.3.3 Six-port receiver
The official birth year of the six-port measurement technique is 1977, when three fundamental papers [44] and several accompanying papers were published in the December issue of the IEEE Transactions on Microwave Theory and Techniques. Although the inventors, Glenn F. Engen and Cletus A. Hoer of the National Bureau of Standards (now National Institute of Standards and Technology), Boulder, Colorado, USA, had published papers with partial ideas and used the term previously, these articles presented for the first time a complete and unified theoretical background and offered guidelines for optimum six-port design [45]. The six-port technique is a method of network analysis, i.e. that of scattering parameters measurement: either only of reflection coefficient, in which case we speak about six-port reflectometer (SPR) or both reflection and transmission coefficients, in which case we speak about six-port network analyzer (SPNA).
In May 1994 and during IMS week in San Diego, California, USA., J. Li, a Ph.D. candidate under the supervision of Professor Ke Wu and Professor Renato G. Bosisio in the Poly-Grames Research Center at Polytechnique Montreal, presented for the first time the six-port receiver and proved the concept of calculating the complex ratio of an incoming modulated signal and a known local oscillator (LO) signal by using the six-port technique [46]. Since then, hundreds of research papers have been published and presented with the study and implementation of six-port
based RF receivers capable of incorporating many functions such as demodulation, angle of arrival detection, Doppler shift detection for RADAR applications, etc. As depicted in Figure 1.5, the canonical architecture that is widely known for six-port receivers is composed of a passive junction composed of power dividers and/or hybrid couplers. This junction is in charge of providing interferometric combinations between the LO reference signal and the incoming RF modulated signal. These combinations are required to discriminate the angle and amplitude of the received signal after passing the four outputs of the junction through power detectors operating under their square law-region [47]. In fact, the six-port receiver has many advantages over conventional heterodyne and homodyne receivers. However, SPR has its own limitations, which will be summarized in the Table 1.1.
Table 1.1 Comparison of RF receiver architectures
Architecture Advantages Major problems
Super-heterodyne Selectivity
Sensitivity
High dynamic range
Image frequency Complexity Huge LO power Homodyne Simplicity IC integration Strong DC problems High LO power Low-IF No DC problems Simplicity of design Requires high performance ADC Image frequency
Six-port receiver Broadband junction
Simplicity of design Suitable for mm-waves Very low LO power
Limited dynamic range More than 6 dB of loss
I/Q mismatch
Non-linearity of power detectors
1.4 Major contributions
This Ph.D. thesis focuses on the study, analysis, design, implementation and experimental validation of a novel interferometric receiver. In fact, the six-port receiver has attracted attention from both academia and industry for its many advantages (some of them are listed in Table 1.1.1). SPR is attractive for 5G applications because it requires many orders of magnitude less LO power than conventional heterodyne/homodyne receivers. Hence, it is well suitable for devices to be used in the next generation of wireless systems, in order to considerably reduce the energy consumption of the whole network. Moreover, SPR can easily be implemented at mm-waves using simple circuitry which could be integrated on the same PCB, which has been proved and demonstrated in many research papers at 28 GHz, 60 GHz and beyond. However, the six-port receiver suffers from its low dynamic range, which is limited by the width of the square law region of power detectors. In addition to not being able to compete against classic homodyne and heterodyne receivers in terms of dynamic range, SPR presents at least 6 dB of loss within the six-port junction because of the use of passive hybrid couplers. In practice the loss is greater than 6 dB caused by substrate loss of the fabricated circuits.
In this context, we propose in this thesis, a dual SPR receiver that provides twice the dynamic range of classic SPR while requiring only 3 dB more LO power, which enables the recovery of high order modulation schemes at reduced EVM values when compared to conventional SPR. In addition, a novel spatially distributed multi-input interferometric receiver is proposed. This receiver inherits all the advantages of classic SPR and reduces their loss by 50%. Various modulation schemes are successfully received with an EVM less than 10 % using a test bed implemented at 5 GHz for proof of concept demonstration. And to operate at higher data rates, a power detector is also designed using Analog Devices AD8318 chip with a measured rise time of about 17 ns. This power detector is used to improve measured data rate for up to 20 MS/s.
Finally, we propose a method for AoA detection using the proposed spatially distributed multi-input receiver. This method is based on sending a training sequence, which is known at the transmitter and receiver. Then, AoA can be easily computed within the ambiguity-free interval using a simple algorithm. Measurements results carried out at 5 GHz show good agreement with
simulations with an error less than 10%, which validates the feasibility of using the proposed method for AoA detection.
1.5 Thesis organization
This research work starts from the foundations of conventional six-port receivers and proposes new alternatives for the design of more flexible architectures capable of performing joint direct demodulation and angle of arrival detection. The present thesis is organized as follows:
Chapters 1 and 2 present a general introduction for the thesis research work, by exploring the history of wireless technology and providing an overview of 5G standard, with a summary of digital communications and their application in the study of conventional demodulators.
In chapter 3, we propose a dual six-port receiver with improved dynamic range. The proposed six-port based receiver makes use of two six-port passive circuits operating in parallel to process high-order modulation schemes. An experimental prototype is developed in order to validate the theoretical modeling, and reported measurement results have confirmed the capacity of this architecture in doubling the dynamic range of six-port receivers. A simple interferometer-based direction of arrival detection system is also reported in chapter 4, which is composed of three hybrid couplers and combines the waves received through four equally-spaced antennas in order to determine the angle of arrival through a process of phase discrimination.
Chapter 5 presents the mathematical modeling for the principle of operation of a novel spatially distributed multi-input interferometric receiver. The new receiver architecture aims to reduce the natural loss of classic six-port receivers, while inheriting all their advantages such as design simplicity, low-cost and low power consumption. Simulations results for various effects, like antenna coupling and carrier frequency offset are reported in this chapter. An experimental prototype operating at 5 GHz is investigated in chapter 6, in order to validate the theory and simulations of chapter 5 and compare obtained results with those reported in the published state-of-the-art.
In chapter 7, we provide further measurement results covering more aspects, in the aim of assessing the performance of the proposed architecture at different values of the received power and at higher data rates when using fast power detectors having a short-rise time. In addition, a
new method is presented in chapter 8, for angle of arrival detection through the baseband recovery of a training sequence known at the transmitter.
Finally, a summary of the research outcomes is given in chapter 9. This is supported by some concluding remarks and some interesting research tracks to be followed in the future based on the introduced ideas through this dissertation.
CHAPTER 2
STATE OF THE ART OF DIGITAL COMMUNICATIONS
In order to make this thesis self-consistent and self-contained, this chapter presents a general overview of digital communications, by working out the fundamentals. First, a brief history of digital communications is presented. Then, the basics of digital modulation/demodulation techniques are introduced in connection with practical RF implementations. Finally, some well-known performance indicators such Error Vector Magnitude EVM and bit error rate BER are presented for different wireless channels.
2.1 History of wireless communications going digital
The beginning of the twentieth century witnessed the first attempts of transmitting voice wirelessly using analog AM modulation. Later, wireless telegraphy appeared as one of the first techniques to transmit information as a series of discrete symbols (dot, dash, letter space, word space). Nyquist and Hartley made incredible and important contributions in modeling communication theory in their Bell System Technical Journal papers of 1924 and 1928, respectively [48-49]. They both introduced some first approximation relationship affecting wireless telegraphy speed, noise and bandwidth. However, digital communications and the theory of information were not fully understood until Claude E. Shannon published his historical paper of 1948, entitled: A Mathematical Theory of Communication, which is considered the best paper ever written in the field of engineering [50]. In this paper, Shannon was able to give an abstract model for any digital communication system and he derived the first closed-form expression for the capacity of transmitting information (maximum data rate) in the case of an additive white Gaussian noise, as a function of available bandwidth B and signal to noise ratio SNR
) 1 ( log . 2 SNR B C (2.1)
Shannon demonstrated that for a given set of B and SNR, one could transmit and receive data at any rate R<C at any arbitrarily low error value, using a suitable modulation/coding scheme. It is worth mentioning that the goal of any communication system (including 5G and beyond) is to increase data rates and try to reach the Shannon capacity, which is a fundamental limit. As a
matter of fact, 5G systems will include new portions of the electromagnetic spectrum (mm-waves), as the low microwave frequencies can no longer offer the expected data rates, and thus more bandwidth is needed to linearly increase the capacity of 5G systems.
2.2 Basics of digital modulation
Radio communications are used for transmitting and receiving information wirelessly, through radio. In communication systems, a process called digital modulation is very crucial since it transforms digital symbols into waveforms that are compatible with the characteristics of the channel, so that signal transmission becomes more efficient. Digital modulation includes baseband modulation as well as bandpass modulation. In the baseband modulation, these waveforms are a sequence of shaped pulses, which are made suitable for wired communications. On the other hand, in the bandpass modulation, shown in Figure 2.1, the shaped pulses further modulate a high-frequency sinusoidal signal, which is often called a carrier. The bandpass modulation is essentially shifting the low-frequency spectrum of the shaped pulses to a high carrier frequency. In this way, it brings up a number of advantages for wireless signal transmission. First, high-frequency signals can be radiated effectively by an antenna with reasonable size. Second, high-frequency signals from different sources can share a single channel through frequency-division multiplexing. Third, interference can be minimized through some modulation schemes. Finally, some system operations such as filtering and amplification can be easily performed by properly choosing a carrier frequency [51].
Let us denote a sinusoidal signal (carrier) as: ) cos( . ) (t A t S (2.2)
where A, ω, θ are the amplitude, the radian frequency and the phase of the carrier signal, respectively. By varying one or more of these three parameters, we can obtain fundamental bandpass modulation techniques: ASK, FSK and PSK and QAM.
2.2.1 Amplitude shift keying
The expression of an ASK modulated signal is:
N i t A t Si() i.cos(c 0); 1.. (2.3)
where the amplitude of the carrier Ai changes with respect to the corresponding input signal, while ωc and θ0 are kept constant. Binary ASK (often called on-off keying (OOK)) is a special case of ASK modulation. Figure 2.2(a) shows the digital symbols and the corresponding modulated waveform of an OOK signal, and Figure 2.2(b) illustrates OOK constellation.
Figure 2.2 (a) Waveform and (b) constellation diagram of OOK signal
Binary ASK is the simplest of the digital modulation in terms of mathematical modeling, as well as from the point of view of practical implementation of the both the modulator and demodulator. However, OOK only offers 1 bit per transmitted symbol, and thus it is not spectrum efficient, but
it is always preferred for use when only low data rates are needed, or when the signal to noise ratio is so low, and cannot handle complex modulation schemes. This modulation could be more spectrum efficient if the carrier is modulated with multi-levels to enhance the overall bit rate.
2.2.2 Frequency shift keying
An FSK modulated signal is expressed as:
N i t A t Si( ) .cos(i 0); 1.. (2.4)
where the radian frequency of the carrier ωi changes with respect to the corresponding input
signal, while A and θ0 are kept constant. Figure 2.3(a) shows the digital symbols and the corresponding modulated waveform of a binary FSK (BFSK) signal, and Figure 2.3(b) illustrates the corresponding constellation.
Figure 2.3 (a) Waveform and (b) constellation diagram of BFSK signal
FSK is more robust against noise than ASK and thus is preferred to achieve lower BER, however, it is not spectrum efficient as it requires more bandwidth than any other modulation scheme. Thus, the designer of any communication system must make a compromise while choosing the suitable modulation scheme, given the constraints he is dealing with [52].
2.2.3 Phase shift keying
N i t A t Si( ) .cos(c i); 1.. (2.5)
where θi will have N discrete values while A and ωc are constant.
Figure 2.4 (a) Waveform and (b) constellation diagram of BPSK signal
Figure 2.4(a) shows the digital symbols and the corresponding modulated waveform of a binary PSK (BPSK) signal. We can see that the modulated waveform adopts two different phase conditions according to the value of digital symbols. From the corresponding constellation diagram shown in Figure 2.4(b), we can observe that the BPSK signal has the largest Euclidean distance for a given signal energy, and therefore, it should have the lowest BER for a given SNR compared to OOK and BFSK signals [53].
2.2.4 Quadrature amplitude modulation
In order to enhance the spectrum efficiency of previously stated modulation schemes, another form of encoding symbols into discernable waveforms is known as QAM, which modulates instantaneously two orthogonal sinusoids and adds the two obtained modulated carriers before transmission. Hence, M-ary QAM modulations can created (where M is the size of the constellation) where each of the orthogonal sinusoids is modulated through an M-1/2 PAM modulation. In Figure 2.5(a), 4-QAM is also regarded as quadrature PSK (QPSK). Due to its high transmission efficiency, QAM is extensively used in wireless communications. And if the signal
to noise ratio allows it, then high order QAM modulations could be used like 16-QAM, which is depicted in Figure 2.5(b)
Figure 2.5 Constellation diagram of (a) 4-QAM (QPSK) signal and (b) 16-QAM signal
2.3 Quadrature demodulation
The reverse process of modulation is called demodulation and it consists in the extraction of the baseband signal containing the transmitted information from the received RF bandpass modulated signal.
Let us simply express the received signal r(t) as: ) sin( . ) cos( . ) (t I t Q t r c c (2.6)
where I and Q are the in-phase and quadrature components of the received signal. And ωc is the
radian frequency of the carrier. At the receiver, a reference signal u(t) is used to demodulate the received signal and it can be denoted as:
) cos( )
(t t
u c (2.7)
As depicted in Figure 2.6, In the I-channel, the received signal is mixed with a coherent reference signal, and then the mixing products are filtered by a low-pass filter (LPF), which gives the in-phase component of the received signal. This process can be mathematically represented as follows. I t Q t I t t Q t I t t r LPF c c c c c c 2 ) 2 sin( . 2 ) 2 cos( 1 . ) cos( )). sin( . ) cos( . ( ) cos( ). ( (2.8)
In the same way, the quadrature components can be extracted by mixing the received signal with the same coherent signal shifted by 900 and applying a low pass filter to the output of the mixer.
Q t Q t I t t Q t I t t r LPF c c c c c c 2 ) 2 cos( 1 . 2 ) 2 sin( . ) sin( )). sin( . ) cos( . ( ) sin( ). ( (2.9)
2.4 Quantification of the quality of transmission
2.4.1 Error vector magnitude
The error vector magnitude or EVM (sometimes also called relative constellation error or RCE) is a measure used to quantify the performance of a digital radio transmitter or receiver. A signal sent by an ideal transmitter or received by a receiver would have all constellation points precisely at the ideal locations, however various imperfections in the implementation (such as carrier
leakage, low image rejection ratio, phase noise etc.) cause the actual constellation points to deviate from the ideal locations. Informally, EVM is a measure of how far the points are drifted from the ideal locations.
Noise, distortion, spurious signals, and phase noise all degrade EVM, and therefore EVM provides a comprehensive measure of the quality of the radio receiver or transmitter for use in digital communications.
Figure 2.7 Constellation diagram and error vector
As illustrated in Figure 2.7, an error vector is a vector in the complex plane between the ideal constellation point and the point received by the receiver. In other words, it is the difference between actual received symbols and ideal symbols, and is mathematically expressed as [54]:
100 . (%) 2 2
n n n s s r EVM (2.10)2.4.2 Bit error rate
In digital transmission, the number of bit errors is the number of received bits of a data stream, over communication channels, which have been altered due to noise, interference, distortion or bit synchronization errors. The bit error rate (BER) is the number of bit errors per unit time. The bit error ratio (also BER) is the number of bit errors divided by the total number of transferred bits during a studied time interval. Bit error ratio is a unitless performance measure, often expressed as a percentage.
In simulations, BER may be evaluated using stochastic (Monte Carlo) computer simulations. If a simple transmission channel model and data source model is assumed, the BER may also be calculated analytically using closed-form expressions. The computation of bit error rate has been extensively studied in literature, and we can find BER closed-form expressions for almost all types of wireless channels (AWGN, Rayleigh, Rice, Nakagami-n, Nakagami-m, etc..) [55]. In fact, an additive white Gaussian noise channel is only an ideal model that does not exist in reality, and is only used for education purposes, because of its simplicity and the easiness of equations derivation in AWGN context. In the case of a wireless link with no line-of-sight component, the channel is modeled as Rayleigh. If a line-of-sight component is present, the channel is called Ricean. In some special cases, it has been shown that none of the aforementioned channel models fits with real world measurements. For this reason, new models were developed, like Nakagami-n and Nakagami-m, which incorporate parameters that can take into account new phenomena that Rice and Rayleigh models cannot describe [55].
The analysis of the performance of any communication system must include the study of bit error rates for different modulations schemes within the channel, in which the transmitter and receiver are deployed. Such analysis is crucial in system design, as it will determine how much power the transmitter must radiate and what kind of channel coding technique must be used to decrease error rate at the receiver side. It is worth mentioning that EVM and BER are related to each other through a closed-form expression, so determining one of them through simulations or measurements is enough to get the value of the other parameter [56].
M EVM L L Q L L P RMS b 2 2 2 2 2 .log 2 1 log . 3 . log ) 1 1 ( 2 (2.11) The following table gives closed-form expressions for SER and BER in AWGN channel, as a function of the signal to noise and bit energy to noise ratios.
Table 2.1 Symbol and bit error probabilities for coherent modulation in AWGN channel Modulation Symbol Error Rate: SER Bit Error Rate: BER
BPSK Ps Q( 2s) Pb Q( 2b)
QPSK Ps 2Q( s) Pb Q( 2b)
M-PSK Ps 2Q( s sin(/M)) ( 2 log sin( / ))
log 2 2 2 M M Q M Ps b M-QAM ) 1 3 ( 4 M Q P s s ) 1 log 3 ( log 4 2 2 M M Q M Ps b
Figure 2.8 Bit-error rate simulation results for BPSK, QPSK, 8-PSK and 16-PSK, over AWGN channel.
Figure 2.9 Bit-error rate simulation results for QAM-4, QAM-64 and QAM-256, over Rayleigh channel.
Figure 2.10 Bit error rate simulation results of QAM-16 with selection diversity over Rice channel (K=10 dB)
2.5 Conclusion
This chapter has briefly introduced the history of digital communications. Then, several basic digital bandpass modulation techniques, as well as the process of demodulation were presented. Finally, the chapter was concluded by illustrating some key performance indicators of digital transmission, namely, the error vector magnitude EVM and bit error rate BER. Both metrics will be used in next chapters when examining the performances of the proposed receiver architecture.
CHAPTER 3
DYNAMIC RANGE IMPROVEMENT OF SIX-PORT
RECEIVER
There is an increasing demand for high data-rate wireless communications and broadband transceiver/ receiver systems with reduced hardware complexity and high flexibility. However, the existing hardware architectures for radio communication systems suffer from a number of limitations including high cost, design complexity, as well as high power consumption. For instance, for most mixers in conventional receivers, to obtain a good conversion gain, the power of local oscillator must be more than 10 dBm [57], which is a relatively high-power level. Moreover, in conventional receiver systems, the phase noise of the local oscillator (LO) is transformed directly into the phase noise in the baseband [58]. This results in adjacent channel interference, usually caused by reciprocal mixing, consequently decreasing the selectivity of the receiver. Radio architectures having a potential to overcome the previously mentioned limitations include six-port based RF receivers. The design simplicity combined with the wideband characteristics of a six-port receiver architecture tackles many of the current challenges of receiver systems. It provides a straightforward approach for broadband operations, low power consumption, and low manufacturing cost, making it a promising candidate for various applications within the next generation of wireless systems 5G [59-60].
3.1 Operation principle of the six-port receiver
The six-port circuit was first introduced by Cohn and Weinhouse to evaluate the phase of a microwave signal, and it was extended by Hoer and Engen as an alternative low-cost network analyzer to be used for the accurate computation of the reflection coefficient of microwave circuits. Between 1972 and 1994, several research activities around the six-port concept were conducted by many laboratories including Poly-Grames Research Center of Ecole Polytechnique de Montreal, where the six-port was used for the first time in history as a direct conversion millimeter wave receiver. Since then, the six-port direct conversion receiver (SPR) has attracted attention from both academia and industry, where it has used as modulator, demodulator, in radar application and angle of arrival detection systems, and in many other applications [61-65].
![Figure 1.1 Massive MIMO: spatial multiplexing pushed to a pleasant extreme [28] 1.2.2 5G ultra-dense network](https://thumb-eu.123doks.com/thumbv2/123doknet/2339891.33658/25.918.207.712.625.838/figure-massive-spatial-multiplexing-pushed-pleasant-extreme-network.webp)
![Figure 5.2 Proposed model for an SPR system taking into account all the identified system impairments [69]](https://thumb-eu.123doks.com/thumbv2/123doknet/2339891.33658/69.918.251.676.474.819/figure-proposed-model-spr-taking-account-identified-impairments.webp)