Open Archive TOULOUSE Archive Ouverte (OATAO)
OATAO is an open access repository that collects the work of Toulouse researchers and
makes it freely available over the web where possible.
This is an author-deposited version published in :
http://oatao.univ-toulouse.fr/
Eprints ID : 18316
To link to this article : DOI:10.1515/ehs-2016-0003
URL :
http://dx.doi.org/10.1515/ehs-2016-0003
To cite this version :
Monthéard, Romain and Bafleur, Marise and
Boitier, Vincent and Dollat, Xavier and Nolhier, Nicolas and Piot,
Estelle and Airiau, Christophe and Dilhac, Jean-Marie Coupling
supercapacitors and aeroacoustic energy harvesting for
autonomous wireless sensing in aeronautics applications. (2016)
Energy Harvesting and Systems, vol. 3 (n° 4). pp. 1-12. ISSN
2329-8774
Any correspondence concerning this service should be sent to the repository
administrator:
[email protected]
Romain Monthéard, Marise Bafleur*, Vincent Boitier, Xavier Dollat, Nicolas Nolhier, Estelle
Piot, Christophe Airiau and Jean-Marie Dilhac
Coupling Supercapacitors and Aeroacoustic
Energy Harvesting for Autonomous Wireless
Sensing in Aeronautics Applications
DOI 10.1515/ehs-2016-0003
Abstract: This paper reports for the first time the experi-mental demonstration of a wireless sensor node only powered by an aeroacoustic energy-harvesting device, meant to be installed on an aircraft outside skin. Aeroacoustic noise is generated on purpose to serve as a means of converting mechanical energy from high velocity airflow into electrical energy. Results related to the physical characterization of the energy conversion process are pre-sented. The proposed aeroacoustic transducer prototype, consisting in a rectangular cavity fitted with a piezoelectric membrane, is shown to deliver up to 2 mW AC power under Mach 0.5 airflow. Optimized power management electronics has been designed to interface with the transducer, includ-ing a self-powered Synchronized Switch Harvestinclud-ing on Inductor (SSHI) interface circuit and an efficient buck-boost DC/DC converter. The design of micropower auxiliary circuits adds functionality while preserving high efficiency. This circuit stores energy in supercapacitors and is able to deliver a net output DC power close to 1 mW. A fully auton-omous system has been implemented and tested, success-fully demonstrating aeroacoustic power generation by supplying a battery-free wireless datalogger in conditions representative of an actual flight.
Keywords: energy harvesting, energy management, aeroacoustics, wireless sensor, embedded systems, battery-free, supercapacitors
Introduction
In recent years, Wireless Sensor Networks (WSN) have been considered for various aeronautical applications, including flight tests during the development of a new aircraft and Structural Health Monitoring (SHM) during its commercial exploitation (Dilhac et al. 2009). Up to now, this sensing is implemented using wires inducing kilometers of additional wiring (300 km extra cabling on an Airbus A380 for specific sensing during flight test in addition to the 500 km regular cabling). However, going wireless for communication also requires being wireless for energy. Isolated from the onboard electrical network, each sensor node needs to be self-powered. Environmental concerns, together with economical and safety-related issues, often prohibit the use of electrochemical batteries. Fortunately, energy may be harvested in the sensor’s environment, providing a reliable and sustainable electri-cal power source.
The energy resource in an aircraft environment is diverse yet non-uniformly distributed, which leaves room for investigating various ambient energy harvesting techniques. Motivated by the opportunity to propose an alternative and complementary solution to those already under investigation (e. g. photovoltaics, vibrations, thermal gradients, etc....) (Dilhac and Bafleur 2014; Vanhecke et al. 2015), the goal of this work is to exploit the abundant resource associated with the relative wind. A very well known technique for generating electrical energy from airflow relies on the use of a wind turbine. Whereas such a device may be efficient at relatively large scale, its performance decays greatly with downscaling (Mitcheson et al. 2008). Therefore, alternative airflow energy harvesters have been proposed in recent years, following different approaches. One method, relying on the aeroelastic flutter phenomenon, consists in driving a membrane into vibration by directly submitting it to the airflow (Li, Yuan, and Lipson 2011; Humdinger Wind Energy; Kwuimy et al. 2012). An alternative approach, based on the aeroacoustic phenomenon, implies that a membrane is driven into vibration by acoustic waves that
*Corresponding author: Marise Bafleur, LAAS-CNRS, Université de Toulouse, CNRS, UPS, INSA, Toulouse, France,
E-mail: [email protected]
Romain Monthéard, Vincent Boitier, Xavier Dollat, Nicolas Nolhier, LAAS-CNRS, Université de Toulouse, CNRS, UPS, INSA, Toulouse, France
Estelle Piot, ONERA – The French Aerospace Lab, Toulouse, France Christophe Airiau, IMFT, Université de Toulouse, Toulouse, France Jean-Marie Dilhac, LAAS-CNRS, Université de Toulouse, CNRS, UPS, INSA, Toulouse, France
result from the interaction of the airflow with a particular geometry. We consider that the latter approach leads to devices that are easier to realize and subject to less wear. A few contributions following this approach have been proposed recently. In Hernandez, Jung, and Matveev (2011), the authors proposed to use baffles so as to dis-turb the airflow in a pipe, thus generating acoustic noise. Using a nearby cavity, with depth and diameter of 7 cm each, and fitted with a pizeoelectric membrane, up to 0.55 mW electrical power was harnessed. Other authors employ a custom Helmholtz acoustic resonator, fitted with an electromagnetic (Kim et al. 2009) or a piezolectric (Matova et al. 2010) microgenerator. Matova et al. (2010) achieved 2 µW at 13 m/s airflow velocity, using a mesos-cale prototype.
In this work, the aeroacoustic transduction process is investigated, with a focus on demonstrating the potential of such a technique to power a wireless sensor. Unlike earlier work, significantly higher airflow speeds are considered, as dictated by typical civil aircraft cruise speeds. These high speeds, and the necessity of minimizing the impact on the aerodynamic surfaces preclude the use of moving parts, or protruding devices such as miniaturized air turbines. Furthermore, this paper presents the design of optimized power management electronics and the experimental validation of a fully autonomous system.
In Section “Device Design and Characterization”, after a brief introduction about the physics linked to aeroacoustic phenomenon, we describe the design and characterization results of the proposed transducer. The section “Power Management Electronics” provides insights on the design of the power management electro-nic circuit as well as performance measurement. Finally, the full system evaluation is presented in Section “Full System Experimental Validation”4.
Device Design and Characterization
Proposed Harvesting Principle
As mentioned in the Introduction, in aeronautics applica-tion electrochemical storage is generally prohibited and energy harvesting coupled to electrostatic storage is a good alternative. Although many different sources of energy are present in an aircraft, for some parts of the aircraft far away from the engine, vibrations and thermal gradients are too low and solar energy is only available during daylight.
The originality of the proposed energy harvesting technique is to take advantage of the abundant resource associated with the relative wind of the aircraft. Instead of using a wind turbine that is not compatible with the aerodynamics of the aircraft, the basic idea is to locally generate aeroacoustic noise using a specifically designed cavity and the speed of the aircraft. To this aim, the contemplated transducer is made of a rectangular cavity fitted with a piezoelectric membrane at its bottom to harvest the aeroacoustic noise accordingly generated. The cavity is chosen as rectangular because aeroacoustic noise has been modelled for such a geometry (see Section “Aeroacoustic Transducer Design”).
To cope with the intermittency of such generated energy, an electrostatic storage is needed as an energy buffer. Moreover, specific conversion architecture has to be designed to maximize the transfer of energy from the transducer on the one hand and to provide an efficient energy management on the other hand, since such architecture needs to autonomously start when the electrostatic storage is empty.
Aeroacoustic Transducer Design
The phenomenon of cavity noise is linked to self-sustained coherent oscillations in the shear layer developing above a cavity in the presence of grazing flow. A complex feed-back process can lead to important radiated noise, with both discrete and broadband components (Rowley and Williams 2006). Figure 1 depicts the basic geometry considered in this work that is a 2-D rectangular cavity with length L and depth D and presents a photograph of the corresponding fabricated harvester. As shown in Figure 1(b), a screwed 2-mm thick flange is used to firmly attach the membrane, Murata 7BB-20-6, that is 20 mm in diameter and 420 µm in thickness. Figure 2 shows typical generated acoustic spectra for different airflow speeds as obtained by the experimental apparatus described in Figure 3.
To size the cavity, we used Rossiter (Rowley and Williams 2006) and East (1966) analytical formulations that respectively relate the peaks in the oscillation spec-trum and the dominant frequency to the cavity dimensions: fn= U∞ L n − α M+ 1 k Rossiter formula (1) f1=4= c0 4D 1 + 0.65 L=D! ð Þ0.75" East formula (2) a pizeoelectric membrane, up to
In Rossiter formula, U∞is the free-stream flow velocity, L
is the cavity length, α and κ are empirical constants depending on the cavity aspect ratio (i. e. ratio between length L and depth D), and M is the free-stream Mach number, i. e. the ratio between the free-stream flow velocity and the speed of sound. n is the index of Rossiter’s mode. In East formula, c0 is the speed of
sound.
We used these formulas to design and test 6 different cavities with the constraint that they have to fit in the wind tunnel of the aeroacoustic test bench. This analytical approach provided a good correlation with experimental data (Monthéard et al. 2012). The cavity with the respective dimensions: 30 mm width, 27 mm length and 27 mm depth, resulted in the highest aeroacoustic noise over a wider range of Mach numbers. The East and Rossiter formula can only predict the main resonance frequency of the noise emission as a function of the cavity geometry, but today the actual sound level can only be obtained experi-mentally. Some intensive Computational AeroAcoustics (CAA) simulations are currently in progress, especially
based on Large Eddy Simulations (LES), but the computed acoustic level is always several dB under the measured one. It remains one of the main challenges of aeroacoustics and CAA research. Preliminary measurements reported in Monthéard et al. (2012) showed that the dominant acoustic tone produced by this device is situated around 2,300 Hz, with a sound pressure level over 152 dB (Figure 2).
Experimental Setup
Experiments have been performed in the aeroacoustic test bench “B2A wind tunnel” of ONERA Toulouse. This 4-meter long stainless steel tube of cross-section 50 mm x 50 mm is equipped with a quasi-anechoic outlet, to limit the amplitude of reflected acoustic waves (Figure 3). The transducer has been flush-mounted in the wind tunnel and submitted to a grazing flow ranging from Mach 0.3 up to Mach 0.6. The AC voltage has been measured in an open-circuit or across a variable resistor directly con-nected to the piezoelectric membrane.
0 2000 4000 6000 8000 10000 12000 80 90 100 110 120 130 140 150 160 Frequency (Hz) Amplitude (dB SPL) Mach 0.3 Mach 0.4 Mach 0.5
Figure 2: Generated acoustic spectra at different airflow speeds (Mach 0.3 to Mach 0.5).
(a) (b)
Figure 1: Proposed aeroacoustic transducer: schematic of a rectangular cavity of length L and depth D (a) and fabricated aeroacoustic energy harvester with the piezoelectric membrane at its bottom (b).
Voltage and Power Measurements
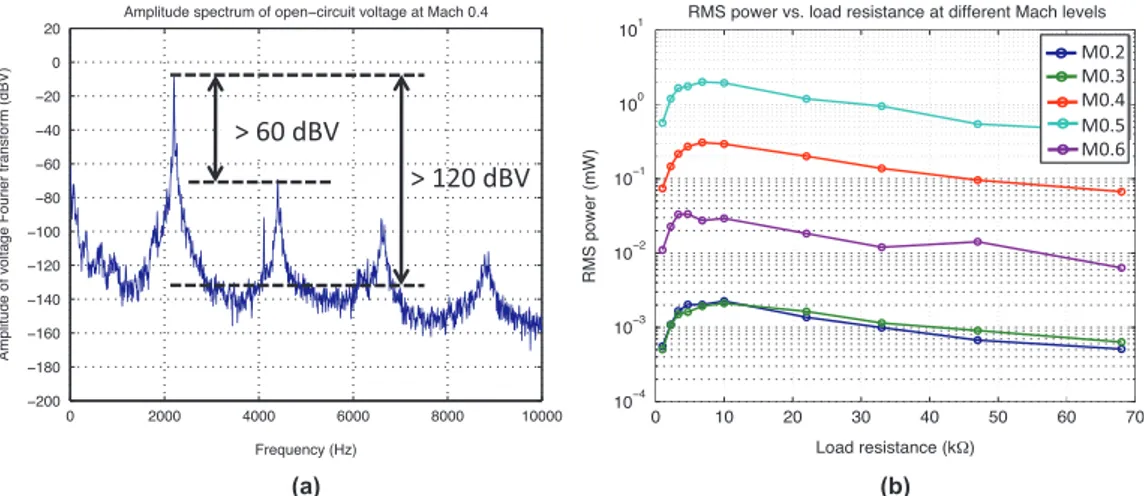
The waveform of the open-circuit voltage across the piezoelectric membrane, resulting from this generated aeroacoustic noise for a Mach 0.5 airflow speed, exhibits a fairly clean sine shape, modulated by noise of much lower amplitude. The corresponding amplitude spectrum of Figure 4(a) shows that the dominant tone is more than 60 dB over the next harmonic, and about 120 dB over the noise floor.
Figure 4(b) shows the evolution of the RMS power dissipated in the load resistor with respect to the load value, for different airflow speeds. It can be seen that this energy harvester is able to deliver up to 2 mW AC power at Mach 0.5, the corresponding voltage amplitude reach-ing 8 V. Furthermore, the optimal load resistor value (matched load) barely varies with respect to the airflow speed. Nevertheless, the maximum output power signifi-cantly depends on the airflow speed.
So as to understand the dominant effects regarding the electrical power generation, we have summarized in Table 1 the acoustic data in the wind tunnel and the corresponding electrical power generated by the piezo-electric membrane. To obtain these data, we measured the sound level by implementing a microphone on the upper wall of the wind tunnel facing the cavity and computed the acoustic power from these experimental data by doing the approximation of a plane wave and using as a reference section the top section of the cavity (30 mm × 27 mm). As a result, the ratio Pelec/Pac
cannot be considered as the actual transduction effi-ciency. From these data, it can be first noticed that the frequency of the sound peak level (SPL) is almost the
same whatever the Mach number. Secondly, the gener-ated electrical power perfectly scales with the maxi-mum sound peak level. We can then conclude that the most important and dominant parameter is the acoustic noise level. It has to be mentioned that this experiment does not exactly reproduce the conditions of the targeted application since in this case the cavity will be in open-air configuration.
Power Management Electronics
Architecture
The power management circuit interfaces the piezoelec-tric membrane with the wireless sensor node. It comprises two main stages, an AC/DC converter and a DC/DC converter, followed by storage supercapacitors as well as regulation and protection circuitry, as depicted in Figure 5.
(a) (b)
Figure 4: Aeroacoustic measurement data for the cavity under study: amplitude spectrum of the open-circuit voltage under Mach 0.4 airflow (a) and RMS output power dissipated versus load resistor, for different airflow speeds (b). Maximum RMS power is 2 µW at Mach 0.2 and 0.3, 30 µW at Mach 0.6, 300 µW at Mach0.4 and 2 mW at Mach 0.5.
Table 1: Acoustic noise data during the experiment in the wind tunnel. Mach # Frequency (Hz) Peak SPL (dB) Acoustic power Pac (mW) Electrical power Pelec (mW) Pelec/ Pac (%) . , . . . . NA NA NA . NA . , . . . . , ,. . . . , . . . Note: NA, not available.
When designing this power management circuit, our main objectives were firstly to maximize the extracted power and secondly, to optimize the efficiency of the circuit. Another challenge of this circuit is then to provide a regulated voltage only using supercapacitors as storage device while minimizing power consumption. Each stage of the proposed power management circuit is described in the following subsections.
AC/DC Converter
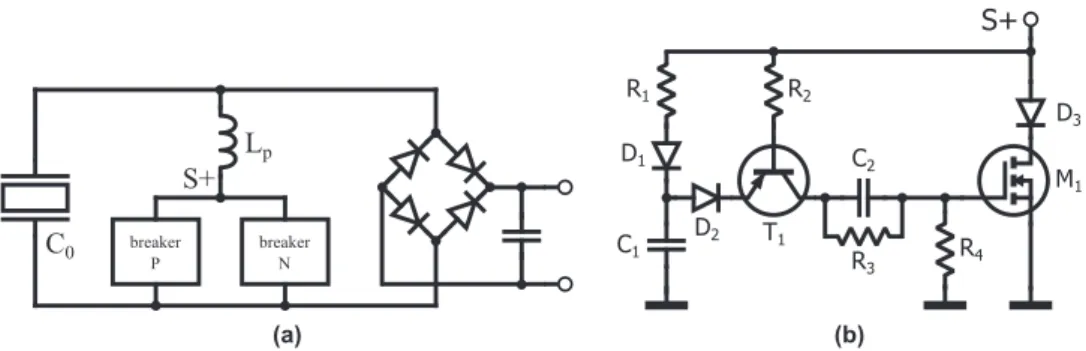
The first stage is used to rectify the AC voltage generated by the piezoelectric membrane. Reviews in piezoelectric power conditioning circuits highlight the performance of the SSHI interface (Synchronized Switch Harvesting on Inductor) (Guyomar and Lallart 2011; Szarka, Stark, and Burrow 2012), especially for pseudo-sinusoidal excita-tions. In particular, it has been shown that such an inter-face circuit, which introduces a nonlinear behavior to the energy conversion process, yields a significant improve-ment in terms of extracted power. In this work, a self-powered parallel SSHI circuit has been implemented. As described in Guyomar et al. (2007), the parallel SSHI interface circuit consists in connecting an inductor Lp
and a switch in parallel with a piezoelectric element. As the membrane displacement reaches an extremum, which translates to a zero current flow, the switch is turned on for a short time. The connection of the inductor with the intrinsic capacitance C0of the piezoelectric element form
a resonant LC network, which yields a voltage inversion so that voltage and current are set back in phase. Ideally, the switch should be on during half the LC network pseudo-period, expressed as:
TLC=2 = πpLpC0 (3)
The schematic given in Figure 6(a) describes how the parallel SSHI interface has been implemented. In parti-cular, it is shown that the switch used to connect the inductor to the piezoelectric element is made of two self-powered unipolar electronic breakers, as proposed in Lallart et al. (2008).
Inductor Sizing
Two main conflicting constraints apply to the inductor sizing. First, the inductance value Lp must be small
enough to make the period TLC much smaller than the
membrane vibration period. Secondly, the shorter TLC,
the shorter the switching process must be. As a conse-quence, this raises a constraint on how fast the switching circuit must operate. This latter constraint is especially strong as the membrane vibration frequency is high. In literature, the SSHI technique is commonly applied to low-frequency vibrating systems (a few tens Hz [Liang and Liao 2009; Mateu et al. 2011; Chen et al. 2012]). However, its application to higher frequency systems (here, a few thousands Hz) raises sizing constraints that are rarely discussed. More precisely, a practical SSHI implementation implies non-ideal switching events, affected by incompressible delays due, for example, to lag in the voltage extremum detection process. The nega-tive impact of these delays on performance decreases as the period TLC increases. Therefore, the inductor value
cannot be chosen arbitrarily big nor small. In this work, a value Lp= 1 mH has been selected to satisfy both
con-straints. Given an excitation frequency f = 2,200 Hz and a capacitance C0= 9 nF, this value leads to a ratio of 50
between TLC and the piezoelectric membrane vibration
period.
Switch Implementation
The breaker switch has been implemented using two self-powered unipolar electronic breakers, as illustrated in Figure 6(b), and proposed by the authors of this technique (Lallart et al. 2008). However, two modifications have been introduced compared to the original proposed version. Firstly, the main bipolar transistor has been replaced by a MOSFET, as suggested in Mateu et al. (2011) and Lallart and Inman (2010), in order to reduce the amount of energy needed for each switching. Thus, resistor R4 has been
added to discharge the gate of transistor M1. Secondly,
the passive network composed of R3-C2 has been added,
protecting the MOSFET gate against possible overvoltage conditions. Indeed, this network acts as a high-pass filter through which only the pulse part of the gate control signal spans, whereas the slower components in this sig-nal are highly attenuated. Thereby, carefully selecting the value of these components allows a significant reduction of the peak voltage applied to transistor M1while
improv-ing its dynamic behavior (details are given in Monthéard [2014]). In particular, the value of C2 sets boundaries on
the input AC voltage range that may be applied to the SSHI stage.
The circuit has been realized using discrete compo-nents whose values are given in Table 2. Under a purely sinusoidal excitation at 2,230 Hz, this circuit improves power extraction by a factor of 3–5 compared to a stan-dard diode bridge rectifier. When applied to the aeroa-coustic transducer mounted in the wind tunnel, it has been experimentally verified that the proposed SSHI cir-cuit allows doubling the output power (see Figure 11 hereafter). However, this circuit also yields a fourfold increase of the effective output impedance. Generally speaking, this translates to superior constraints regarding the design of the DC/DC converter, as detailed in the following subsection. In particular, it implies to deal with higher voltages, which may be favorable in
conditions where the piezoelectric membrane naturally generates low voltages. Nevertheless, this may be disadvantageous if the voltage at the output of the SSHI circuit reaches high values, as it raises requirements when selecting the components for the DC/DC converter as well as for the SSHI stage itself. For instance, these requirements may include capacitors, diodes and transis-tors breakdown voltages, as well as operating voltage ranges of integrated circuits.
DC/DC Converter
Input Impedance
The input impedance of the DC/DC converter must be controlled so as to match the output impedance of the preceding stage, in order to achieve maximum power transfer from the energy harvester. As stated previously, the optimal load varies very little with the airflow speed, which allows using a fixed input impedance topology. Therefore, it has been chosen to implement a buck-boost converter operating in discontinuous conduction mode, as proposed in Kasyap et al. (2002), Lefeuvre et al. (2007) and Kong et al. (2010).
The DC/DC converter has been designed to deal with an input power in the milliwatt range and to achieve an input impedance of some tens of kΩ. Figure 7(a) shows the schematic of the proposed buck-boost converter and Table 3 provides the components values. A low-power oscillator is used to drive M1 switch. Whereas in Kong
et al. (2010) the oscillator is powered by the battery con-nected at the output, in this case it is concon-nected at the input and must be self-starting, since the output is used to charge supercapacitors and therefore Vout is 0 V at
startup. A very low quiescent current LDO regulator (Texas Instruments TPS70925) connected at the converter input pins provides a stable 2.5 V power supply (VLDO) to
the oscillator circuit. Although this solution causes
Table 2: Components values in the SSHI breaker.
R kΩ R kΩ R . MΩ R . MΩ C pF C pF D, D, D BATS T BCC (BC) M BSS (BSS)
Note: References in parentheses apply to the negative side breaker.
(a) (b)
additional power loss, it avoids undesirable deviations of the oscillator characteristics caused by input voltage var-iations. Moreover, it protects the oscillator circuit from overvoltage on its supply pins.
In this configuration, the input impedance Zincan be
made independent of the output current, such that: Zin=
2Lfs
δ2 (4)
where fsis the switching frequency, L the inductor value
and δ is the duty cycle.
Considering the expression of the input impedance given by equation (2), the selection of a rather large inductance allows relaxing the constraints regarding the ratio fs/δ2, which governs the oscillator speed. As a
consequence, it reduces the power overhead required to drive the switch, thus maximizing the converter overall efficiency.
Oscillator Circuit
The control signal (Vcmd) applied to the gate of transistor
M1 is generated by an oscillator based on an astable comparator circuit, as shown in Figure 7(b). Such a topol-ogy allows adjusting the duty cycle while consuming very low power, as long as the oscillation frequency is kept low. The duty cycle (thus, the converter input impedance) can be controlled through the potentiometer r. Power consumption has been minimized by using a comparator circuit with very low quiescent current (IQ= 0.8 μA typ.),
yet sufficiently short propagation delays (tp= 6 μs). The
latter feature is desirable to achieve very low duty cycle, and then to increase the maximum achievable input impedance. Finally, the diode D being blocked most of the time, it has been chosen with low reverse current.
Assuming r<<R, the oscillating frequency fsand the
duty cycle δ are expressed according to the following equations: fs# 1 RCln 2ð Þ (5) δ#r R (6)
Experimental testing led to several adjustments in the oscil-lator design, which has been eventually set to oscillate at about 400 Hz, while its current consumption is below 12 μA.
Efficiency
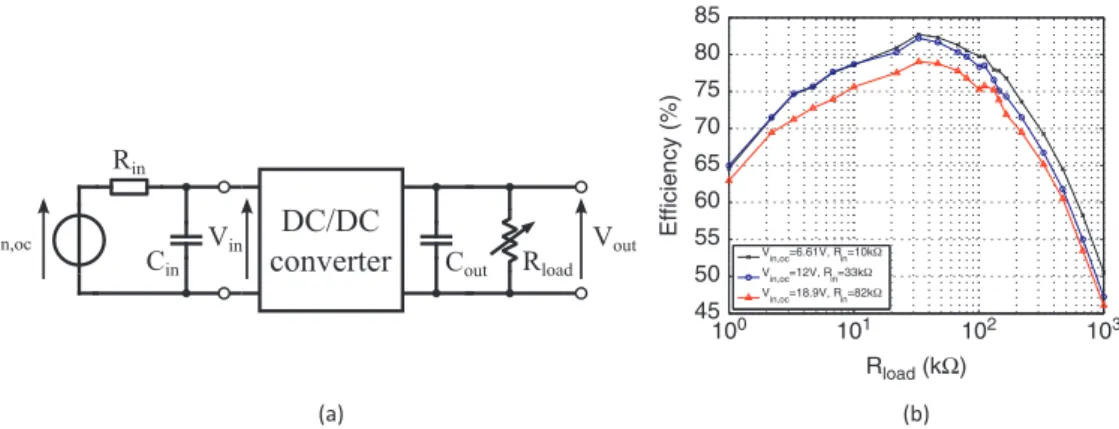
The DC/DC converter has been characterized using the test circuit shown in Figure 8(a). Input and output capa-citors are set to 10 μF. Efficiency has been evaluated under various source parameters in terms of input vol-tage (Vin,oc) and input resistance (Rin), whereas the load
connected to the output has been swept over a wide range of values. The graph of Figure 8(b) shows measure-ment results of the converter efficiency for an identical output power of 1 mW, yet with varying input conditions. Efficiency reaches up to 83 % and is over 70 % over a wide range of load currents. It is worth mentioning that for a maximum output power around 200 µW, the effi-ciency is around 70 % over one decade of load currents.
Energy Storage and Additional Circuitry
The output of the DC/DC converter is connected to an energy storage stage as well as additional protection circuitry, as described in Figure 9(a).
(a) (b)
Figure 7: Schematic of the buck-boost converter (a) and of the astable oscillator (b).
Table 3: Components values in the buck-boost converter.
Cout μF
L mH r = . Ω
M Fairchild FDCN RON= mΩ, VDS,max= V
D NXP PMEGEH VF= . V (typ.), VR= V
Supercapacitors
The energy storage stage consists in two series-connected 0.5 F supercapacitors, so as to withstand the 5 V output regulated voltage. It has been sized to provide the load, namely a data logger, with the transient energy (0.5 J) needed for the initial radio communication. It also includes a charge balancing circuit consuming less than 0.5 μA.
Overvoltage Protection (OVLO)
A simple hysteresis comparator circuit is used to protect the energy storage unit against overvoltage. It is based on a low-power commercial IC (Linear Technology LTC1540, IQ = 0.3 μA) that provides its own reference voltage (Vref = 1.182 V) and consumes less than 1 μA. When the supercapacitor charge voltage reaches the value of 5 V (maximum operating voltage), the output of the compara-tor triggers on a MOS transiscompara-tor that will discharge, via a resistor, the supercapacitor until reaching the low thresh-old voltage value of 4.9 V.
Undervoltage Lock Out (UVLO)
The last stage of the energy management circuit is used to isolate the energy storage unit from the load until it reaches a sufficient voltage to properly feed that load. This function is necessary to avoid overrated current consumption caused by insufficient supply voltage, which may even cause startup failure (Boitier et al. 2013). It is also implemented with a hysteresis com-parator, based on an even lower quiescent current IC (Texas Instruments TLV3691, IQ = 75 nA) so as to further minimize power consumption.
The total current consumption of all additional out-put circuitry is plotted on Figure 9(b), as a function of the output voltage. It can be seen that it never exceeds 2.5 μA over the 0–5 V range, which is a good performance given the fact that these circuits are built using discrete off-the-shelf components.
Ultra Low-power Hysteresis Comparators
Here the authors would like to highlight a means to reduce the power consumption associated with the
(a) (b) 100 101 102 103 45 50 55 60 65 70 75 80 85 Efficiency (%) Rload (kΩ)
Figure 8: Measurement of the DC/DC converter efficiency: implemented test circuit (a) and efficiency plot under various load and input conditions with identical output power (b). The corresponding maximum output power is around 1 mW.
(a) (b) 0 1 2 3 4 5 6 7 8 0 0.5 1 1.5 2 2.5 3 3.5 Current ( µ A) Vout (V)
hysteresis comparator, which can be found as a subcir-cuit in many usual electronic functions. In the “classical” implementation shown in Figure 10(a), the feedback resistor R3is typically much larger than R1and R2,
espe-cially when the hysteresis window is narrow. The max-imum static current consumption, excluding that of the active circuit, is given by:
Is=
Vin, max
R1+ R2
(7) Minimizing the current consumption typically requires setting R3as high as possible, then determining R1and R2
according to the target threshold levels. Let us consider the case of the OVLO circuit presented above, whose thresh-olds are defined as VH= 5.0 V and VL= 4.9 V. Using the
schematic of Figure 10(a) and setting R3= 22 MΩ, one finds
R1= 440 kΩ and R2 = 132 kΩ, which yields, assuming Vin,
max = 5.0 V, a static current Is1= 8.7 μA. Such a current
value cannot be seen as negligible in a system dealing with power in the milliwatt range. Figure 10(b) shows the schematic of an alternative solution that makes use of an additional MOSFET transistor, but does not require a feed-back resistor. Following the given specifications, the high-est resistance is now R1= 22 MΩ, while R2= 6.8 MΩ and
R2b= 187 kΩ. In this configuration, the static current is
given by Is2= 0.17 μA, that is 50 times lower for the same
function, at the cost of one extra transistor. This obviously helps preserve the overall efficiency, especially in very low power management systems.
Characterization
Experiments have been carried out to validate the posi-tive impact of each stage, at an airflow speed of Mach 0.5.
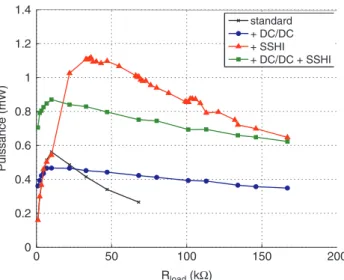
Figure 11 illustrates the obtained output power using different circuit configurations (auxiliary output circuitry, i. e. OVLO, UVLO, and the supercapacitor balancing cir-cuit, are not included). It confirms the significant improvement brought by the combination of the SSHI interface plus the DC/DC converter, compared to the standard, diode bridge rectifier interface. The implemen-tation of the SSHI stage allows doubling the maximum power from 0.56 mW to 1.12 mW and the optimum load resistance evolves from 10 kΩ to 36 kΩ, compared to a standard rectifier circuit. Introducing a DC-DC converter, despite some power losses (16 % at maximum), has the advantage to make the efficiency of the system almost independent of the load resistance. The maximum effi-ciency of this DC-DC converter is 87.3 % and is above
(a) (b)
Figure 10: Two implementations of a discrete hysteresis comparator circuit: with feedback resistor (a) and without feedback resistor.
0 50 100 150 200 0 0.2 0.4 0.6 0.8 1 1.2 1.4 Rload (kΩ) Puissance (mW) standard + DC/DC + SSHI + DC/DC + SSHI
Figure 11: Comparison of the obtained output power according to the conversion strategy at an airflow speed of Mach 0.5. Auxiliary circuitry (OVLO, UVLO and supercapacitor balancing circuit) is not included.
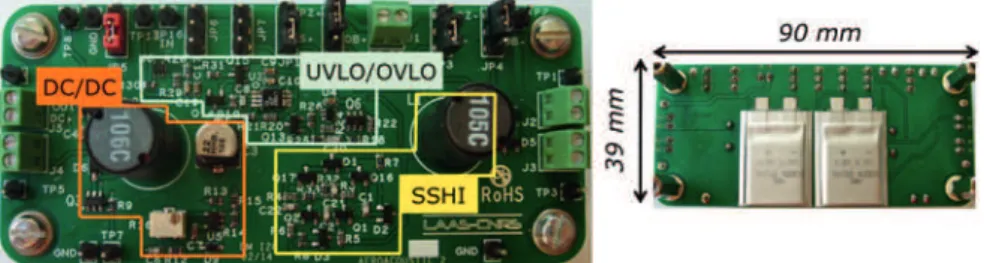
70 % over the typical range of loads and input sources of the application. When combining the SSHI and the DC-DC converter stages, the maximum output power reaches 0.87 mW (i. e. 55 % improvement compared to a standard rectifier circuit) and the output power is much less depen-dent on the load resistance. A picture of the realized printed circuit board is shown on Figure 12. The two bulky inductors are protruding, whereas the two super-capacitors are very thin and have been soldered on the rear side of the board.
Full System Experimental Validation
The full system, as depicted in Figure 5, comprises the aeroacoustic transducer, the AC/DC converter with the SSHI interface, the buck-boost DC/DC converter in dis-continuous conduction mode, connected to the superca-pacitors storage and output protection circuits. It has been used as a power supply for a wireless sensor node based on Jennic JN5148 microcontroller (Monthéard et al. 2014).
The wireless sensor node used in this work is essen-tially a datalogger featuring an IEEE802.15.4 radio inter-face. It has been programmed to sense its internal temperature and to send it over the radio link once every 6 s to a coordinator module linked to a PC. Its power stage includes an LDO regulator that draws a 0.5 µA quiescent current and delivers a 3.3 V regulated voltage. At startup, the datalogger initializes the radio communication with the coordinator, which translates to an energy consumption of 0.5 J. Then, it enters sleep mode and wakes up once every 6 s to perform a new measurement and wirelessly transmit the result. Each sense-and-transmit phase results in an energy consump-tion of 1 mJ, whereas the sleep current is about 4.4 µA. Apart from the startup phase, this datalogger consumes an average power of 181 µW.
Figure 13 shows the experimental test bench and the evolution of the power management circuit output
voltage, which powers the datalogger. The UVLO circuit has been set to enable the output when the voltage across the supercapacitors reaches about 3.9 V. Initially fully discharged, the system initializes within 42 min. From that instant on, the coordinator module starts receiving temperature data, which is then dis-played in a terminal window. A video recording of this experiment can be watched at the following website address: http://youtu.be/1kkq-5g9D_g. Because of the 0.5 J energy consumption at activation, a large capaci-tance and therefore a long charging time is needed. Actually, the capacitance value is here oversized to power the Jennic module and could be used with sys-tems exhibiting higher power surge. After a successful startup, the datalogger is running while the storage supercapacitors keep on charging. As the output voltage reaches its maximum value, the system enters regula-tion. The average charging power is about 0.8 mW.
To greatly improve the datalogger activation time and optimize energy usage, an interesting solution would be to implement an adaptive storage strategy (Monthéard et al. 2012). The basic principle is based on the use of a (super-) capacitors matrix, which arranges itself according to the global amount of energy stored. This structure shifts from an all-series to an all-parallel arrangement with discrete intermediate steps, the cycle being reversible whatever the current state. The all-series arrangement is used when the storage is empty and allows rapidly reaching the voltage threshold for proper operation and the all-parallel one helps maximize the stored energy. Such an approach, in addition to provid-ing an earlier start-up of the wireless system, also permits a better usage of the stored energy and as a result an autonomy improvement.
Conclusion and Perspectives
In this work, we have demonstrated the feasibility of a rea-listic, fully standalone system, made energy-autonomous
by means of aeroacoustic energy generation. Based on a simple rectangular cavity fitted with a piezoelectric mem-brane, the proposed solution achieves the conversion of kinetic energy provided by an airflow using aeroacoustic transduction. In this paper, the generation of electrical power in the milliwatt range is demonstrated, which makes such a device suitable for powering autonomous wireless sensor nodes. In particular, the prototype introduced in this paper generates up to 2 mW AC power at Mach 0.5 airflow. Custom energy management circuitry has been designed to efficiently deal with the generated power. The implementation of a self-powered parallel SSHI converter significantly improves power generation under a non-ideal, relatively high frequency excitation signal. Combining it with a DC/DC converter makes it possible to manage, regu-late and store the produced energy with 55 % improvement in term of peak harvested energy compared to a standard rectifier circuit.
The demonstration of aeroacoustic energy harvesting associated with a complete battery-free energy manage-ment circuit constitutes an original contribution, espe-cially in the aeronautic context. This method could be applied when other ambient energy sources (light, heat, vibrations) are weak or absent, such as for the monitoring of landing gear key parameters (for health monitoring), when landing gears are deployed during final descent and landing (hard landing monitoring). In that circum-stances, adding cavities would not raise strong issues, while aircraft speed would be in the range explored in this paper. Such an application could be considered for powering loads in the microwatt range, therefore
requir-ing reduced storage capabilities and consequently much smaller start-up time. Future work will focus on refining the transducer design so as to improve its effectiveness over a wider range of airflow speeds, as well as designing a micro-scale prototype.
Funding: This work has been partially funded by the Direction Générale de l’Armement (DGA) and by the French program “Investissements d’Avenir” (IA-2012-01-06) within the framework of CORALIE project.
References
Boitier, V., P. Durand Estèbe, R. Monthéard, M. Bafleur, and J.-M. Dilhac. 2013. “Under Voltage Lock-Out Design Rules for Proper Start-up of Energy Autonomous Systems Powered by Supercapacitors.” Journal of Physics: Conference Series 476 (012121).
Chen, Y.-Y., D. Vasic, F. Costa, W.-J. Wu, and C.-K. Lee. March 2012. “A Self-Powered Switching Circuit for Piezoelectric Energy Harvesting with Velocity Control.” European Physical Journal of
Applied Physics 57.
Dilhac, J.-M., and M. Bafleur. August 2014. “Energy Harvesting in Aeronautics for Battery-Free Wireless Sensor Networks.”
IEEE Aerospace and Electronic Systems Magazine 29:18–22. Dilhac, J.-M., M. Bafleur, J.-Y. Fourniols, C. Escriba, R. Plana,
D. Dragomirescu, L. Assouère, P. Pons, H. Aubert, and C. Buchheit. 2009. “Cross-Functional Design of Wireless Sensor Networks Applied to Aircraft Health Monitoring.” Proc.
International Workshop on Structural Health Monitoring,
Stanford, USA.
East, L. May 1966. “Aerodynamically Induced Resonance in Rectangular Cavities.” Journal of Sound and Vibration 3:277–87.
(a)
(b)
Figure 13: Photograph of the experimental implementation of the wireless sensing system powered by the aeroacoustic transducer in the wind tunnel (a) and measured output voltage of the proposed power management circuit that powers the data logger (b).
(012121).
Chen, Y.-Y., D. Vasic, F. Costa, W.-J. Wu, and C.-K. Lee. March 2012. “A Self-Powered Switching Circuit for Piezoelectric Energy Harvesting with Velocity Control.” European Physical Journal of
Guyomar, D., Y. Jayet, L. Petit, E. Lefeuvre, T. Monnier, C. Richard, and M. Lallart. Jul. 2007. “Synchronized Switch Harvesting Applied to Self Powered Smart Systems: Piezoactive Microgenerators for Autonomous Wireless Transmitters.”
Sensors and Actuators A: Physical 138:151–60.
Guyomar, D., and M. Lallart. 2011. “Recent Progress in Piezoelectric Conversion and Energy Harvesting Using Nonlinear Electronic Interfaces and Issues in Small Scale Implementation.” Micromachines 2:274–94.
Hernandez, R., S. Jung, and K. I. Matveev. June 2011. “Acoustic Energy Harvesting From Vortex-Induced Tonal Sound in a Baffled Pipe.”
Proceedings of the Institution of Mechanical Engineers, Part C: Journal of Mechanical Engineering Science, SAGE.
Humdinger Wind Energy. www.humdingerwind.com
Kasyap, A., J. Lim, K. Ngo, A. Kurdila, T. Nishida, M. Sheplak, and L. Cattafesta. 2002. “Energy Reclamation from a Vibrating Piezoceramic Composite Beam.” Proc. 9th International
Congress on Sound and Vibration, no. 271, Orlando, USA,
July 2002.
Kim, S.-H., C.-H. Ji, P. Galle, F. Herrault, X. Wu, J.-H. Lee, C.-A. Choi, and M. G. Allen. 2009. “An Electromagnetic Energy Scavenger From Direct Airflow.” Journal of Micromechanics and Microengineering 19 (9):094010. Kong, N., D. S. Ha, A. Erturk, and D. J. Inman. Sept. 2010.
“Resistive Impedance Matching Circuit for Piezoelectric Energy Harvesting.” Journal of Intelligent Materials
Systems and Structures 21:1293–302.
Kwuimy, C. A. K., G. Litak, M. Borowiec, and C. Nataraj. Jan. 2012. “Performance of a Piezoelectric Energy Harvester Driven by Air Flow.” Applied Physics Letters 100.
Lallart, M., and D. J. Inman. July 2010. “Low-Cost Integrable Tuning-Free Converter for Piezoelectric Energy Harvesting
Optimization.” IEEE Transactions on Power Electronics 25:1811–19.
Lallart, M., E. Lefeuvre, C. Richard, and D. Guyomar. 2008. “Self-Powered Circuit for Broadband, Multimodal Piezoelectric Vibration Control.” Sensors and Actuators A: Physical 143:377–82. Lefeuvre, E., D. Audigier, C. Richard, and D. Guyomar. Sept. 2007.
“Buck-Boost Converter for Sensorless Power Optimization of Piezoelectric Energy Harvester.” IEEE Transactions on Power
Electronics 22:2018–25.
Li, S., J. Yuan, and H. Lipson. Jan. 2011. “Ambient Wind Energy Harvesting Using Cross-Flow Fluttering.” Journal of Applied
Physics 109.
Liang, J., and W.-H. Liao. 2009. “An Improved Self-powered Switching Interface for Piezoelectric Energy Harvesting.” IEEE International
Conference on Information and Automation, pp. 945–950.
Mateu, L., L. Luhmann, H. Zessin, and P. Spies. 2011. “Modified Parallel SSHI AC-DC Converter for Piezoelectric Energy Harvesting Power Supplies.” Telecommunications Energy
Conference (INTELEC), 2011 IEEE 33rd International, pp. 1–7,
October 2011.
Matova, S., R. Elfrink, R. Vullers, and R. van Schaijk. 2010. “Harvesting Energy from Airflow with Micromachined Piezoelectric Harvester Inside a Helmholtz Resonator.”
Proceedings of PowerMEMS 2010, (Leuven, Belgium),
November–December 2010.
Mitcheson, P., E. Yeatman, G. Rao, A. Holmes, and T. Green. Sept. 2008. “Energy Harvesting From Human and Machine Motion for Wireless Electronic Devices.” Proceedings of the IEEE 96:1457–86.
Monthéard, R. 2014. “Récupération d’énergie aéroacoustique et thermique pour capteurs sans fil embarqués sur avion.” PhD thesis, Université de Toulouse (France), November 2014. Monthéard, R., C. Airiau, M. Bafleur, V. Boitier, J.-M. Dilhac,
X. Dollat, N. Nolhier, and E. Piot. Nov. 2014. “Powering a Commercial Datalogger by Energy Harvesting from Generated Aeroacoustic Noise.” Journal of Physics: Conference Series 557. Monthéard, R., M. Bafleur, V. Boitier, J.-M. Dilhac, and X. Lafontan.
2012. “Self-adaptive Switched Ultra-capacitors: A New Concept for Efficient Energy Harvesting and Storage.” Proc.
POWERMEMS 2012, Atlanta (USA), December 2–5, 2012.
Monthéard, R., S. Carbonne, M. Bafleur, V. Boitier, J.-M. Dilhac, X. Dollat, N. Nolhier, E. Piot, and C. Airiau. 2012. “Proof of Concept of Energy Harvesting from Aero Acoustic Noise.” Proceedings of PowerMEMS 2012, Atlanta, USA, December 2012. Rowley, C. W., and D. R. Williams. Jan. 2006. “Dynamics and Control
of High-Reynolds-Number Flow Over Open Cavities.” Annual
Reviews of Fluid Mechanics 38:251–76.
Szarka, G. D., B. H. Stark, and S. G. Burrow. Feb. 2012.
“Review of Power Conditioning for Kinetic Energy Harvesting Systems.” IEEE Transactions on Power Electronics
27:803–15.
Vanhecke, C., L. Assouère, A. Wang, P. Durand-Estèbe, F. Caignet, J. M. Dilhac, and M. Bafleur. 2015. “Multisource and Battery-Free Energy Harvesting Architecture for Aeronautics Applications.” IEEE Transactions on Power Electronics 30 (6):3215–27.
Hernandez, R., S. Jung, and K. I. Matveev. June 2011. “Acoustic Energy Harvesting From Vortex-Induced Tonal Sound in a Baffled Pipe.”
Proceedings of the Institution of Mechanical Engineers, Part C: Journal of Mechanical Engineering Science, SAGE.
Journal of Mechanical Engineering Science, SAGE Journal of Mechanical Engineering Science, SAGE
Kwuimy, C. A. K., G. Litak, M. Borowiec, and C. Nataraj. Jan. 2012. “Performance of a Piezoelectric Energy Harvester Driven by Air Flow.” Applied Physics Letters 100.
Li, S., J. Yuan, and H. Lipson. Jan. 2011. “Ambient Wind Energy Harvesting Using Cross-Flow Fluttering.” Journal of Applied