VALIDATED EXTRACTION OF GAIT EVENTS FROM
3D ACCELEROMETER RECORDINGS
Mohamed Boutaayamou
1, 2, Cédric Schwartz
1, Julien Stamatakis
3, 4, Vincent Denoël
1,
Didier Maquet
5, Bénédicte Forthomme
1, Jean-Louis Croisier
1, Benoît Macq
3,
Jacques G. Verly
2, Gaëtan Garraux
4, 6, and Olivier Brüls
11
Laboratory of Human Motion Analysis, University of Liège (ULg), Liège, Belgium
2
INTELSIG Laboratory, Dept. of Electrical Engineering and Computer Science, ULg, Liège, Belgium
3
Institute of Information and Communication Technologies, Electronics and Applied Mathematics,
Université Catholique de Louvain, Louvain-La-Neuve, Belgium
4
Movere Group, Cyclotron Research Center, ULg, Liège, Belgium
5
Department of Motricity Sciences, ULg, Liège, Belgium
6
Department of Neurology, University Hospital Center, Liège, Belgium
Abstract − This work is part of a project that deals withthe three-dimensional (3D) analysis of normal and pathological gaits based on a newly developed system for
clinical applications, using low-cost wireless
accelerometers and a signal processing algorithm. This system automatically extracts relevant gait events such as the heel strikes (HS) and the toe-offs (TO), which characterize the stance and the swing phases of walking. The performances of the low-cost accelerometer hardware and related algorithm have been compared to those obtained by a kinematic 3D analysis system and a force plate, used as gold standard methods. The HS and TO times obtained from the gait data of 7 healthy volunteers (147 trials) have been found to be (mean ± standard deviation) 0.42±7.92 ms and 3.11±10.08 ms later than those determined by the force plate, respectively. The experimental results demonstrate that the new hardware and associated algorithm constitute an effective low-cost gait analysis system, which could thus be used for the assessment of mobility in routine clinical practice.
Keywords ‒ Accelerometers; walking; gait events; heel strike; toe-off; 3D; motion analysis.
1. INTRODUCTION
Recent advances in micro-electromechanical systems (MEMS) technology have led to the development of low-cost and miniaturized sensor devices that may be used to perform human motion analysis. Thanks to their small size and low power consumption, these devices have the advantage of being easily worn and being autonomous during human motion monitoring. Among these MEMS-based sensors, accelerometers have been considered to handle the analysis of human motion [1-3]. Numerous applications related to animation (e.g. movies, video games) may benefit from this technology. For example, the physical
movement or facial expressions of an actor equipped with this technology can be recorded and used to animate a digital avatar such that it mimics the actor’s actions [4]. Moreover, accelerometry offers a practical method of objectively assessing the ambulatory measurement of human gait in the field of rehabilitation [1‒3,5].
This work is part of a project that deals with the 3D analysis of normal and pathological human motion based on a newly developed system for clinical applications that uses low-cost wireless accelerometers and signal processing. Neurologists specialized in human motion disorders are indeed very interested in the development of innovative, quantitative techniques, and their possible use in clinical practice, e.g. in the diagnostic and analysis of Parkinson’s disease.
Our research aims at the extraction of gait parameters to contribute to the understanding of these motion disorders, as well as to the critical analysis and development of new therapeutic strategies. For this purpose, a low-cost, wireless, 3-axis accelerometer-based device has been developed to record gait acceleration signals [6]. Besides, we have developed a signal-processing algorithm capable of automatically extracting, from these signals, on a stride-by-stride basis, gait events such as the heel strikes (HS) and the toe-offs (TO), which characterize the stance and the swing phases of walking [7].
In this paper, we present the developed hardware system and related algorithm to automatically perform gait analysis. Relevant gait events are detected from the gait data of 7 healthy volunteers (147 trials). The HS and TO times are then validated against the results provided by gold standard methods. The manuscript is organized as follows. The methods and the materials used to record and to automatically analyze gait data are described in Sect. 2. The obtained results are presented in Sect. 3. The conclusions and future work are presented in Sect. 4.
2. METHODS AND MATERIALS 2.1. Subjects
Seven healthy volunteers ((mean ± standard deviation) age = 27±2.6 years; height = 181±7 cm; weight = 78±9 kg) were involved in this 3D gait analysis. All of them gave informed consent. During the tests, they were asked to walk on a 12-meter long track, at their preferred, self-selected usual speed. The duration of a single gait test was 60 s. Subjects wore their own shoes. All of the walking tests were performed at the Laboratory of Human Motion Analysis (LAMH) of the University of Liège.
2.2. Hardware system
The wireless, 3-axis accelerometer-based hardware system includes: 3-axis accelerometers, a transmitter module and a receiver module (Fig. 1) [6]. This system can measure accelerations up to ±13 g (1 g = 9.81 m/s²) along its three sensitive axes: x (horizontal), y (transverse), and z (vertical) (Fig. 2). Accelerometers were placed directly on the heel and the forefoot of each subject’s feet: a total of four accelerometers were installed (Fig. 2). Accelerations were recorded at the sampling frequency of 200 Hz.
2.3. Force plate and kinematic 3D analysis system
The force plate and the kinematic 3D analysis system (Codamotion) of LAMH were chosen as gold standard methods for validating the gait events of interest (Fig. 3). This force plate was located at the middle of the 12 m long track such that the subjects could walk normally without “aiming” [5] before reaching the force plate. During each gait test, we collected simultaneous vertical ground reaction data at 1,000 Hz, and kinematic marker position data at 400 Hz, this from the heel (calcaneus), 1st metatarsal and toe (hallux) markers. Note that the locations of the heel and toe markers were the same as those of the heel and toe accelerometers. HS was defined as being the first frame where the vertical force rose above 5% bodyweight, and TO was defined as being the first frame where the vertical force dropped below this threshold.
2.4. Synchronization of data
In order to validate the considered gait events, the synchronization of the acquired accelerations with the force data was performed offline. The method used consists in matching the time of the peak of an initial vertical ground reaction to the time of the corresponding positive peak of the vertical heel acceleration. Moreover, the acceleration data were upsampled in order to match the sampling frequency of the force data (1,000 Hz) and to increase the accuracy of the synchronization.
Fig. 1. Wireless, 3-axis accelerometer-based hardware
system: (a) 3-axis accelerometers, (b) transmitter module, (c) receiver module.
Fig. 2. Position of the sensors (the 3-axis accelerometers
and the active markers).
(a)
(b)
(c)
Fig. 3. Laboratory of Human Motion Analysis (LAMH) of
the University of Liège and equipments used for gold standard methods: (a) 3D Codamotion active markers, (b) 3D Codamotion unit, (c) force plate.
2.5. Automatic gait event detection
In order to increase the accuracy of the detection of the gait events of interest, i.e. HS and TO, a new signal-processing algorithm was developed.
49.4 49.6 49.8 50 50.2 50.4 50.6 50.8 51 -4 -2 0 2 4 6 8 10 12 Time [s] A c ce le ra ti o n [ g ] - F o rc e [x 1 0 0 N ]
[Force plate] zForce
[Force plate] HS and TO threshold
HS
HS
Heel flat zone
[Accelerometer] zHeel 49.8 50 50.2 50.4 50.6 50.8 51 -10 -5 0 5 10 15 Time [s] A c c e le ra ti o n [ g ] - F o rc e [ x 1 0 0 N ] - P o s it io n [ x 1 0 m m ]
[Force plate] zForce
[Codamotion] zToe position
t2 TO=(t1+t2)/ 2 [Accelerometer] zToe
t1 Toe flat zone
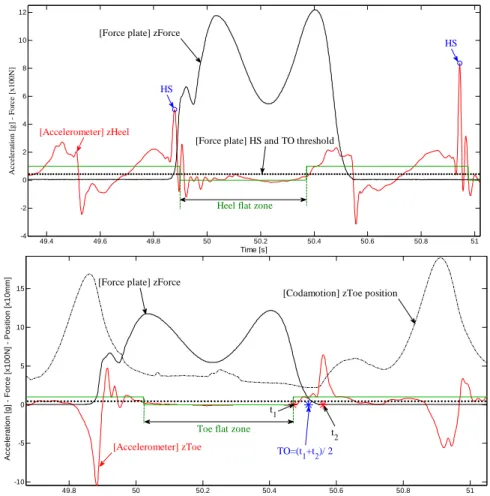
Fig. 4. Principle and illustration of the automatic detection of the gait events, i.e. (top) HS and (bottom) TO, using our
signal-processing algorithm.
This algorithm first detects the heel flat zones and the toe flat zones associated with accelerations recorded by heel and toe accelerometers, respectively. The considered gait events are then detected as follows:
1. HS is detected as the time of occurrence of the nearest main peak of the vertical heel acceleration (i.e. the z-axis signal of the heel accelerometer) before the beginning of the heel flat zone (Fig. 4(up)).
2. TO is detected as the middle of the time interval surrounded by the end of the toe flat zone and the first main positive peak of the vertical toe acceleration (i.e. the z-axis signal of the toe accelerometer) (Fig. 4(bottom)).
3. RESULTS AND DISCUSSION
The developed signal-processing algorithm was successfully employed to automatically extract the gait events from the recorded walking accelerations of 7 healthy volunteers performing 147 trials. The HS (TO) times measured by the force plate and the 3-axis accelerometer-based hardware system are denoted HSforce (TOforce) and HSaccel (TOaccel), respectively. The true errors were calculated for the HS and TO times as determined by the force plate and the
accelerometers, i.e. HSforce ‒ HSaccel and TOforce ‒ TOaccel, respectively.
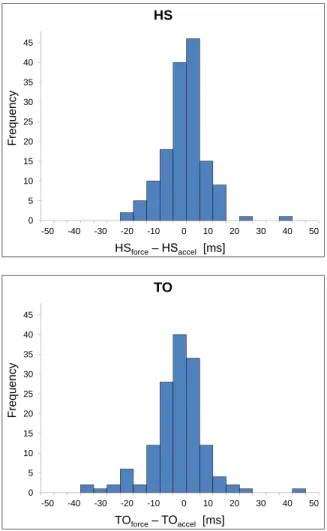
The distributions of these true errors are shown as histograms in Figs. 5(top) and 5(bottom), respectively. It can be seen that these distributions are close to normal distributions.
The true error HSforce ‒ HSaccel is characterized by a mean value of ‒ 0.42 ms and a standard deviation of 7.92 ms while the true error TOforce ‒ TOaccel is characterized by a mean value of ‒ 3.11 ms and a standard deviation of 10.08 ms.
In order to investigate an eventual effect of the synchronization method used (Sect. 2.4.) on the accuracy of the measured HSaccel and TOaccel times, the difference between (TO ‒ HS)force and (TO ‒ HS)accel, which is insensitive to the synchronization procedure, is calculated and represented as a histogram in Fig. 6. The distribution of this difference is close to a normal distribution with a mean of ‒ 2.68 ms and a standard deviation of 10.08 ms. The similarity with Figs. 5(top) and 5(bottom) shows that this synchronization method had a very small effect (within one frame) on the accuracy of the results.
0 5 10 15 20 25 30 35 40 45 -50 -40 -30 -20 -10 0 10 20 30 40 50 Fr e qu en c y HSforce‒ HSaccel [ms] HS 0 5 10 15 20 25 30 35 40 45 -50 -40 -30 -20 -10 0 10 20 30 40 50 Fr e qu en c y TOforce‒ TOaccel [ms] TO
Fig. 5. Distribution of the differences between the HS (top)
and TO (bottom) times as determined by the force plate and the 3-axis accelerometer-based hardware system.
0 5 10 15 20 25 30 35 40 45 -50 -40 -30 -20 -10 0 10 20 30 40 50 Fr e qu en c y
(TO ‒ HS)force‒ (TO ‒ HS)accel[ms]
Fig. 6. Distribution of the difference between (TO ‒ HS)force
and (TO ‒ HS)accel showing the very small effect of the synchronization method on the accuracy of the measured HSaccel and TOaccel times.
These results demonstrate the ability of the 3-axis accelerometer-based hardware system and its associated signal-processing algorithm to accurately measure HS and TO times (within one or two frames of the times obtained from the force plate) obtained from this normal gait analysis. The hardware system and related algorithm could therefore prove to be a useful tool for the assessment of mobility in routine clinical practice.
4. CONCLUSIONS AND FUTURE WORK
We presented a new low-cost, wireless, 3-axis accelerometer-based system and a signal-processing algorithm that were successfully used to automatically extract relevant gait events to accurately determine the stance and the swing phases of walking.
We carried out the first step of the validation of the developed hardware and algorithm against a kinematic 3D analysis system and a force plate, used as gold standard methods. This validation was performed by considering extracted HS and TO times from the gait data of 7 healthy volunteers (147 trials). The comparison showed an excellent agreement.
In future research, we will address the validation of the toe strike (TS) and the heel-off (HO) times and we will further improve the signal-processing algorithm used here.
12. REFERENCES
[1] J. R. W. Morris. Accelerometry ‒ a technique for the measurement of human body movements. J Biomechanics, 6, pp. 729-736, 1973.
[2] A. L. Evans, G. Duncan, W. Gilchrist. Recording accelerations in body movements. Medical & Biological Engineering & Computing, 29, pp. 102-104, 1991.
[3] A. Godfrey, R. Conway, D. Meagher, and G. ÓLaighin. Direct measurement of human movement by accelerometry.
Medical Engineering & Physics, 30, pp. 1364–1386, 2008.
[4] R. Slyper, J. K. Hodgins. Action Capture with Accelerometers. ACM SIGGRAPH / Eurographics Symposium on Computer Animation, pp. 193-199, 2008.
[5] M. Whittle. Gait Analysis: an Introduction. Butterworth-Heinemann, Oxford, UK, 1991.
[6] J. Stamatakis. Movement assessment in patients with cerebral motor disorders using accelerometers. PhD Thesis, Univ. Catholique de Louvain, Belgium, 2012.
[7] M. Boutaayamou, C. Schwartz, O. Bruls, V. Denoël, M. Demonceau, D. Maquet, B. Forthomme, J.-L Croisier, G. Garraux, J. Verly. 3D Analysis of Normal and Pathological Gait Based on Low-Cost Wireless Accelerometers.