HAL Id: hal-00772143
https://hal.archives-ouvertes.fr/hal-00772143
Submitted on 11 Jan 2021
HAL is a multi-disciplinary open access
archive for the deposit and dissemination of
sci-entific research documents, whether they are
pub-lished or not. The documents may come from
teaching and research institutions in France or
abroad, or from public or private research centers.
L’archive ouverte pluridisciplinaire HAL, est
destinée au dépôt et à la diffusion de documents
scientifiques de niveau recherche, publiés ou non,
émanant des établissements d’enseignement et de
recherche français ou étrangers, des laboratoires
publics ou privés.
The oceanic zone of convergence on the eastern edge of
the Pacific warm pool: A synthesis of results and
implications for El Niño-Southern Oscillation and
biogeochemical phenomena
Joel Picaut, Mansour Ioualalen, Thierry Delcroix, François Masia, Ragu
Murtugudde, Jérome Vialard
To cite this version:
Joel Picaut, Mansour Ioualalen, Thierry Delcroix, François Masia, Ragu Murtugudde, et al.. The
oceanic zone of convergence on the eastern edge of the Pacific warm pool: A synthesis of results and
implications for El Niño-Southern Oscillation and biogeochemical phenomena. Journal of Geophysical
Research, American Geophysical Union, 2001, 106, pp.2363-2386. �10.1029/2000JC900141�.
�hal-00772143�
JOURNAL OF GEOPHYSICAL RESEARCH, VOL. 106, NO. C2, PAGES 2363-2386, FEBRUARY 15, 2001
The oceanic zone of convergence on the eastern edge of
the Pacific warm pool' A synthesis of results and
implications for E1 Nifio-Southern Oscillation and
biogeochemical phenomena
Joel Picaut,
• Mansour
Ioualalen,
2 Thierry Delcroix,
Ragu Murtugudde,
3 and J6rome
Vialard
4
2 Frangois
Masia,
2
Abstract.
The eastern edge of the western Pacific warm pool corresponds
to the
separation
between the warm, rainfall-induced
low-salinity waters of the warm pool
and the cold, high-salinity upwelled
waters of the cold tongue in the central-eastern
equatorial
Pacific. Although not well defined
in sea surface
temperature (SST),
this eastern edge is characterized
by a sharp salinity front that is trapped to the
equator. Several studies, using numerous
in situ and satellite data and three classes
of ocean models, indicate that this front is the result of the zonal convergence of the western and central Pacific water masses into the eastern edge of the warm
pool. This occurs through the frequent encounter of the eastward jets in the
warm pool and the westward South Equatorial Current in the cold tongue. The
notable and alternate variations of these wind-driven zonal currents are trapped to
the equator and are chiefly interannual in the vicinity of the edge. Consequently,
the Eastern Warm Pool Convergence
Zone (EWPCZ) is subject to eastward
or
westward displacements
over several thousands of kilometers along the equatorial
band, in synchrony
with the warm phase (El Nifio) and the cold phase (La Nifia)
of the E1 Nifio-Southern
Oscillation
(ENSO) phenomenon.
Zonal advection
appears
to be the predominant mechanism for the ENSO displacements
of the eastern
edge of the warm and flesh pool. The existence of the EWPCZ and its ENSO
displacements have significant effects on the physics of the tropical Pacific and on
related biogeochemical
phenomena. The EWPCZ is important for the formation of
the barrier layer in the isothermal layer of the warm pool. Its zonal displacements control SST in the central equatorial Pacific, which in turn drives the surface winds
and atmospheric
convection
(and vice versa). Hence the central equatorial
Pacific is
a key region for ENSO coupled interactions. All these findings from several studies
and additional analyses lead to a revision of the delayed action oscillator theory of ENSO. The existence of the EWPCZ and its zonal displacements are also reasons for the ENSO variations in production and exchange of CO2 with the atmosphere over the equatorial Pacific. The zone of one-dimensional convergence seems to congregate the world's most important tuna fishery in the western equatorial Pacific, and its displacements are likely the reason for this fishery to move zonally over thousands of kilometers in phase with ENSO.
X lnstitut de Recherche pour le Ddveloppement (IRD),
Laboratoire d'Etudes en G•ophysique et Oc•anographie Spa-
tiale, Toulouse, France.
•'IRD, Noum•a, New-Caledonia.
aEarth System Science Interdisciplinary Center, Univer-
sity of Maryland, College Park, Maryland.
4European Centre for Medium-range Weather Forecasts,
Reading, England, United Kingdom.
Copyright 2001 by the American Geophysical Union.
Paper number 2000JC900141.
0148-0227/01/2000JC900141 $09.00
1. Introduction
E1 Nifio has been historically identified as the arrival of warm water in the eastern equatorial Pacific and along the coast of Ecuador and Peru. However, it is
through the seminal work of Bjerknes [19691 that the E1 Nifio oceanic signal was related to the Indo-Pacific
atmospheric fluctuation known as the Southern Oscil- lation. Consequently, the scientific community became
interested in the opposite phase named La Nifia [Phi- lander, 1990]. E1 Nifiø-Søuthern Oscillation (ENSO)
is now considered a coupled ocean-atmosphere system
2364 PICAUT ET AL.- OCEANIC ZONE OF CONVERGENCE AND PACIFIC WARM POOL
,
Southern Oscillation Index 2 0 -2 -4 -6 I I I I I ... '::::"::'%i•i:i:•:;:.•::::•:;:.-; :-...•...__ ...•-•' _•7., _ . ... - -. ... .:..-. - . .:.'.7. •'"'":'.:...:...!'!?:.::':'" ß ' .... :•...•?,•.'•.:' '••-.d'•-:•-.•. :Z;'"" ':' ... •:•:::'•:':::•:?• ===================== '•••-• • ... •,;•.z:.,'..-: ... ::..-.•:•:•:•:•-: .•.• ... ... . ... ...i•.•Z•;•:•:.::•:::.g•g•::? .... :..-• .... .•.
:•..:.'...
...
•....•,•,..•:,.•:•:;•:•:•...•'
.•?•:•
...
.
...
• • -
.... ,:•:g:•½• ... : ... •__• ... ...- .•••g.•.-•-.--•-••••• 140øESouthern Oscillation Index 2 0 -2 -4
....
! _•1
I
...I
. ...-6
I I I I I 180' 140øW 100øW 140øE 180 ø 140øW 100øW
Sea Surface Temperature Sea Surface Salinity
Southern Oscillation Index 2 0 -2 -4 -6 .... ß ... '--:::•' ' '. ... '":•.•:•-•.--,•t. ----:'•..•:=•:•::::::;:•::•-:•:.::.. • ..f" L - •:•..•.:z:.::•. .... '"•..•;;..•... ... :::::-.-.-•-•.•-•-½'•'•::•::•.•-".: ':•-:::t•;•z•:..•....;'::-.- . ....:•?.:•?• '"'•'••••• •:..•..•.•.•...•.•.•.••.•..:•..•::,•:.. •;:½.. s•:•:•.';q•:;•'*:•.'..: '••:•:::•: •:':•:::•....:.... :•;•f•:*•E'T•':• .. '•...•i•.•:'..•...;"•:•. •.. •,:•:::,.:• ,..-•.•...•.:•::•::•::•;:-::.:?-• :..•:•*•:•,:•?•,•:•.•:•."•"W2-•½•?•i;•:•':•::: '" ,-• ... :...:.•,•,•.--:-.,.•..•.•:;... -•,. •-•:.,••,•••••.:,•.•::•::•4•:•-•:•::.:.:•.:..::....::.-::.: -,,•-•,•-::•,:::•:•..•:•::.. :.:.'.'•"'"•'";•:, •.•?•;...``•;;•z..•::'...•:•::::•c;•t•2...•.:..:•i•;:.•::•::.:.•:::...•q.•;•..:• "•.•.:•-'.'•. ... '*"•.' ... ß •j:•½•:*•:•*•*•:•:;72•.•.•::•:•:::•.•:.•:-:.• -•*• ... •- .• ...:•:z• .•.:...
140OE 180 • 140oW 100oW
Zonel Wind Stress
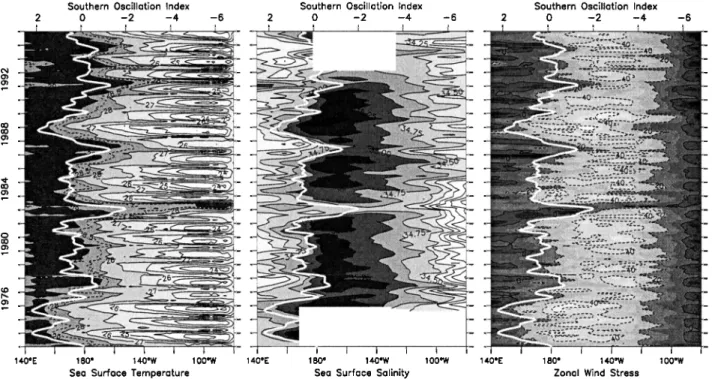
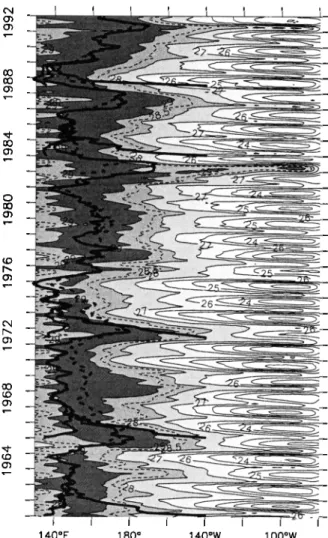
Figure 1. Longitude-time
distribution
of 4øN-4øS
averaged
(left panel) SST, (middle
panel) sea
surface salinity, and (right panel) pseudo zonal pseudo wind stress. Superimposed as a white thick
line is the Southern
Oscillation
Index. Contours
are IøC, 0.25 psu, and 20 m • s -• respectively.
composed of a warm phase (El Nifio) and a cold phase (La Nifia), which repeat irregularly every 2-7 years. As
shown by the variations of the Southern Oscillation In-
dex (SOI, Figure 1), the mean state does
not stay for
long. This mean state is characterized by a piling up ofwarm water in the western equatorial Pacific (the warm pool) by the South Equatorial Current (SEC) forced
by the trade winds. Because of Ekman divergence, the trade winds generate an equatorial upwelling in the
eastern part of the basin (the cold tongue). At the sur-
face, the temperature gradient between the cold tongue and the warm pool drives the trade winds, completing
the loop of the coupled ocean-atmosphere system. Un- derneath, the accumulation of warm water in the west
and the upwelling in the east results in a thermocline that is deeper in the west and shallower in the east
[Lemasson and Piton, 1968]. During a La Nifia, which
is to some extent an intensification of the mean state,
the trade winds are stronger and result in an increase
of the SEC and thus in a warm pool pushed toward
the Philippine coasts. They also result in a stronger upwelling in the east, and overall, in a greater slope of the thermocline along the equator. During an E1 Nifio, the trade winds relax or change direction with the oc-
currence of westerly wind bursts in the western equa-
torial Pacific. The accumulation of water in the warm pool is no longer balanced by the easterly wind stress. The warm water spreads toward the east in a surge led
by downwelling equatorial Kelvin waves [Wyrtki, 1975].
The warm pool migrates eastward, while the equato- rial Kelvin waves, on their fast way toward the east,
push down the thermocline. In •2 months, these waves reach the eastern part of the equatorial basin and coun- teract the equatorial upwelling. The spreading of water masses to the center of the basin, as well as the reduced
or annihilated upwelling in the east, fiattens the slope of the thermocline along the equator [Wyrtki, 1984]. Con- sequently, the ENSO cycle appears as a seesaw of the
thermocline along the equator accompanied by trans- fer of water mass and heat along the equator, which
strongly affect the cold tongue and the warm pool. In a study on the movements of the warm pool from satellite measurements, Ho et al. [1995] showed that it expands seasonally in the meridional direction roughly from 10 ø to 20 ø of latitude. Schneider et al. [1996] explained these meridional migrations by the seasonal variability of the net surface heat flux in each hemi- sphere. Interestingly, Ho et al. [1995] found that the
dominant migration of the warm pool is on its eastern
edge, in the zonal direction, within 7øN-7øS, and solely
on the ENSO timescale. This was also noted by Fu et
al. [1986], Lukas and Webster
[1992]
and Picaut and
Delcroix
[1995]. Picaut and Delcroix
[1995]
showed
a
striking resemblance between the phase of the SOI and
the significant
displacements
(about 35 ø of longitude)
of the eastern edge of the warm pool within 4øN-4øS,
over the 1950-1994 period. They also found that these
zonal displacements are barely affected by the seasonal
cycle (an order of magnitude
less
than the interannual
displacements). As shown by the superposition of the
SOI (with reverse
coordinate
and scaled
amplitude)
over
PICAUT ET AL.: OCEANIC ZONE OF CONVERGENCE AND PACIFIC WARM POOL 2365
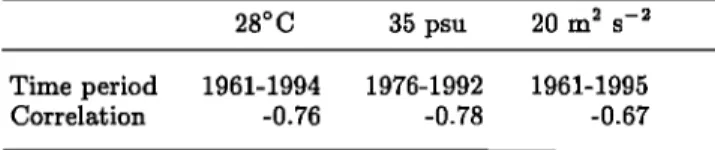
Table 1. Correlation (Above the 95% Significance Level) Between the SOI and the Location of the Eastern
Warm Pool Convergence Zone As defined by the 28øC,
the 35-psu Isohaline, and the 20 m 2 s -2 Zonal Pseudo
Wind Stress of Figure 1. a
28øC 35 psu 20 m 2 s -2
Time period 1961-1994 1976-1992 1961-1995
Correlation -0.76 -0.78 -0.67
aadapted from Delcroix [1998].
band (Figure 1) and the correlation coefficient of Table
1, E1 Nifio and La Nifia are clearly defined by an east-
ward and westward migration, respectively, of the east- ern edge of the warm pool. The migrations of this edge
induce SST changes in the central equatorial Pacific around the 28øC threshold required for organized con-
vection
[ Gadgil
et al., 1984;
Graham
and Barnett,
1987].
As a consequence, the convergence of winds over the Pa-
cific warm pool associated with the convection and the ascending branch of the Walker circulation is also dis-
placed
zonally [Fu et al., 1986; Delcroix,
1998]. This
results during E1 Nifio in the penetration and extentof the westerlies (associated with the East Asian win- ter monsoon and westerly wind events) into the central equatorial Pacific [Wyrtki, 1985; Kessler et al., 1995; Harrison and Larkin, 1998]. On the other hand, dur-
ing La Nifia the easterlies, associated with the trades, penetrate from the central equatorial Pacific into the
western Pacific. The movements of these zonal winds
are illustrated in Figure 1 where the SOI curve matches
quite
well
the 20 m 2 s -2 Florida
State
University
(FSU)
pseudo zonal wind stress isoline (Table 1).
In the western half of the equatorial Pacific, ENSO can therefore be seen as a zonal migration of the warm
pool. ENSO appears also as a variation of temperature
in the cold tongue. Two decades ago, it was found that
remote forcing
through equatorial
Kelvin waves
(and
the consequent effect on the shallow thermocline) is re-
sponsible for the interannual variations of SST in the
cold tongue
[e.g., Wyrtki, 1975;
McCreary,
1976]. Only
recently has it shown that the migrations of the east- ern edge of the warm pool are mainly due to zonal ad-vection [McPhaden and Picaut, 1990; Picaut and Del-
croix, 1995]. As noted above,
these zonal migrations
are clearly dominated by the interannual ENSO signal (Figure 1 and Table 1), unlike the cold tongue, which is also influenced by the seasonal signal. Hence, the in-
terannual variations of SST in the central and eastern
equatorial Pacific display very similar patterns, albeit driven mostly by different physics. During the course of
the E1 Nifio-La Nifia events the convection zone over the
warm pool and its associated precipitation follow the
zonal migration
of the eastern
edge of the warm pool,
as indicated by the movement of high reflective clouds
[Fu et al., 1986].
The heavy
rainfall
significantly
reduces
the salinity of the upper layer of the warm pool, which is
the reason why the warm pool was also named the fresh
pool [Delcroix and Picaut, 1998]. On the contrary, be-
cause of evaporation and equatorial upwelling, the cold tongue is composed of high salinity water. Recently, it was found that the water masses of these two regions
converge zonally into a well-defined salinity front [Pi- caut et al., 1996]. This convergence also leads to the formation of the barrier layer [Lukas and Lindstrb'm,
1991]
in the isothermal
layer of the warm pool [Vialard
and Delecluse, 1998b]. Nearly coinciding in location,
the zone of convergence, the salinity front, and the east- ern edge of the warm pool, all migrate zonally with the
phases of ENSO (Figure 1).
The present work was motivated by the Tropical
Ocean- Global Atmosphere (TOGA) - Coupled Ocean-
Atmosphere
Response
Experiment
(COARE) interna-
tional programme[Webster and Lukas, 1992]. Its main
purpose is to synthesize recent results and additional
analyses, which establish the existence of an oceanic zone of convergence at the eastern edge of the warm pool. Its purpose is also to discuss several of the impor- tant implications for ENSO, which have been mostly re- ported in previous studies. In addition to implying a re- vision to the delayed action oscillator theory for ENSO, the discovery of a zonal convergence zone, controlled by oceanic advection, has several implications for biogeo- chemical phenomena and consequently, tuna fisheries in the central and western Pacific, which are also re- viewed herein. The existence and ENSO displacements of the oceanic zone of convergence are presented and discussed in sections 3 and 4. This is done through the analysis of a maximum of in situ and satellite data and the output from three different types of ocean model, which are first presented in section 2. Several conse- quences of this zone of convergence on the physics of ENSO are discussed: the ENSO coupling in the central equatorial Pacific, a revision of the delayed action os- cillator theory of ENSO, and the transfer of mass and heat and ENSO memory. The amount of CO2 released into the atmosphere from the cold tongue is dictated by the size of the cold tongue, hence by the location of the zone of convergence. Similarly, the ENSO variations of
production are related to the extent of the zone of con-
vergence separating the oligotrophic water of the warm
pool from the eutrophic
water of the cold tongue. The
convergence
of water masses
into the eastern
edge of
the warm pool seems
to congregate
the most important
tuna fishery of the world, and it could be the reason forthe zonal displacements of this fishery over thousands of
kilometers
in phase
with ENSO. All these
consequences
are summarized in section 5, which is followed by some
general conclusions.
2. Means of Study
2.1. Data
The Tropical
Atmosphere-Ocean
(TAO) array is com-
posed
of about 70 buoys
and covers
most of the equa-
2366 PICAUT ET AL.' OCEANIC ZONE OF CONVERGENCE AND PACIFIC WARM POOL
torial Pacific within 8øN-8øS, 95øW-137øE [Hayes et al., 1991; McPhaden, 1993]. The studies and addi-
tional analyses that are synthesized here, used the near- surface salinity measured by the TAO array in the warm
pool, as well as the near-surface (10-50 m depth) ve-
locity taken at four equatorial sites located at 156øE, 165øE, 140øW, and 110øW. A 5 day zonal surface cur-
rent field along the equator (referred to as the TAO field) over the 1986-1994 period was built from an objec-
tive analysis of the near-surface zonal currents at these four equatorial sites. Bearing in mind that the 156øE current data started only in August 1991 and that 30 ø is the zonal decorrelation scale of the zonal current at the equator for periods greater than 50 days [McPhaden and Taft, 1988; Picaut et al., 1990], this TAO current field has to be used with some care.
Two other in situ current fields were also used. One is a mean climatology issued from a compilation of about 1500 near-surface drifting buoys during the 1987-1996
period within 20øN-20øS, 135øE-90øW and binned on
a 2 ø latitude x 4 ø longitude grid. The other field re- sults from a combination of all the near-surface drifting buoys and the near surface current measurements from the four TAO moorings at the equator. Using an ob- jective analysis, bimonthly currents over the 1987-1993 period were mapped on a 1 ø latitude x 5 ø longitude grid between 20øN and 20øS and 120øE and 80øW. In- formation on the processing and validation are detailed
by Reverdin
et al. [1994]
and Frankignoul
et al. [1996].
Despite an increase in the number of drifting buoys after mid-1988, this bimonthly current field must also be used with some care because of its coarse sampling. Even if this field includes some TAO current data, it will be referred to as the "buoy field"in the following to avoid any confusion with the "TAO field"of the zonal current derived exclusively from moored current observations. The Geosat anomalous zonal current field was ob- tained from the analysis of Delcroix et al. [1994]. Theoriginal Geosat geophysical data records used improved
satellite orbit and water vapor corrections [Cheney et al., 1991]. It was transformed into sea level anomaly
relative to the first 2 years of the Exact Repeat Mission in order to remove the imprecise geoid along the repet- itive tracks. Various filtering and gridding procedures resulted in a sea level anomaly field on a 0.5 ø latitude, 5 ø longitude and 5 day grid from November 1986 to March 1989 and between 28.5øS and 28.5øN and 125øE and 85øW. A low-pass-filtered (35 day Hanning filter)
zonal current anomaly field was built from the second meridional derivative of the sea level at the equator and
the first derivative away from the equator following the techniques discussed by Picaut et al. [1990] and Pi- caut and Tournier [1991]. It was validated against the
near-surface current measurements at the equator and at 165øE, 140øW, and 110øW with correlations of 0.92, 0.70, and 0.49 and rms differences of 17, 24, and 31
cm s -1 respectively.
The total zonal
current
along
the
equatorial band needed for the present study was built
from the sum of the previous zonal current anomalies relative to the 1987-1988 period and the mean of the TAO field over the same period. Following Picaut and
Delcroix [1995], a conversion factor of 0.75 was used to
extrapolate these zonal currents along the equator to the 4 øN-4øS band.
The TOPEX/Poseidon zonal current field was built from the original along-track sea level data taken from the CD-ROMs generated at Collecte Localisation Satel- lite (CLS) as part of the AVISO/Altimetry programme.
The low-pass filtered zonal current anomaly field (rel-
ative to the September 1992 to October 1996 period)
was built following the same technique as in the previ- ous Geosat current field; details are given by Delcroix et
al. [2000]. Comparison with the near-surface zonal cur-
rent measurements at the equator and at 156øE, 165øE, 140øW, and 110øW resulted in a correlation of 0.86, 0.90, 0.58, and 0.45 and arms difference of 15, 16, 33, and 38 cm s-1, respectively. Of most interest for
the present study, the Geosat and TOPEX/Poseidon-
derived surface zonal currents are fairly representative
of the observed near-surface currents within a region en-
compassing the western and eastern limits of the eastern
edge of the warm pool.
Additional data have been used in the analyses. Two
monthly SST data sets came from the National Cen- ters for Environmental Prediction (NCEP). One is a
combination of ship, buoy, satellite data, and it covers
the period from January 1985 to present [Reynolds and Smith, 1994]. The other, based mostly on in situ data, covers the 1950-1992 period [Smith et al., 1996]. About 16,000 sea surface salinity (SSS) data were collected
in the 4øN-4øS equatorial band from 1973 to 1995.
Most of them came from the Institut de Recherche
pour le D6veloppement (IRD, former ORSTOM) Volun- tary Observing Ship program (bucket, and since 1992, thermosalinograph), which covers essentially four major
cross-equatorial routes. Details about validation and
gridding procedure are given by Delcroix [1998]. Along
the 165øE cross-equatorial section, 42 cruises have been carried out, mostly during the TOGA programme. The processing of the vertical profiles of salinity and cur- rent into a regular grid is detailed by Delcroix et al.
[1992]. Surface wind stress is also considered and it
was obtained from the 2 ø x 2 ø FSU pseudo wind stress
product [Leglet
and O'Brien, 1984].
2.2. Models
The first model is linear and forced by observed wind-
stress field over the 1961-1992 period [Cane and Patton, 1984]. The linear shallow-water equations are solved
on an equatorial/• plane, subject to the low-frequency and longwave approximations. Variables are calculated every 5 days on a staggered grid of 2 ø longitude by 0.5 ø latitude. The model basin is bounded at 130øE and 80øW, 20øN and 20øS, and the coast of Central America and of Papua New Guinea-Australia are ap-
proximated
by two rectangles
[du Penhoat
et al., 1992].
PICAUT ET AL.' OCEANIC ZONE OF CONVERGENCE AND PACIFIC WARM POOL 2367
The forcing is derived from the FSU monthly pseudo stress wind product through a constant drag coefficient CD and is then linearly interpolated to the model time and space grid. These solutions are generated for the first 10 vertical modes calculated from a specific ver- tical density profile. The total sea level height field is found by summing the individual contribution of these
modes. Following Zebiak and Cane [1987], a shallow
frictional layer of constant depth is added to simulate the surface intensification of wind-driven currents in the real ocean. Model wind stress projections and internal wave speeds are calculated from several types of ver- tical density profiles. A mean profile representative of the central-western Pacific is generally used. Two other mean profiles representative of the eastern and western equatorial Pacific are also used to test the sensitivity of
the model to the choice of profile.
Of the two Ocean General Circulation Models (OG- CMs) used in the analyses, one is a reduced grav- ity, primitive equation OGCM [Gent and Cane, 1989; herein referred to as GC] that was specifically designed
for upper tropical ocean simulations. This model is ver-
tically divided into a specified number of layers (20 in the present study). The uppermost layer represents
the mixed layer and the layers below are chosen ac- cording to a sigma coordinate. Once the depth of the mixed layer and the depth of the last sigma layer are predicted, the thickness of the remaining layers is cal- culated diagnostically. The mixed layer physics that determines the mixed layer depth is based on the hy-
brid vertical scheme developed by Chen et al. [1994].
Another important model component is the formula- tion of surface heat fluxes. The ocean model is cou- pled to an advective atmospheric mixed layer model
[Seaget et al., 1995]. With this model the complete
heat flux can be computed with only solar radiation, cloud cover and winds needing to be externally speci- fied. This formulation significantly improves the ocean
model performance [Murtugudde and Busalacchi, 1998].
The wind stress and wind speed were derived from the FSU pseudo wind stress data set. For the freshwater flux the Climate-Prediction-Center Merged Analysis of
Precipitation (CMAP) data set [Xie and Arkin, 1996]
over the January 1979 to July 1999 period was used. A seasonal precipitation climatology was derived from the CMAP data set.
An OGCM, developed at Laboratoire d'Oc•anogra-
phie DYnamique et de Climatologie (LODYC) [Delecluse et al., 1993], has also been used to study zonal ad-
vection in the central-western equatorial Pacific. A first version of the OPA model covers the tropical Pa-
cific Ocean within 30øN-30øS, 130øE-75øW [Maes et al., 1997; Vialard and Delecluse, 1998a]. It has a zonal
resolution of 1 ø, a meridional resolution variable from
1/2 ø near the equator to 2 ø at the poleward bound- aries, and a vertical resolution (20 layers) variable from
10 m in the upper 120 m to 1000 m at depth. The
second version of the model [Maes et al., 1998] cov-
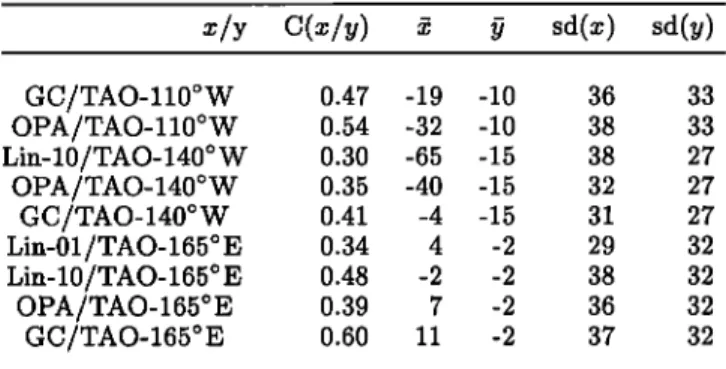
Table 2. Correlation (C) Between the Simulated Sur- face Zonal Currents From the Three Ocean Models (Lin- ear, OPA, and GC) and the Observed Near-Surface
Zonal Currents From the Three TAO Equatorial Moo-
rings.
b
x/y C(x/y) •. • sd(x) sd(y) GC/TAO-110øW 0.47 -19 -10 36 33 OPA/TAO-110øW 0.54 -32 -10 38 33 Lin-10/TAO-140øW 0.30 -65 -15 38 27 OPA/TAO-140øW 0.35 -40 -15 32 27 GC/TAO-140øW 0.41 -4 -15 31 27 Lin-01/TAO-165ø E 0.34 4 -2 29 32 Lin-10/TAO-165ø E 0.48 -2 -2 38 32 OPA/TAO-165øE 0.39 7 -2 36 32 GC/TAO-165ø E 0.60 11 -2 37 32
bThe results of the linear model are shown for 1 and 10
vertical
mlodes.
Also
listed
are
the
mean
zonal
currents
(bar)
in cm s- and their standard deviations (sd) in cm s -1.
Only correlations higher than the 95% significance level are
shown.
ers the three tropical oceans between 50øN and 50øS
with a higher resolution, i.e., 30 layers in the vertical and 1/3 ø in latitude and longitude near the equator
and near the coasts. Vertical mixing coefficients are computed through a turbulent kinetic energy closure
model [Blanke
and Delecluse,
1993]. The external
forc-
ing (wind stress,
freshwater
flux, and net heat flux)
is provided by the Meteo-France Atmospheric Gen- eral Circulation Model (AGCM) ARPEGE forced by the Reynolds' observed SST over the 1985-1994 period
[Vialard and Delecluse,
1998a]. The heat flux from the
AGCM might not be in equilibrium with the model dynamics. A restoring term (with a restoring coefti-
cient of 40 W m -2 øC
-x) toward the observed
SST
is added in order to avoid unrealistic temperatures.
This parametrization approximates at the zero order the strong coupling between the oceanic heat losses and the SST.
A comparison with the observed monthly zonal cur-
rents at three TAO equatorial sites is presented (Table 2) in order to assess the relevance of simulated cur-
rents along the equator. With different wind forcing and, for the OGCMs, two different approaches for heat
and freshwater fluxes this comparison cannot be used for model intercomparison. There is an improvement in
the linear model when using 10 vertical modes instead of the first mode. The modeled zonal surface currents in the west are approaching the observations, in particular,
a weak mean eastward flow. However, the linear model
is quite deficient in the central-eastern equator, with a stronger westward mean flow and a poor simulation of its variability. As expected, the two OGCMs behave better in this region. The variabilities are close to the observed one, but the westward flow is strong in OPA. In the warm pool the two OGCMs behave correctly in simulating the surface zonal current at the equator, but
2368 PICAUT ET AL.: OCEANIC ZONE OF CONVERGENCE AND PACIFIC WARM POOL
they are not much better than the linear model with 10
vertical modes.
3. Zonal Displacements of the Eastern
Edge of the Warm Pool
Wyrtki [1975, 1985] was the very first to recognize the
importance of the zonal migration of the warm pool in
relation to E1 Nifio, and Gill [1983] suggested that this
migration is mostly due to advection by zonal current
anomalies. Gill [1983] also suggested looking at the dis-
placement of water mass by the zonal current averaged over the equatorial waveguide. The use of hypothetical drifters with a huge drogue has the advantage of follow- ing the water masses along the equatorial waveguide. On the contrary, real drifters would sooner or later es- cape the equatorial band with, in particular, the diver- gence associated with the equatorial upwelling. This technique was successfully applied in several studies,
such as by Picaut et al. [1996]. It will be used and fully
justified in the following sections. 3.1. Observational Results
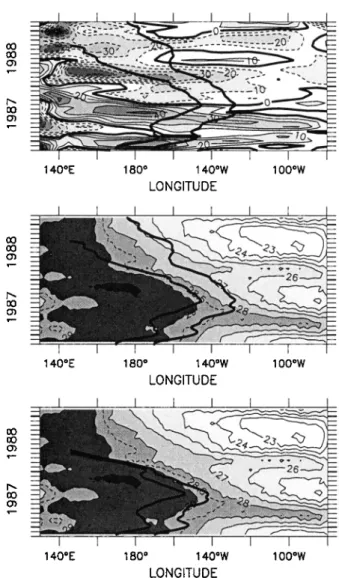
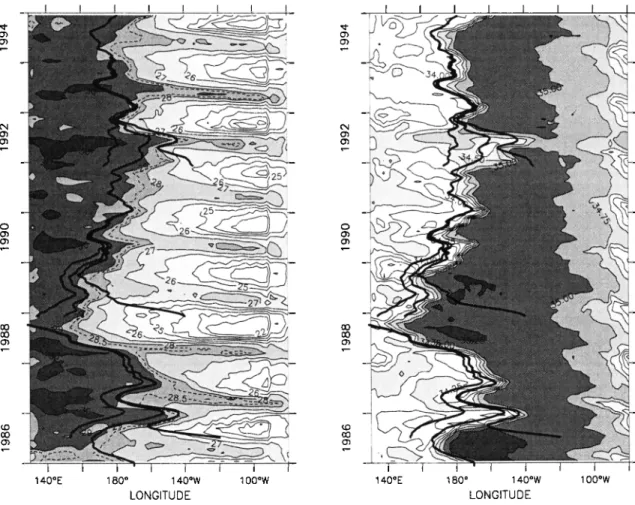
The technique is illustrated on Figure 2 with two hypothetical drifters with a 4øN-4øS drogue launched into the zonal surface current anomalies derived from Geosat altimetry measurement over the November 1986
to February 1989 period (Figure 2, upper panel). Dur-
ing the 1986-1987 E1 Nifio the drifters move toward the east with the dominant eastward currents, while they move toward the west during the 1988-1989 La Nifia.
When the trajectories of these two drifters are super-
imposed on the observed SST averaged within the same
4øN-4øS equatorial band (Figure 2, middle panel) they
bracket the eastern edge of the warm pool. With the zonal SST gradient on the edge nearly constant this re-
flects that zonal advection is the dominant mechanism
for the 1986-1989 E1 Nifio-La Nifia zonal migrations of the eastern edge of the warm pool [Picaut and Delcroix, 1995].
Because of the uncertainty in the determination of the mean geoid, altimetry derived currents are relative
to some mean. The addition of the zonal mean current derived from the TAO field results in a remarkable fea-
ture (Figure 2, lower panel). After about 1 year the two hypothetical drifters converge into a single trajectory,
which follows the retreat of the warm pool associated
with the 1988-1989 La Nifia event [McPhaden and Pi- caut, 1990] and finally reaches the western limit of the
current field. The convergence of the two trajectories is
due to the mean zonal currents along the equator, com- posed of a weak mean eastward flow in the warm pool and a significant mean westward flow in the cold tongue
that converge into a position close to the dateline.
As discussed
by Delcroix
et al. [2000]
over
the 1992-
1998 period the use of surface current derived from
TOPEX/Poseidon
leads to similar results
(Figure 3).
140øE 180 ø 140øW 100øW LONGITUDE
• '
I ' ' ' I '
I '
.... "?'•'•
140"E 180" 140"W 100"W LONGITUDE I I I I I I I I ':•;9;•i•!:i.•....' :' ': .... •::•i::'•::..-•.•.:?.•..'.:,..:::-'•, ..." :,-..:..
.
:•'•
..•
'•
'.••::.•i
".
'""?"
...
•"?'%•:•'""':':':
":'?":"?:
...
140øE 180 ø 140øW 100øW LONGITUDEFigure 2. Trajectories
of hypothetical
drifters moved
by surface
zonal currents
derived
from Geosat
and aver-
aged
within 4øN-4øS:
(upper
panel) currents
anomalies
relative to 1987-1988, (middle panel) currents anomalies
superimposed
on the observed
SST, and (lower
panel)
total currents superimposed on the observed SST. Con-
tours are 10 cm s -x and 1øC respectively.
During the 1993-1994 E1 Nifio events and the begin-
ning of the 1995-1996 La Nifia the trajectories of the two hypothetical drifters displaced by the 2øN-2øS cur-
rent anomalies (Figure 3, left panel), bracket the dis- placement of the eastern edge of the warm pool (as inferred from Figure 3, right panel). Similar to what happened during the 1988-1989 La Nifia (Figure 2), the
trajectories reach the western limit of altimetry-derived currents during the 1995-1996 La Nifia. Other drifters launched in spring 1996 are drastically moved eastward by the anomalous eastward flow associated with the
1997 E1 Nifio. The use of the total currents (Figure 3, middle panel) results in a convergence of the hypo-
thetical drifters into a single trajectory near the east- ern edge of the warm pool during the successive 1992-
PICAUT ET AL.: OCEANIC ZONE OF CONVERGENCE AND PACIFIC WARM POOL 2369 •...• •.•:•.•..;• .•.• ... . ... ... •,::•,•.• : ...
...
0
- - '•'•:-•-"---0-
"'
:':""
... • ' :'•:•'• • ... ;: ...•'"'
'•
';f:Y=•"•• •0•
•-. ... :... ,-• I I I I I I I 140*E 180 • 140*W 100*W LONGITUDE....
':"
'"'
-,•:..._-, -?•;;:::.g•;:.:• ... ::•:•:,•.:•::•. ......
:.
...
'•'•' ...
_ .••...•.•...••:•:..••.••
... •.•:•:::6;•:•::'. . ... ..• ... .... I I I I I I I 140øE 180 ø 140øW 100øW LONGITUDE '•.i•!!•;•'""'"•...:•.-;:•,•:...-::.-.,•,. ... 4 ,._____: • .:•.,•:•:•::•.-!•;•i•-:.-.'.•.. '•:•,•:•..•..,•::,•. : ' -....:,:•. '•"/• ... •.• .... _•'-i.. :::.':;•::•,•;:::•::::: ... ::.- ... -•,•"..;::;.:•i:-•:•'•:'"':::"-f. 'I.'."':"- ' •
2 ::i:i, li?;;:::;::? ....•.•'%i;;:"t;ii.:• 1'-:!.:-'•:::•:'•'•*•'"'-• '"'•"•"'"' '•:'•'" "•':':""'"' '
:": .... •' ,•.,,•- .--:•::•::: - .; :.:..
n,•:::t:;•:. ':: '•:"::-:'::'* •*'•'..".": i;::;•:'-'•!•f ....
•
'."::.:
...
::'::' .•...
',•::':":'"i:•:•i;;-.-:..
...
"
140øE 180 ø 140øW 100øW
LONCITUDE
Figure 3. Trajectories of hypothetical drifters moved by surface zonal currents derived from
TOPEX/Poseidon
and averaged
within 2øN-2øS:
(left panel) currents
anomalies
relative to
September
1992-October
1996, (middle panel) total currents,
and (right panel) total currents
superimposed
on the observed
SST. Contours
are 20 cm s -• and IøC respectively.
1995-1996 La Nifia all the drifters are pushed into the western limit of the current field. By the end of 1996 the total current becomes eastward, and the drifters are then pushed by the powerful 1997 E1 Nifio eastward sur-
face flow. The zone of convergence is not so well defined during this strong E1 Nifio. However, a singie trajectory
appears close to the 29øC during the w•rm event and then underlines the retreat of the warm pool associated with the 1998 La Nifia.
Most of the hypothetical drifters launched in early 1988 in the western equatorial Pacific into the bimonthly
buoy field have a tendency to converge into a single tra- jectory after 2 years (Figure 4). Then they roughly fol-
low the migration of the eastern edge of the warm pool, although with a westward offset that may be due to the strong smoothing of the current field. All the drifters launched east of the edge reach rapidly the common tra-
jectory, due to the dominance of the westward flow in
the central-eastern equatorial Pacific [Reverdin et al., 1994]. This is illustrated by one drifter launched at
160øW at the end of 1990. On the other hand, drifters launched in the far western equatorial Pacific do not necessarily reach the common trajectory. In the warm
pool, the mean eastward current is not well defined and
sometimes not strong enough to counteract sporadic westward currents.
Using the TAO field (Figure 5), the trajectory of the drifters launched in 1986 follows the eastern edge of
the warm pool, except during the 1988-1989 La Nifia, when it is interrupted as it passes the westernmost TAO
site at 156øE. Three drifters are launched farther east
in 1990. They converge into a single trajectory after 2-3 years and then closely follow the migration of the eastern edge of the warm pool associated with the 1991- 1992 and 1992-1993 E1 Nifio events.
These results from four different sets of observa- tions exhibit similar features. Because of the presence of mean zonal converging currents, the water masses along the equator meet at a zone of confluence, or one- dimensional convergence. This zone happens to be situ-
ated close to the eastern edge of the warm pool (i.e., the 29øC isotherm) and migrates eastward and westward
with this edge during E1 Nifio and La Nifia, respec- tively. This zone is easily evidenced by the trajectories
140øE 180 ø 140øW 1 O0øW
LONGITUDE
Figure 4. Trajectories of hypothetical drifters moved
by near-surface
zonal
currents
issued
from the buoy
field
and averaged within 4øN-4øS. Superimposed is the ob-
2370 PICAUT ET AL.- OCEANIC ZONE OF CONVERGENCE AND PACIFIC WARM POOL
I XlX
I )i
( ,I X
•.::..•..•:...:...:.:.:..:..:...:...:.
'•i•!•i•::di!; •,•..-.'.'.'..-•.::'"•:•
:•.•::•;.:-:.• ....Nqib;-i;/.:4.•..'.;!•
•-•v.
'*'""•.•,..;j?f:•.•ii•::i:•:,•.•:-.:-:
...
•,,;'.•,;..
.:.-.:...:
• ,½o..;:•:•..:..::.:::.:
,:'-'%i---':--'.',;,:.:•
:':'?::.i½•::qiiiiiiiiiiiiii:::;4f.':;J.:•,:.-':•-::-..'•
. ;•:dL'...,.'j½•...'•i•ii7.::.:..•.;.::-.2'.?.,•:•½•r.:-:.-•z•:•-•-.•-
':•11,½•
'ø''
'::•""':•:"•'/,•
.;..:...:•::•:...;:.•
:'.:.:•' ::7': .:::e:: ß *•;•?:• i•i½•::•.:•. i' ': •:•i•i::il :i: :"-.
.... ½::.•...;!;;.'! ':': :::-':'.'.:':.. :;'.'!:;.';:; ... •. •,•--"-: f: •:: !:: f: ::•:• {•:i::-•;,.-' • .:..' • ..:':'::!i!i•:iiii:;ii .... •-:-•,.-'!•.,::•.::.•'--:.: ;:?..:...: -"-.:..:.,:..' % '::::.'!::•i•i:..-.."•::i:]•i:•..,•., . '::.:::::-:::ii!.
...
...
;':.. .'.i:iii
"
i:•!!!B'-j•i;•?:• ... -.'::...:•,::-.-..:•.,,:x ... .. • •.:.•!;:::i::•:;;i•;•ii?'•?.:. -' . :•*:•*-'.:::•: *•.•-'•-; "*-•.•x-::*•,::'i• ... ' .-. . ß ,:,:u.z•....½:•.: :•.:.. ?.!.•!i•:::•.::-$i.:?7...:b:•:•,i,,,•/..-.. • - - -• .:c::, ----. .:•!•:•!•:.•::•i •.• ,,' .•'-, ?' .'"'•:.ii!:•11:•111!' :•'*•!::*•::. 24 ½:i•:•ii•;: ß :::::. ." . :-:!.-•:•iiiii• ...%:.- :: % ' :i: ß ':i½ii '-'.-':•::?-:iiii:•iiii::i ....
.. ... ....•::::Xi. Bi;'•i!!!•i•!•*• ... .::,:..::"::-" :' ". -'..: ::'"u;•.t•... -'•a•,Z:::':':::':::;"'• ... .;i,•11:i:!::!:i::i:::11 ... •.::Z. •.,• "" • • :4':4? --:)'-..•iiiii::ii::.::::::.: 't::';;'....;L:..'.-.'.'.:.': ... ' ": •- '•, '•,•' ' ?-•J:•::::;.'C. :-"•½..?-.;• "'½.•-:.' ;•,. ., ". "•"- :: •,..-- '-'. .... ':•:'" :'"'"":'::'"•:•:•:•"::':' '.? •, . • ..i•i•ii•::".:'•j';"•i..:•.:.•:
'.::,!'?:-.'..:
... ... .::•!i'
.
.::.::..:.•.'.... -,;-:•:.. ... ...,.:•...H....:•i?F
':'"'.
ß
..
... ::::.:.• .... i. :ii ½;.•i::;:' '-:': ß ... 140øE 180 ø 140øW 100øW LONGITUDEFigure 5. Trajectories of hypothetical drifters moved by near-surface zonal currents issued from the TAO field along the equator. The crosses denote the location of the equatorial moorings used to build the TAO field.
Superimposed is the observed SST (contour every 1øC).
of hypothetical drifters launched in the east as the dom-
inance of westward flow along the equator would always
push the drifter into the eastern edge of the warm pool. On the other hand, the zonal current in the equatorial band of the warm pool is weakly eastward on a mean but it can be subject to strong eastward intraseasonal
and interannual variations [e.g., McPhaden et al., 1992; Frankignoul et al., 1996]. As a consequence, the west-
ern side of the oceanic zone of convergence is not so well defined, and it can be pushed eastward past the east- ern edge of the warm pool during the 1988-1989 and 1995-1996 La Nifia events.
3.2. Modeling Results
The linear model does not include an SST equation. Hence the hypothetical drifter trajectories moved by the <4øN-4øS> simulated zonal currents are superimposed
over the observed SST averaged within the same band
(Figure 6). All the hypothetical drifters launched in the
eastern equatorial Pacific reached the oceanic zone of convergence as defined by the single trajectory within 2-4 years. Similar to observations, almost all of the drifters launched within 10 ø west of this convergence zone reached it after a year or 2. Over the first half of the 1961-1992 period of model run the unique trajectory seems to follow the zonal migration of the other side of the warm pool as defined by the 29øC contour. During the second half the trajectory remains in the middle of the warm pool, and it is subject to strong zonal migra- tions that are in phase with those of the eastern edge of the warm pool. At the same time the warm pool seems to expand zonally. The long-term change of the position of the zone of convergence is due to a modifi- cation in the strength of the converging currents along the equator. It is tempting to relate these simultane- ous changes to those around 1976 in the frequency of
ENSO events and in the subsurface temperature, asso-
ciated with long-term and decadal variations [Trenberth
and Hoar, 1996; Guilderson and Schrag, 1998; Lau and
•-- ': ":::•:•:½:iii....,:.i:•i
:::::::::::::::::::::::: ... .,;..-.•...
140øE 180 ø 140øW 100øW
Figure 6. Trajectories of hypothetical drifters moved by surface zonal currents issued from the linear model and averaged within 4øN-4øS. Superimposed is the ob-
served $ST (contour every 1øC). The dashed (full) line corresponds to the model run with the first (10) vertical mode(s).
PICAUT ET AL.: OCEANIC ZONE OF CONVERGENCE AND PACIFIC WARM POOL 2371
Weng,
1999]. Such
changes
are beyond
the scope
of the
present study, especially knowing the simplicity of the
model used and the uncertainties in the determination
of the 29øC position from scattered in situ SST obser- vations prior to the use of satellite sensors [Smith et al., 1996].
The lack of nonlinear terms in this model is likely the reason for the zone of convergence to be situated too much into the warm pool as compared to obser- vations and the following OGCMs' results since non- linearities strengthen the eastward equatorial currents
and weaken the westward equatorial currents [Philander and Pacanowski, 1980]. Other parameters of the linear model may be responsible for the westward shift of the mean position of the zone of convergence. As shown on Figure 6, the use of just the first vertical mode re-
duces this shift and also the amplitude of the ENSO
migrations of the zone of convergence. An increase
in the Rayleigh
friction
coefficient
from 2.5 year
-• to
6 month -• results in a 30% reduction of the E1 Nifio
eastward migrations and, therefore, on average in an increase of the westward shift. The ENSO migrations
of the single trajectory are not much affected by the change of the drag coefficient within the range 1-2 x 10 -3 . Similarly, there are no significant changes in the
position of the convergence zone with the replacement
of the mean vertical density profile used in this model by
one representative of the cold tongue or another repre-
sentative of the warm pool. Only a significant increase
of the mixed layer (from 43 to 70 m) will shift the mean position of the zone of convergence eastward by about
10 ø . All these tests indicate that despite the limita- tion of the simulated currents the zone of convergence,
its ENSO migrations, and its westward shift inside the warm pool are intrinsic and permanent features of the linear model.
The OPA OGCM simulates SST; hence this field can
be used in conjunction with the simulated current field. The trajectory of a hypothetical drifter with a 4øN-4øS drogue follows the migration of the eastern edge of the warm pool defined by the 29øC isotherm (Figure 7). A discrepancy appears in the boreal summer of 1993
where the drifter is moving in the opposite direction to the eastward expansion of the warm pool associated with the 1993 E1 Nifio. The trajectory is unique, ex-
cept briefly during the peak of the 1988-1989 La Nifia. Other drifters on Figure 7 illustrate the existence of the oceanic zone of convergence close to the eastern edge of the warm pool. The zone of convergence is emphasized by the superposition of the trajectories on the simulated
I
140øE 180 ø 140øw 100øw 140øE 180 ø 140øW 100øW
LONGITUDE LONGITUDE
Figure 7. Trajectories of hypothetical drifters moved by the surface zonal currents issued from
the OPA model and averaged
within 4øN-4øS.
Superimposed
is (left panel) the SST and (right
panel) the SSS. Contours
are 1øC and 0.25 psu respectively.
2372 PICAUT ET AL' OCEANIC ZONE OF CONVERGENCE AND PACIFIC WARM POOL .,-.- ':•:•....:•i-'-:.:.: ::'":'•' '": ' ' ' 0'3 " o Ob '-.<.-. :...:.:.'-,' :--'; ""z•*:"iii: 140øE 180 ø 140øW 100øW 140øE 180 ø 140øW 100øW LONGITUDE LONGITUDE
Figure 8. Trajectories
of hypothetical
drifters
moved
by the surface
zonal
currents
issued
from
the GC model
and averaged
within 2øN-2øS.
Superimposed
is (left panel)
the SST (right panel)
the SSS. Contours are IøC and 0.25 psu respectively.SSS field. Because of evaporation and the presence of the equatorial upwelling, which brings high-salinity wa-
ter from below, the surface water of the central equa-
torial Pacific is characterized by relatively cold temper- ature and high salinity. On the other hand, the heavy precipitation that moves in synchrony with the warm pool results in low surface salinity in the west. As shown on Figure 7, these very different water masses meet on the eastern edge of the warm pool in a single drifter trajectory and result in a sharp SSS front that moves zonally with the ENSO phases. This front is aligned
meridionally, and it .appears to be trapped to the equa-
tor. Interestingly, the .displacement of the simulated salinity front matches almost every detail of the single
trajectory. Maes et al. [1998] first simulated this front with the OPA model, and Vialard and Delecluse [1998b] discussed it in detail with the same model. This front and its displacements bear much resemblance to those
deduced from merchant ship SSS observations (Figure 1).
The results with the GC model forced by the CMAP precipitation data set over the January 1979-July 1999
period are first presented (Figure 8). The trajectory
of a hypothetical drifter with a 2øN-2øS drogue mostly
follows the migrations of the eastern edge warm pool defined by the 29øC isotherm. The trajectory is unique
from 1979 until the 1995-1996 La Nifia, where it reaches the western side of the basin. In early 1996 a drifter launched at 140øW is first pushed toward the west, and with the start of E1 Nifio it follows the huge eastward migration of the warm pool associated with this power-
ful event. Similar to the results with the TOPEX/Po-
seidon-derived current, the retreat of the warm pool
associated with the rapid shift into the 1998 La Nifia is
captured by the hypothetical drifter. The convergence of the water masses on the eastern edge of the warm pool is highlighted by a salinity front, on the same way as the OPA simulation.
Another run was done with the GC model forced by the CMAP seasonal climatological freshwater flux
(not shown). As expected, the salinity contrast between
the central and western equatorial Pacific is reduced by about 0.5 psu and so is the strength of the salinity front. This change of freshwater flux has little impact on the simulated surface currents. The position of the zone of convergence defined by the drifter trajectory is almost unchanged, and the salinity front remained attached to this zone of convergence in the same way as the previous
PICAUT ET AL.- OCEANIC ZONE OF CONVERGENCE AND PACIFIC WARM POOL 2373
run with the 1979-1999 CMAP precipitation (Figure 8). Differences in freshwater fluxes clearly alter simu- lated SSS [e.g., Yang et al., 1999], and the ARPEGE-
AGCM freshwater flux used in the OPA-OGCM has
several deficiencies compared to observations [Vialard and Delecluse, 1998a]. However, the results with these
two OGCMs, and, in particular, the last test with a cli- matological precipitation, assert the robustness of the present analysis: the zone of one-dimensional conver- gence on the eastern edge of the warm pool is marked by a salinity front, which is displaced with the eastern edge of the warm pool in phase with ENSO. The precip- itation and evaporation are needed to build the salinity front, but like the SST on the eastern edge of the warm pool, the zonal displacements of this salinity front are mainly driven by the surface zonal currents within the equatorial band.
4. Discussion
4.1. Zonal Advection
Near-surface zonal current fields along the equatorial band, deduced from four different types of in situ and satellite observations and from three classes of ocean model, have evidenced the existence of an oceanic zone of convergence on the eastern edge of the warm pool. This zone of one-dimensional convergence, the East-
ern Warm Pool Convergence Zone (EWPCZ), moves
back and forth along the equator in synchrony with the
phases of ENSO. The EWPCZ was evidenced through the use of hypothetical drifters with a drogue cover-
ing the equatorial band that integrates the variation in time and space of the zonal currents in this band. The oceanic zone of convergence is tracked down by Lagrangian drifters, and since the SST gradient on
its east is oftentimes nearly constant (Figure 1), this
implies that zonal advection is the dominant mecha- nism for the ENSO displacement of the eastern edge of the warm pool. This is in agreement with the La-
grangian approaches of Gill [1983], McPhaden and Pi- caut [1990] and Picaut and Delcroix [1995], in partic-
ular, with a verification in the equation governing the
equation of heat by Picaut and Delcroix [1995]. This
has been further confirmed by recent modeling and ob- serving studies in the central-western equatorial Pacific
using a Eulerian approach [e.g., Perigaud and Dewitte, 1996; Vialard et al., 2000; Wang and McPhaden, 2000]. Hence it is not surprising that Liu et al. [1994] were un-
able to find a dependence between SST tendency and atmospheric heat flux in the central equatorial Pacific. Section 3 also shows that the EWPCZ is marked by a salinity front. The SSS field of Figure I was built mostly from merchant ship observations, which mainly cover
four main and large cross-equatorial sections [Delcroix et al., 1996]. The interpolation within these sections
underestimates the strength of the salinity front. Nu-
merous salinity observations taken from research vessel sections along the equator [e.g., Mangum et al., 1990;
Kuroda and McPhaden, 1993; Inoue et al., 1996; Eldin
et al., 1997],
from TAO mooring
[e.g., McPhaden
et al.,
1992; Sprintall and McPhaden, 1994], and from ther- mosalinograph onboard merchant ships [e.g., H•nin and
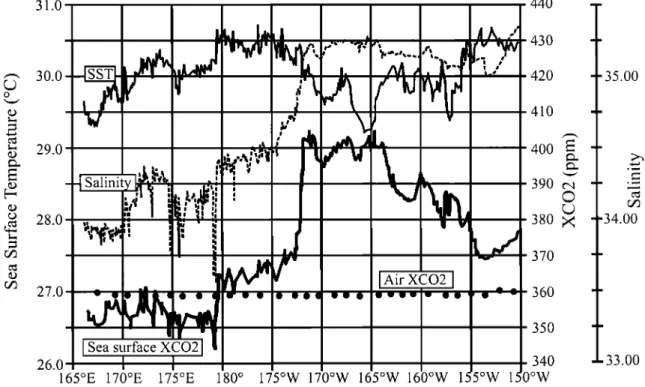
31.0 440 t•,t_ Jd•,l 13,. :"
.
/ '
30.0 • - -
,. '• :'••• '-' 420
-4Salinity•l
jj,.
tq•
--,,
i
••
'
'"'"" j
-27.0
'•
lair
XCO2
I
360
...--
I
XCO:I
I
29.0 28.0 430 410400 •
390 o4380
•
370 350 26.0 340165øE 170øE 175øE 180 ø 175øW 170øW 165øW 160øW 155øW 1 0øW
- - 35.00
,.,•
--34.00
--33.00
Figure 9. Continuous surface measurements along the equator during the Flupac cruise in