HAL Id: hal-00330047
https://hal.archives-ouvertes.fr/hal-00330047
Submitted on 8 Nov 2005
HAL is a multi-disciplinary open access
archive for the deposit and dissemination of
sci-entific research documents, whether they are
pub-lished or not. The documents may come from
teaching and research institutions in France or
abroad, or from public or private research centers.
L’archive ouverte pluridisciplinaire HAL, est
destinée au dépôt et à la diffusion de documents
scientifiques de niveau recherche, publiés ou non,
émanant des établissements d’enseignement et de
recherche français ou étrangers, des laboratoires
publics ou privés.
Electron pitch angle variations recorded at the high
magnetic latitude boundary layer by the NUADU
instrument on the TC-2 spacecraft
L. Lu, S. Mckenna-Lawlor, S. Barabash, Z. X. Liu, J. Balaz, K. Brinkfeldt, I.
Strharsky, Chao Shen, J. K. Shi, J. B. Cao, et al.
To cite this version:
L. Lu, S. Mckenna-Lawlor, S. Barabash, Z. X. Liu, J. Balaz, et al.. Electron pitch angle variations
recorded at the high magnetic latitude boundary layer by the NUADU instrument on the TC-2
spacecraft. Annales Geophysicae, European Geosciences Union, 2005, 23 (8), pp.2953-2959.
�hal-00330047�
SRef-ID: 1432-0576/ag/2005-23-2953 © European Geosciences Union 2005
Annales
Geophysicae
Electron pitch angle variations recorded at the high magnetic
latitude boundary layer by the NUADU instrument on the TC-2
spacecraft
L. Lu1, S. McKenna-Lawlor2, S. Barabash3, Z. X. Liu1, J. Balaz2, K. Brinkfeldt3, I. Strharsky2, C. Shen1, J. K. Shi1, J. B. Cao1, S. Y. Fu4, H. Gunell2,3, K. Kudela5, E. C. Roelof6, P. C. Brandt6, I. Dandouras7, T. L. Zhang8, C. Carr9, and A. Fazakerley10
1Centre for Space Science and Applied Research of the Chinese Academy of Sciences, Beijing, China 2Space Technology Ireland, National University of Ireland, Maynooth, Co. Kildare, Ireland
3Swedish Institute of Space Physics, Kiruna, Sweden 4Beijing University, Beijing, China
5Institute of Experimental Physics, Kosice, Slovakia
6Applied Physics Laboratory, Johns Hopkins University, Maryland, USA 7Centre d’ Etude Spatialedes Rayonnements Toulouse, France
8Space Research Institute, Austrian Academy of Sciences, Graz, Austria 9Imperial College of Science, London, UK
10MSSL, UCL, Holmbury St. Mary, UK
Received: 14 February 2005 – Revised: 4 August 2005 – Accepted: 13 September 2005 – Published: 8 November 2005 Part of Special Issue “Double Star – First Results”
Abstract. The NUADU (NeUtral Atom Detector Unit)
ex-periment aboard TC-2 recorded, with high temporal and spa-tial resolution, 4π solid angle images of electrons (∼50– 125 keV) spiraling around geomagnetic field lines at high northern magnetic latitudes (L>10), during its in-orbit com-missioning phase (September 2004). The ambient magnetic field, as well as electrons in other energy ranges, were simul-taneously measured by the TC-2 magnetometer (FGM), the plasma electron and current experiment (PEACE), the low energy ion detector (LEID) and the high energy electron de-tector (HEED). The NUADU data showed that up-flowing electron beams could form “ring-like” and “dumbbell-type” pitch angle distributions (PADs) in the region sampled. Changes in these pitch angle distributions due to transient magnetic variations are suggested to have been associated with electron acceleration along the geomagnetic field lines. A nested magnetic bottle configuration that formed due to the propagation towards the Earth of a magnetic pulse, is pro-posed to have been associated with this process.
Keywords. Interplanetary physics (Energetic particles) –
Magnetospheric physics (Storms and substorms; Plasma sheet)
Correspondence to: L. Lu
1 Introduction
The Chinese Space Agency launched the second of a pair of spacecraft (TC-2), forming the Double Star Mission, into a polar orbit on 25 July 2004. TC-2 carries a payload de-signed to investigate various features of geo-space, both on a stand-alone basis and in co-operation with the CLUSTER mission already launched by the European Space Agency. During its on-orbit commissioning in September 2004, the NUADU instrument imaged the spherical pitch angle dis-tributions (PADs) of ambient electrons in the keV range at high temporal and spatial resolution, at high northern lati-tudes (L>10). This provided an opportunity to investigate, in detail, the formation and evolution of these PADs.
The measurement and investigation of pitch angle distri-butions provide insight into the physical mechanisms per-taining to energetic plasmas. Usually a PAD is observed to evolve from being nearly perpendicular (pitch angles
∼90◦) to being nearly field-aligned (pancake-type). At the
High Magnetic Latitude Boundary Layer (HMLBL), espe-cially during episodes of geomagnetic activity, the distri-butions may rather be of the dumbbell-type (Asnes et al., 2005). In the spherical view, single ring-like PADs are ob-served which are referred to as “smoke rings” by Williams (1981). The electron beam concerned is commonly called the “plasma source” of those abnormal PADs, which con-serve the first adiabatic invariant during their evolution. Sev-eral authors analysed the mechanisms of transport and loss
2954 L. Lu et al.: Electron pitch angle variations at the high magnetic latitude boundary layer
Figure 1, (top); examples of ring-like particle configurations. Each abscissa covers 128 azimuths,
with 2.8125º to each pixel, and each ordinate covers 16 elevations, with 11.25º to each pixel. The
colour scales at the top indicate the number of particle counts in each pixel. Figure 1, bottom panel;
shows corresponding PAD plots. Red arrows point to the flux peaks formed at the locations of the
rings.
2 1 0 -1 -2 -3 -4 -5 -1 0 1 2 3 4 5 6 ZGSE (RE )Sep. 1, 2004 XGSE (RE)
B 2 1 0 -1 -2 -3 -4 -5 2 1 0 -1 -2 -3 -4 -5 YGSE ( RE )
Sep. 1, 2004 XGSE (RE) B
Fig. 2.The location of TC-2 in the X-Y plane (right), and in the X-Z plane (left) in the GSE system.
Black arrows indicate the magnetic field direction and red arrows the direction of motion of the
spacecraft at the time of the PADs shown in Fig. 1
.
Fig. 1. Top: examples of ring-like particle configurations. Each abscissa covers 128 azimuths, with 2.8125◦to each pixel, and each ordinate
covers 16 elevations, with 11.25◦to each pixel. The colour scales at the top indicate the number of particle counts in each pixel. Bottom panel: shows corresponding PAD plots. Red arrows point to the flux peaks formed at the locations of the rings.
Table 1. Energy channels of NUADU.
Energy Channels Electron [keV] H [keV] O [keV] 1Ee[keV] 1EH [keV] 1EO[keV]
E1: TH1-TH2 14.26–18.4 45.1–50 *–138 4.1 4.9 – E2: TH2-TH3 18.4–49.2 50–81 138–185 30.8 31 47 E3: TH3-TH4 49.2–125.2 81–158 185–300 76 77 115
of the electrons concerned (e.g. Friedel et al., 2002; Green, 2004). Large-scale (proposed by Fujimoto et al., 1990), and small-scale (proposed by Boscher et al., 2000, and by Liu et al., 1999), re-circulation in the magnetosphere, involving ra-dial diffusion and pitch angle scatting, were each suggested by these authors to result in electron acceleration.
The present study focuses on PADs observed at the HMLBL so as to investigate (a) the correlation between ab-normal PADs and the associated behaviour of ambient mag-netic fields, and (b) to compare the behaviour of electrons in the keV range moving along the geo-magnetic field lines observed by NUADU, and local electrons simultaneously recorded at other energies by various instruments of the TC-2 payload.
Section 2 presents a brief introduction to the NUADU in-strument. Sections 3 and 4 describe two instances in which the observed PADs changed in temporal association with changes in the ambient magnetic field. In Sect. 5, these ab-normal PADs are discussed and final conclusions presented.
2 Instrumentation
The NUADU instrument on TC-2 features 16 solid-state de-tectors, each with a rectangular active area of 46.5×10 mm2 and each with an equal field of view (11.5◦–2.5◦fwhm) dis-tributed regularly over an 180◦angle in the elevation plane. Spacecraft spin (4s) allows the azimuthal plane to be divided into 128 equal sectors through counting pulses provided by the spacecraft, and NUADU can provide a full 4π image of the ambient particle population on the completion of each spacecraft spin (4s). It is possible to integrate N spins on-board within the range N=2–32 to achieve better statistics. For details concerning the instrument, see McKenna-Lawlor et al., 2004.
NUADU can record both neutral and charged particles. In Table 1, the energy channels of the instrument with respect to both neutral atoms and electrons are presented. NUADU was commissioned in space in the period August–September 2004. Due to its high geometric factor (G=1.3×10⁻³sr cm2), NUADU saturates in the radiation belts but can record particles at high northern latitudes (L∼10). The viewing
L. Lu et al.: Electron pitch angle variations at the high magnetic latitude boundary layer 2955
Figure 1, (top); examples of ring-like particle configurations. Each abscissa covers
128 azimuths, with 2.8125º to each pixel, and each ordinate covers 16 elevations,
with 11.25º to each pixel. The colour scales at the top indicate the number of particle
counts in each pixel. Figure 1, bottom panel; shows corresponding PAD plots. Red
arrows point to the flux peaks formed at the locations of the rings.
TC-2 was located at the dawn-night side when at the HMLBL (Fig. 2). The ambient magnetic field
was recorded by FGM. The time intervals of the frames under study (shown in Fig. 1), are shaded in
green on the magnetic field plot presented in Fig. 3.
Each magnetic component displayed a transient,
approximately 5 nT, shift during the individual accumulation periods. This implies that the magnetic
flux tube suffered a distortion at these times
.
It is noted that, some minutes before the formation of
the ring-like structures, multiple magnetic spikes (nT) were recorded by FGM which may have been
related to the events considered. These spikes presently require further investigation.
Due to the absence of other energetic particle detectors on-board TC-2, we can only consult the
low-energy particle observations made by PEACE (1 eV – 1keV) and LEID (50 eV – 25 keV), and the,
relatively, ‘high-energy’ data from HEED (0.2 – 0.4 MeV).
In the PEACE data, nearly field aligned, high speed, electron beams (V
x
=-2300 km/s and V
x
=-7000
km/s) were observed at the times of both the selected frames (Fig. 1) There was no obvious event in
the corresponding LEID data (see Fig. 4, green shading). During the concerned periods, the parallel
electron temperature was higher than the perpendicular electron temperature. The omni-directional
flux of (49.2-125 keV) electrons recorded by NUADU in Energy Channel 3, is compared in Fig. 5
with the corresponding high energy electron flux (0.2 – 0.4 MeV) recorded by HEED. There is no
significant correlation between these records and it can, thereby, be deduced that the up-flowing
electron beams with energies < 100 keV, spiralling around the field lines to form ring-like particle
distributions, are not influenced by simultaneously up-flowing, high energy, electrons.
2 1 0 -1 -2 -3 -4 -5 -1 0 1 2 3 4 5 6 ZGS E (R E )
Sep. 1, 2004 XGSE (RE)
B 2 1 0 -1 -2 -3 -4 -5 2 1 0 -1 -2 -3 -4 -5 YGS E (R E )
Sep. 1, 2004 XGSE (RE)
B
Fig. 2.The location of TC-2 in the X-Y plane (right), and in the X-Z plane (left) in the
GSE system. Black arrows indicate the magnetic field direction and red arrows the
direction of motion of the spacecraft at the time of the PADs shown in Fig. 1
.
Fig. 2. The location of TC-2 in the X-Y plane (right), and in the X-Z plane (left) in the GSE system. Black arrows indicate the magnetic
field direction and red arrows the direction of motion of the spacecraft at the time of the PADs shown in Fig. 1.
capability of the instrument allows the pitch angles of parti-cles spiraling at high magnetic latitudes in the geo-magnetic field to be imaged.
The experiments FGM, PEACE, LEID, and HEED aboard TC-2 (individually described in this issue) simultaneously measured ambient magnetic fields and electrons in several different energy ranges and these data were used (see below) in studying two kinds of abnormal PAD.
3 Ring-like PADs
On 1 September 2004 at 17:35:20 UT, and again at 17:38:03 UT, two ring-like particle distributions were im-aged in electrons by NUADU in Energy Channel 3 above the radiation belt in the HMLBL (see Fig. 1, top panel). It is noted that a bright point in the centre of the ring distribution shown in the frame, on the right-hand side, is due to cross talk. The bright points at the left side of each frame rep-resent, on the other hand, contributions to the normal PAD background.
Each frame in Fig. 1 was formed by integrating over 8 spacecraft spins. The accumulation time for each pixel was 0.25 s. The PAD curves (Fig. 1, bottom panel) show that, in each case, a particle beam was superposed on the nor-mal PAD background, and that the local pitch angle of the beam was ∼152◦. Energetic beams in a spherical (smoke ring) distribution were recorded on ISEE 1 at about −20 RE
in the magnetotail (Williams, 1981). However, the strong intensity gradients at the edge of the plasma sheet, and lim-ited temporal-spatial resolution (36-s integration interval for a 192-pixel spherical view frame), resulted in producing ob-vious azimuthal asymmetries in the associated magnetic field line. Each image in Fig. 1 required 32-s accumulation. How-ever, eight full frames were integrated together, so that the rings remained symmetrical about the magnetic field line.
TC-2 was located at the dawn nightside when at the HMLBL (Fig. 2). The ambient magnetic field was recorded
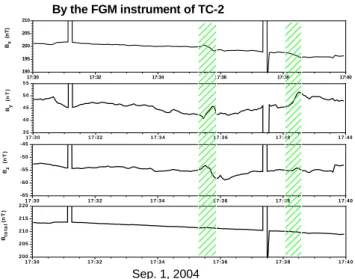
17:30 17:32 17:34 17:36 17:38 17:40 190 195 200 205 210 1 7 :30 1 7:3 2 1 7:34 1 7:36 1 7 :3 8 17 :4 0 2 00 2 05 2 10 2 15 2 20 Bto ta l (n T ) 1 7 :30 17 :3 2 1 7:34 1 7:36 17 :3 8 1 7:40 -65 -60 -55 -50 -45 Bz ( n T ) 1 7 :3 0 1 7 :3 2 1 7 :3 4 1 7 :3 6 1 7 :3 8 1 7 :4 0 3 5 4 0 4 5 5 0 5 5 By (n T ) Bx ( n T ) By the FGM instrument of TC-2 Sep. 1, 2004
Fig. 3. Magnetic field records recorded by FGM on 1 September 2004. These are,
from top to bottom, the X-component (B
X), Y-component (B
Y), Z-component (B
Z),
and total magnetic field intensity (B
T). The times of the ring particle observations
shown in Fig. 1 are coloured in green.
Fig. 3. Magnetic field records recorded by FGM on 1 September
2004. These are, from top to bottom, the X-component (BX), Y-component (BY), Z-component (BZ), and total magnetic field
in-tensity (BT). The times of the ring particle observations shown in Fig. 1 are coloured in green.
by FGM. The time intervals of the frames under study (shown in Fig. 1) are shaded green on the magnetic field plot presented in Fig. 3. Each magnetic component displayed a transient shift, approximately 5 nT, during the individual ac-cumulation periods. This implies that the magnetic flux tube suffered a distortion at these times. It is noted that, some minutes before the formation of the ring-like structures, mul-tiple magnetic spikes (nT) were recorded by FGM which may have been related to the events considered. These spikes presently require further investigation.
Due to the absence of other energetic particle detectors on-board TC-2, we can only consult the low-energy particle ob-servations made by PEACE (1 eV–1 keV) and LEID (50 eV– 25 keV), and the relatively “high-energy” data from HEED (0.2–0.4 MeV).
2956 L. Lu et al.: Electron pitch angle variations at the high magnetic latitude boundary layer
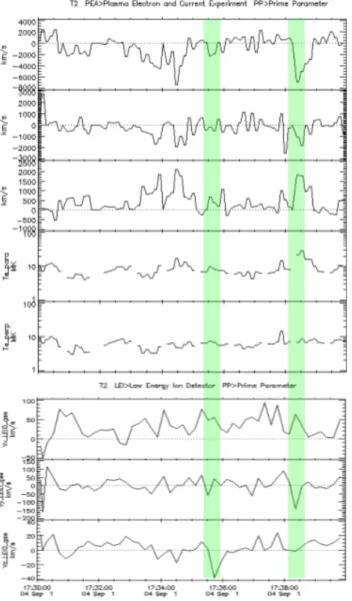
Fig. 4. Low-energy electron data recorded by PEACE on 1 September, 2004 are, from top to bottom/top panel: electron velocity, X-component (VX),
Y-component (VY), Z-component (VZ), the parallel electron temperature (Tpara), and
the perpendicular electron temperature (Tperp). The bottom panel shows, from
top to bottom, ion velocity X-component (VX), Y-component (VY), and
Z-component (VZ) recorded by LEID. The time intervals of the frames under
study (Fig. 1) are shaded in green.
Fig. 4. Low-energy electron data recorded by PEACE on 1
Septem-ber 2004 are, from top to bottom/top panel: electron velocity, X-component (VX), Y-component (VY), Z-component (VZ), the paral-lel electron temperature (Tpara), and the perpendicular electron
tem-perature (Tperp). The bottom panel shows, from top to bottom, ion
velocity X-component (VX), Y-component (VY), and Z-component
(VZ) recorded by LEID. The time intervals of the frames under
study (Fig. 1) are shaded in green.
In the PEACE data, nearly field-aligned, high speed, elec-tron beams (Vx=−2300 km/s and Vx=−7000 km/s) were
ob-served at the times of both the selected frames (Fig. 1) There was no obvious event in the corresponding LEID data (see Fig. 4, green shading). During the concerned periods, the parallel electron temperature was higher than the perpendicu-lar electron temperature. The omni-directional flux of (49.2– 125 keV) electrons recorded by NUADU in Energy Chan-nel 3 is compared in Fig. 5 with the corresponding high en-ergy electron flux (0.2–0.4 MeV) recorded by HEED. There is no significant correlation between these records and it can, thereby, be deduced that the up-flowing electron beams with energies <100 keV, spiralling around the field lines to form
17:30 17:32 17:34 17:36 17:38 17:40 101 102 103 104 105 Fl ux (c m -2sr -1s -1) Sep. 1, 2004 Omnidirectional flux by the NUADU instrument energy band 3
Electron flux by the HEED instrument (0.2-0.4 MeV)
Fig.5. The omnidirectional flux of electrons (black line) observed by the NUADU instrument in Energy Channel 3 (49.2-125 keV), and the high energy (0.2 – 0.4 MeV) omnidirectional electron flux (red line) simultaneously observed by the HEED instrument, on 1 September, 2004. The vertical black lines indicate the periods of the frames under study (Fig. 1).
4. The evolution of a dumbbell-type PAD
On 4 September, 2004 from 13:55:14 UT to 13:56:19 UT, the NUADU instrument recorded a sequence of 5 frames in Energy Channel 3, in the course of which particles flowed along, rather than were distributed around, a magnetic field line (see Fig. 6, left side which shows the time sequence from top to bottom). The corresponding PAD plots are displayed on the right side of Fig. 6. Each frame in Figure 6 was integrated over 4 spins, and the accumulation time for each pixel was 0.125s. In contrast to what is seen in Fig.1, there is no trace of a normal PAD background in these data. Fig. 7 shows the location of the TC-2 satellite at the time the frames displayed in Figure 6 were recorded. During the more than one minute time interval concerned, a negative magnetic pulse with an amplitude of about 7 nT (Fig. 8) was recorded in ambient magnetic field data. It evolved such that, at 13:55:18 UT, the Y-component of the magnetic field increased by 20 nT. Then, at 13:55:22 UT, the X-component of the field decreased by 5 nT. Finally, at 13:55:26 UT, the Z-component also decreased by 17 nT. The change in the Z-component of the magnetic field resembles that of the Y-components, but after an 8 second delay.
During the decrease in the magnetic field, the colour of the frame background in the particle data changed from orange to green (central frame) and returned to orange as the magnetic field again increased (middle to bottom frame). The mean particle fluxes associated with the orange and green pixels were, respectively 3.2×105 cm-2sr-1s-1 and 1.8×105 cm-2sr-1s-1. The loss cone areas that appear in red (mean flux per pixel 6.4×105 cm-2sr-1s-1), initially narrowed towards the field line and,
thereafter, were restored. This implies the behaviour of charged particles under circumstances where the first adiabatic invariant (µ=E /⊥ B) was conserved.
Fig. 5. The omnidirectional flux of electrons (black line) observed
by the NUADU instrument in Energy Channel 3 (49.2–125 keV), and the high energy (0.2–0.4 MeV) omnidirectional electron flux (red line) simultaneously observed by the HEED instrument, on 1 September 2004. The vertical black lines indicate the periods of the frames under study (Fig. 1).
ring-like particle distributions, are not influenced by simulta-neously up-flowing, high energy, electrons.
4 The evolution of a dumbbell-type PAD
On 4 September 2004 from 13:55:14 UT to 13:56:19 UT, the NUADU instrument recorded a sequence of 5 frames in Energy Channel 3, in the course of which particles flowed along, rather than being distributed around, a magnetic field line (see Fig. 6, left side which shows the time sequence from top to bottom). The corresponding PAD plots are displayed on the right side of Fig. 6. Each frame in Fig. 6 was integrated over 4 spins, and the accumulation time for each pixel was 0.125 s. In contrast to what is seen in Fig. 1, there is no trace of a normal PAD background in these data.
Figure 7 shows the location of the TC-2 satellite at the time the frames displayed in Fig. 6 were recorded. During the more than one-minute time interval concerned, a nega-tive magnetic pulse with an amplitude of about 7 nT (Fig. 8) was recorded in ambient magnetic field data. It evolved such that, at 13:55:18 UT, the Y-component of the magnetic field increased by 20 nT. Then, at 13:55:22 UT, the X-component of the field decreased by 5 nT. Finally, at 13:55:26 UT, the Z-component also decreased by 17 nT. The change in the Z-component of the magnetic field resembles that of the Y-components, but after an 8-s delay.
During the decrease in the magnetic field, the colour of the frame background in the particle data changed from or-ange to green (central frame) and returned to oror-ange as the magnetic field again increased (middle to bottom frame). The mean particle fluxes associated with the orange and green pixels were, respectively, 3.2×105cm−2sr−1s−1and 1.8×105cm−2sr−1s−1. The loss cone areas that appear in red (mean flux per pixel 6.4×105cm−2sr−1s−1), initially narrowed towards the field line and, thereafter, were restored. This implies the behaviour of charged particles under cir-cumstances where the first adiabatic invariant (µ=E⊥/B)
L. Lu et al.: Electron pitch angle variations at the high magnetic latitude boundary layer 2957 17:30 17:32 17:34 17:36 17:38 17:40 101 102 103 104 Fl ux ( c m -2 sr -1 s -1 ) Sep. 1, 2004 Omnidirectional flux by the NUADU instrument energy band 3
Electron flux by the HEED instrument (0.2-0.4 MeV)
Fig.5. The omnidirectional flux of electrons (black line) observed by the NUADU instrument in
Energy Channel 3 (49.2-125 keV), and the high energy (0.2 – 0.4 MeV) omnidirectional electron
flux (red line) simultaneously observed by the HEED instrument, on 1 September, 2004. The
vertical black lines indicate the periods of the frames under study (Fig. 1).
Fig. 6. NUADU data frames (left side) and local PAD plots (right side) for the interval 13:55:14 UT
to 13:56:19 UT on 4 September, 2004. The data show, from top to bottom, the evolution of
dumbbell-type PADs, where each abscissa (left side) covers 128 azimuths, with 2.8125º to each
pixel, and each ordinate (left side) covers 16 elevations, with 11.25º to each pixel. The colour scales
on the top illustrate the particle counts in each pixel. The flux peaks in each local PAD plot (right
panels) correspond to the red areas in the frames on the left.
Fig. 6. NUADU data frames (left side) and local PAD plots (right side) for the interval 13:55:14 UT to 13:56:19 UT on 4 September 2004.
The data show, from top to bottom, the evolution of dumbbell-type PADs, where each abscissa (left side) covers 128 azimuths, with 2.8125◦ to each pixel, and each ordinate (left side) covers 16 elevations, with 11.25◦to each pixel. The colour scales on the top illustrate the particle counts in each pixel. The flux peaks in each local PAD plot (right panels) correspond to the red areas in the frames on the left.
Electrons flowing upwards along the magnetic field line were recorded by the PEACE instrument (Fig. 9). At 13:55:18 UT, the Y-component of the electron beam ex-perienced a sudden injection of particles having veloc-ity VY=−1482 km/s. Thereafter, three further high
veloc-ity electron beam enhancements occurred (at 13:55:26 UT,
Vx=−4307 km/s; at 13:55:42 UT, Vx=−766 km/s; and at
13:56:07 UT, Vx=−1232 km/s). During this active interval,
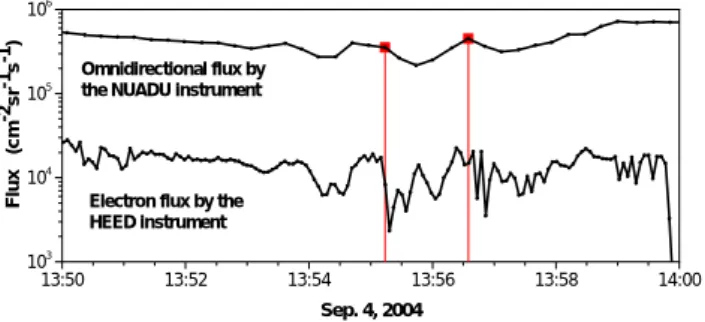
the parallel electron temperature was much higher than the perpendicular electron temperature. The variability of elec-tron fluxes recorded by the HEED instrument (energy range 0.2 to 0.4 MeV) was consistent with the omnidirectional flux observed by the NUADU instrument in Energy Channel 3 for electrons (49.2–125 keV); see Fig. 10. However, the time res-olution of NUADU was 16 s, so that any variability present within this interval would have been smoothed considerably.
The particle observations and comparisons described above indicate that the main component of the dumbbell-type PAD was provided by electron beams covering a rather wide energy region from hundreds of eV to hundreds of keV.
5 Discussion and conclusion
Usually, PADs are observed either with maximum close to 90◦, or expanding to the edge of the loss-cone with a pancake-type distribution. The two abnormal PAD events presented above (Fig. 6) are related to up-flowing electron beams. These cases are different than the event described in Sect. 3, concerning a unidirectional electron beam with a normal PAD background, whereas the event described in Sect. 4 concerns a bidirectional electron beam without a nor-mal PAD background.
2958 L. Lu et al.: Electron pitch angle variations at the high magnetic latitude boundary layer 2 1 0 -1 -2 -3 -4 -5 -1 0 1 2 3 4 5 6 ZGSE ( RE ) B XGSE (RE) Sep. 4, 2004 2 1 0 -1 -2 -3 -4 -5 2 1 0 -1 -2 -3 -4 YGS E (R E ) XGSE (RE) Sep. 4, 2004 B
Fig. 7.The location of TC-2 in the Z-X plane (left panel) and in the Y-X plane (right
panel) in the GSE system.
Dotted lines indicate the orbit of the spacecraft. The red
heavy line shows the position of the spacecraft when the frames displayed in Fig. 6
were recorded. Black arrows indicate the magnetic field direction and red arrows the
direction of motion of the spacecraft at that time.
13:50 13:52 13:54 13:56 13:58 14:00 230 240 13:50 13:52 13:54 13:56 13:58 14:00 220 230 240 13:50 13:52 13:54 13:56 13:58 14:00 -20 -10 Bz (nT) 13:50 13:52 13:54 13:56 13:58 14:00 10 20 30 By (nT) Bx (n T ) Bto tal (nT) 20040904 By the FGM instrument of TC-2
Fig. 8. Magnetic field plots obtained by FRM on 4 September, 2004 comprise, from
top to bottom, the magnetic field X-component (B
X), the Y-component (B
Y), the
Z-component (B
Z), and the total magnetic field intensity (B
T). The time intervals of the
frame under study (Fig. 6) is coloured in green.
Fig. 7. The location of TC-2 in the Z-X plane (left panel) and in the Y-X plane (right panel) in the GSE system. Dotted lines indicate the
orbit of the spacecraft. The red heavy line shows the position of the spacecraft when the frames displayed in Fig. 6 were recorded. Black arrows indicate the magnetic field direction and red arrows the direction of motion of the spacecraft at that time.
2 1 0 -1 -2 -3 -4 -5 -1 0 1 2 3 4 5 6 ZGSE ( RE ) B XGSE (RE) Sep. 4, 2004 2 1 0 -1 -2 -3 -4 -5 2 1 0 -1 -2 -3 -4 YGS E (R E ) XGSE (RE) Sep. 4, 2004 B
Fig. 7.The location of TC-2 in the Z-X plane (left panel) and in the Y-X plane (right
panel) in the GSE system.
Dotted lines indicate the orbit of the spacecraft. The red
heavy line shows the position of the spacecraft when the frames displayed in Fig. 6
were recorded. Black arrows indicate the magnetic field direction and red arrows the
direction of motion of the spacecraft at that time.
13:50 13:52 13:54 13:56 13:58 14:00 230 240 13:50 13:52 13:54 13:56 13:58 14:00 220 230 240 13:50 13:52 13:54 13:56 13:58 14:00 -20 -10 Bz (nT) 13:50 13:52 13:54 13:56 13:58 14:00 10 20 30 By (nT) Bx (n T ) Bto tal (nT) 20040904 By the FGM instrument of TC-2
Fig. 8. Magnetic field plots obtained by FRM on 4 September, 2004 comprise, from
top to bottom, the magnetic field X-component (B
X), the Y-component (B
Y), the
Z-component (B
Z), and the total magnetic field intensity (B
T). The time intervals of the
frame under study (Fig. 6) is coloured in green.
Fig. 8. Magnetic field plots obtained by FRM on 4 September 2004
comprise, from top to bottom, the magnetic field X-component (BX), the Y-component (BY), the Z-component (BZ), and the to-tal magnetic field intensity (BT). The time intervals of the frame
under study (Fig. 6) is coloured in green.
The magnetic field intensity showed no changes during the event described in Sect. 3, but only a small distortion of the magnetic flux tube. During the evolution (over one minute) of the event described in Sect. 4, a negative magnetic pulse with an amplitude of about 7 nT propagated towards the Earth. PEACE recorded only up-flowing electron beams at low energies at this time but the particle images observed by NUADU indicate the presence of bidirectional electron beams flowing symmetrically along the magnetic field lines.
13:50 13:52 13:54 13:56 13:58 14:00 -5000 -4000 -3000 -2000 -1000 0 1000 2000 13:50 13:52 13:54 13:56 13:58 14:00 10 20 30 40 50 Vel ec tr on ( m k /s) Sep. 4, 2004 Vx Vz T e para Tel ectr o n ( M K )
By the PEACE instrument of TC-2
Vy
T
e perp
Fig. 9. Low-energy electron velocity and temperature data recorded by the PEACE
instrument aboard TC-2 on 4 September, 2004. The top panel shows three components
of the electron velocity, where the X-component is in black, the Y-component in red,
and the Z-component in green. The bottom panel shows the parallel electron
temperature (black), and the perpendicular electron temperature (red). The period
covered by the data under study (Fig. 6) is shaded in green.
13:50 13:52 13:54 13:56 13:58 14:00 103 104 105 106 Fl ux ( c m -2sr -1s -1) Sep. 4, 2004 Omnidirectional flux by the NUADU instrument
Electron flux by the HEED instrument
Fig. 10.
The omnidirectional electron flux (top line) recorded by NUADU in
Energy Channel 3 (49.2-125 keV) on 4 September, 2004, and the corresponding high
energy (0.2 – 0.4 MeV), omnidirectional, electron flux (bottom line) observed by the
HEED instrument. The vertical red lines indicate the period of the observations under
study (Fig. 6).
5. Discussion and Conclusion
Usually, PADs are observed either with maximum near to 90
0, or expanding to the edge of the
loss-cone with a pancake-type distribution. The two abnormal PAD events presented above (Fig. 6),
are related to up-flowing electron beams. These cases are different to that the event described in
Section 3 concerns a unidirectional electron beam with a normal PAD background, whereas the
event described in Section 4 concerns a bidirectional electron beam without a normal PAD
background.
Fig. 9. Low-energy electron velocity and temperature data recorded
by the PEACE instrument aboard TC-2 on 4 September 2004. The top panel shows three components of the electron velocity, where the X-component is in black, the Y-component in red, and the Z-component in green. The bottom panel shows the parallel elec-tron temperature (black), and the perpendicular elecelec-tron tempera-ture (red). The period covered by the data under study (Fig. 6) is shaded in green.
The area of the electron PAD of the up-flowing (red pix-els in the central part of Fig. 6) at first narrowed in the di-rection of the field line, and then was partly restored. This implies that there must have been a magnetic mirror point (labelled MP in Fig. 11) not far from the location sampled, which temporarily separated the original magnetic bottle into two parts (regions I and II in the same figure). The tempo-rary magnetic mirror point formed could reflect up-flowing electron beams. Also, it could prevent particles with large pitch angles from entering region II from region I, with the
L. Lu et al.: Electron pitch angle variations at the high magnetic latitude boundary layer 2959 13:50 13:52 13:54 13:56 13:58 14:00 -5000 -4000 -3000 -2000 -1000 0 1000 13:50 13:52 13:54 13:56 13:58 14:00 10 20 30 40 50 Vel ec tr on ( m k /s) Sep. 4, 2004 Vx Vz T e para Tel ectr o n ( M K ) Vy T e perp
Fig. 9. Low-energy electron velocity and temperature data recorded by the PEACE
instrument aboard TC-2 on 4 September, 2004. The top panel shows three components
of the electron velocity, where the X-component is in black, the Y-component in red,
and the Z-component in green. The bottom panel shows the parallel electron
temperature (black), and the perpendicular electron temperature (red). The period
covered by the data under study (Fig. 6) is shaded in green.
13:50 13:52 13:54 13:56 13:58 14:00 103 104 105 106 Fl ux ( c m -2sr -1s -1) Sep. 4, 2004 Omnidirectional flux by the NUADU instrument
Electron flux by the HEED instrument
Fig. 10.
The omnidirectional electron flux (top line) recorded by NUADU in
Energy Channel 3 (49.2-125 keV) on 4 September, 2004, and the corresponding high
energy (0.2 – 0.4 MeV), omnidirectional, electron flux (bottom line) observed by the
HEED instrument. The vertical red lines indicate the period of the observations under
study (Fig. 6).
5. Discussion and Conclusion
Usually, PADs are observed either with maximum near to 90
0,
or expanding to the edge of the
loss-cone with a pancake-type distribution. The two abnormal PAD events presented above (Fig. 6),
are related to up-flowing electron beams. These cases are different to that the event described in
Section 3 concerns a unidirectional electron beam with a normal PAD background, whereas the
event described in Section 4 concerns a bidirectional electron beam without a normal PAD
background.
Fig. 10. The omnidirectional electron flux (top line) recorded by
NUADU in Energy Channel 3 (49.2–125 keV) on 4 September 2004, and the corresponding high energy (0.2–0.4 MeV), omnidi-rectional, electron flux (bottom line) observed by the HEED instru-ment. The vertical red lines indicate the period of the observations under study (Fig. 6).
The magnetic field intensity showed no changes during the event described in Section 3, but
only a small distortion of the magnetic flux tube. During the evolution (over one minute) of the event
described in Section 4, a negative magnetic pulse with an amplitude of about 7 nT propagated
towards the Earth. PEACE recorded only up-flowing electron beams at low energies at this time but
the particle images observed by NUADU indicate the presence of bidirectional electron beams
flowing symmetrically along the magnetic field lines.
The area of the electron PAD of the up-flowing (red pixels in the central part of Fig. 6) at first
narrowed in the direction of the field line, and then was partly restored.
This implies that there must
have been a magnetic mirror point (labelled MP in Fig. 12), not far from the location sampled, which
temporarily separated the original magnetic bottle into two parts ( regions I and II in the same figure).
The temporary magnetic mirror point formed could reflect up-flowing electron beams. Also, it could
prevent particles with large pitch angles from entering region II from region I, with the result that the
PAD maps imaged by NUADU did not show a normal PAD background in region II. If we assume
that the temporary magnetic mirror point moved Earthward, due to the magnetic pulse that
propagated along the magnetic field line, so that the reflection distance of the keV electron beam
was reduced, this process would, in effect, constitute a magnetic pump to accelerate these electrons
by the Fermi acceleration mechanism. The central red area in the PADs shown in Fig. 6 which are
concentrated in the direction of the field line, may indeed comprise evidence of such electron
acceleration.
Fig. 11. Schematic illustrating nested magnetic bottles, where the new mirror
point (MP) in the magnetic field produced due to the propagation Earthward of
a magnetic pulse, separates the dipole magnetic field into two regions (labelled I
and II).
To summarize the account of abnormal PAD events provided above, it was found that a magnetic
field line could be easily deformed from its typical, dipolar, configuration near the HMLBL during
geomagnetic activity. When magnetic flux tube variations were transient, so that the original total
magnetic field intensity was restored, a pancake-type PAD background was present in the PAD
particle map. When the disturbance was strong enough to cause the total magnetic field intensity to
show a sustained change, the single magnetic bottle of a dipole magnetic field developed to form a
nested pair. In this case, no pancake-type PAD background was observed in the PAD particle map,
Further examples of these effects should now be studied.
The formation of a nested magnetic bottle is important with regard to potential particle
acceleration, and the viewing capability of the NUADU instrument offers the opportunity to
investigate further cases where this configuration is present.
Fig. 11. Schematic illustrating nested magnetic bottles, where the
new mirror point (MP) in the magnetic field produced due to the propagation earthward of a magnetic pulse, separates the dipole magnetic field into two regions (labelled I and II).
result that the PAD maps imaged by NUADU did not show a normal PAD background in region II. If we assume that the temporary magnetic mirror point moved earthward, due to the magnetic pulse that propagated along the magnetic field line, so that the reflection distance of the keV electron beam was reduced, this process would, in effect, constitute a mag-netic pump to accelerate these electrons by the Fermi accel-eration mechanism. The central red area in the PADs shown in Fig. 6, which are concentrated in the direction of the field line, may indeed comprise evidence of such electron acceler-ation.
To summarize the account of abnormal PAD events pro-vided above, it was found that a magnetic field line could be easily deformed from its typical dipolar configuration near the HMLBL during geomagnetic activity. When magnetic flux tube variations were transient, so that the original total magnetic field intensity was restored, a pancake-type PAD background was present in the PAD particle map. When the disturbance was strong enough to cause the total magnetic field intensity to show a sustained change, the single mag-netic bottle of a dipole magmag-netic field developed to form a nested pair. In this case, no pancake-type PAD background
was observed in the PAD particle map. Further examples of these effects should now be studied.
The formation of a nested magnetic bottle is important with regard to potential particle acceleration, and the view-ing capability of the NUADU instrument offers the opportu-nity to investigate further cases where this configuration is present.
Acknowledgements. This study was supported by the Chinese Na-tional Natural Science Foundation Committee grant 40390153, 40125012, and VEGA grant agency project 4064. S. McKenna-Lawlor acknowledges with appreciation the support of Enterprise Ireland.
Topical Editor T. Pulkkinen thanks T. A. Fritz and another ref-eree for their help in evaluating this paper.
References
Asnes, A., Friedel, R. W. H., Stadsnes, J., Thomsen, M., Østgaard, N., and Cayton, T.: Statistical pitch angle properties of sub-storm injected electron clouds and their relation to dawnside energetic electron precipitation, J. Geophys.Res., 110, A05207, doi:10.1029/2004JA010838, 2005.
Boscher, D., Bourdarie, S., Thorne, R. M., and Abel, B.: Influence of the wave characteristics on the electron radiation belt distribu-tion, Adv. Space Res., 26, 163–166, 2000.
Friedel, R. H. W., Reeves, G. D., and Obara, T.: Relativistic electron dynamics in the inner magnetosphere – a review, J. Atmos. Solar Terr. Phys. 64, 265–282, 2002.
Fujimoto, M. and Nishida, A.: Energization and anisotropization of energetic electrons in the Earth’s radiation belt by the recircula-tion process, J. Geophys. Res., 95, 4265–4270, 1990.
Green, J. C and Kivelson, M. G.: Relativistic electrons in the outer radiation belt: differentiating between acceleration mechanisms, J. Geophys. Res., 109, A03213, doi:10.1029/2003JA010153, 2004.
Liu, W. W., Rostoker, G., and Baker, D. N.: Internal acceleration of relativistic electrons by large-amplitude ULF pulsations, J. Geo-phys. Res., 104 , 17 391–17 407, 1999.
McKenna-Lawlor, S., Balaz, J., Barabash, S., Johnsson, K., Lu, L., Shen, C., Shi, J. Q., Zong, Q. G., Kudela, K., Fu, S. Y., Roelof, E. C., Brandt, P. C., and Dandouras, I.: The energetic NeUtral Atom Detector Unit (NUADU) for China’s Double Star Mission and its calibration, Nuclear Inst. & Methods, A(503) 311–322, 2004.
Williams, D. J.: Energetic ion beams at the edge of the plasma sheet: ISEE 1 observations plus a simple explanatory model, J. Geo-phys. Res., 86, A7, 5507–5518, 1981.