HAL Id: hal-02164586
https://hal.inria.fr/hal-02164586v2
Submitted on 29 Jul 2019HAL is a multi-disciplinary open access archive for the deposit and dissemination of sci-entific research documents, whether they are pub-lished or not. The documents may come from teaching and research institutions in France or abroad, or from public or private research centers.
L’archive ouverte pluridisciplinaire HAL, est destinée au dépôt et à la diffusion de documents scientifiques de niveau recherche, publiés ou non, émanant des établissements d’enseignement et de recherche français ou étrangers, des laboratoires publics ou privés.
EEG evidence of compensatory mechanisms in
preclinical Alzheimer’s disease
Sinead Gaubert, Federico Raimondo, Marion Houot, Marie-Constance Corsi,
Jacobo Diego Sitt, Bertrand Hermann, Delphine Oudiette, Geoffroy Gagliardi,
Marie-Odile Habert, Bruno Dubois, et al.
To cite this version:
Sinead Gaubert, Federico Raimondo, Marion Houot, Marie-Constance Corsi, Jacobo Diego Sitt, et al.. EEG evidence of compensatory mechanisms in preclinical Alzheimer’s disease. Brain - A Journal of Neurology , Oxford University Press (OUP), 2019, �10.1093/brain/awz150�. �hal-02164586v2�
Title:
Full title: EEG evidence of compensatory mechanisms in preclinical Alzheimer’s disease Short title: EEG biomarkers of preclinical Alzheimer
Authors:
Sinead Gaubert,1,2,6,§ Federico Raimondo,1,3,4,5,§ Marion Houot,6,7,8 Marie-Constance Corsi,1,2
Lionel Naccache,1,9 Jacobo Diego Sitt,1 Bertrand Hermann1, Delphine Oudiette,10,11 Geoffroy
Gagliardi,1,6 Marie-Odile Habert,12,13,14 Bruno Dubois,1,6 Fabrizio De Vico Fallani,1,2 Hovagim
Bakardjian,1,6,# Stéphane Epelbaum,1,2,6,# for the Alzheimer’s Disease Neuroimaging Initiative*,
the MEMENTO study group and the INSIGHT-preAD study group
§: Both authors contributed equally to this work
#: Both authors contributed equally to this work
*Data used in preparation of this article were obtained from the Alzheimer’s Disease Neuroimaging Initiative (ADNI) database (adni.loni.usc.edu). As such, the investigators within the ADNI contributed to the design and implementation of ADNI and/or provided data but did not participate in analysis or writing of this report. A complete listing of ADNI investigators can be found at: http://adni.loni.usc.edu/wp-content/uploads/how_to_apply/ADNI_Acknowledgement_List.pdf
1. Institut du Cerveau et de la Moelle épinière, ICM, Inserm U 1127, CNRS UMR 7225, Sorbonne Université, F-75013, Paris, France
2. Inria, Aramis project-team, F-75013, Paris, France
3. Laboratorio de Inteligencia Artificial Aplicada, Departamento de computación, FCEyN, Universidad de Buenos Aires, Argentina
4. GIGA Consciousness, University of Liège, Liège, Belgium
5. Coma Science Group, University Hospital of Liège, Liège, Belgium
6. AP-HP, Hôpital Pitié-Salpêtrière, Institute of Memory and Alzheimer’s Disease (IM2A), Centre of excellence of neurodegenerative disease (CoEN), Department of Neurology, F75013, Paris, France
7. Center for Clinical Investigation (CIC) Neurosciences, Institut du cerveau et la moelle (ICM), F75013, Paris, France
8. Sorbonne Université, AP-HP, GRC n° 21, Alzheimer Precision Medicine (APM), Hôpital de la Pitié-Salpêtrière, Boulevard de l'Hôpital, F-75013, Paris, France
9. AP-HP, Groupe hospitalier Pitié-Salpêtrière, Department of Neurophysiology, Paris, F-75013, France
10. AP-HP, Hôpital Pitié-Salpêtrière, Service des Pathologies du Sommeil (Département "R3S"), F-75013 Paris, France.
11. Sorbonne Université, IHU@ICM, INSERM, CNRS UMR 7225, équipe MOV'IT, F-75013 Paris, France.
12. Laboratoire d’Imagerie Biomédicale, Sorbonne Universités, UPMC Univ Paris 06, Inserm U1146, CNRS UMR 7371, Paris, France
13. AP-HP, Hôpital Pitié-Salpêtrière, Department of Nuclear Medicine, Paris, F-75013, France
14. Centre d’Acquisition et de Traitement des Images, CATI neuroimaging platform, France (www.cati-neuroimaging.com)
Correspondence to: Stéphane Epelbaum, MD, PhD
Hôpital Pitié-Salpêtrière, Institute of Memory and Alzheimer’s Disease (IM2A), Department of Neurology, 47-83 Boulevard de l’Hôpital, F75013, Paris, France.
Abstract:
Early biomarkers are needed to identify individuals at high risk of preclinical Alzheimer’s disease and to better understand the pathophysiological processes of disease progression. Preclinical Alzheimer’s disease electroencephalography (EEG) changes would be non-invasive and cheap screening tools and could also help to predict future progression to clinical Alzheimer’s disease. However, the impact of amyloid-beta deposition and neurodegeneration on EEG biomarkers needs to be elucidated. We included participants from the INSIGHT-preAD cohort, which is an ongoing single-center multimodal observational study, that was designed to identify risk factors and markers of progression to clinical Alzheimer’s disease in 318 cognitively normal individuals aged 70–85 years with a subjective memory complaint. We divided the subjects into four groups, according to their amyloid status (based on 18F-florbetapir PET) and neurodegeneration status (evidenced by ¹⁸F-fluorodeoxyglucose PET brain metabolism in Alzheimer’s disease-signature regions). The first group was amyloid positive and neurodegeneration positive, which corresponds to stage 2 of preclinical Alzheimer’s disease. The second group was amyloid positive and neurodegeneration negative, which corresponds to stage 1 of preclinical Alzheimer’s disease. The third group was amyloid negative and neurodegeneration positive, which corresponds to “suspected non-Alzheimer’s pathophysiology”. The last group was the control group, defined by amyloid negative and neurodegeneration negative subjects. We analysed 314 baseline 256-channel high-density eyes-closed 1-minute resting-state EEG recordings. EEG biomarkers included spectral measures, algorithmic complexity and functional connectivity assessed with a novel information-theoretic measure, weighted symbolic mutual information. The most prominent effects of neurodegeneration on EEG metrics were localized in fronto-central regions with an increase in high-frequency oscillations (higher beta and gamma power) and a decrease in low-frequency oscillations (lower delta power), higher spectral entropy, higher complexity and increased functional connectivity measured by weighted symbolic mutual information in theta band. Neurodegeneration was associated to a widespread increase of median spectral frequency. We found a non-linear relationship between amyloid burden and EEG metrics in neurodegeneration positive subjects, either following a U-shape curve for delta power or an inverted U-shape curve for the other metrics, meaning that EEG patterns are modulated differently depending on the degree of amyloid burden. This finding suggests initial compensatory mechanisms that are overwhelmed for the highest amyloid load. Together, these results indicate that EEG metrics are useful biomarkers for the preclinical stage of Alzheimer’s disease.
Keywords: Preclinical Alzheimer’s disease; EEG; functional connectivity; neurodegeneration; amyloid load
Abbreviations: A- = amyloid negative; A+ = amyloid positive; Aβ = amyloid-β; AD = Alzheimer’s disease; ADNI = Alzheimer's Disease Neuroimaging Initiative; ApoE = apolipoprotein E; BH-FDR = Benjamini-Hochberg false discovery rate; CN = cognitively normal; DMN = default mode network; EEG = electroencephalography; FC = functional connectivity; FCSRT = Free and Cued Selective Reminding Test; FDG = ¹⁸F-fluorodeoxyglucose; INSIGHT-preAD = Investigation of Alzheimer’s Predictors in Subjective Memory Complainers; MCI = mild cognitive impairment; MEG = magnetoencephalography; MMSE = Mini Mental State Examination; MSF = median spectral frequency; N- = neurodegeneration negative; N+ = neurodegeneration positive; PLV = Phase Locking Value; PSD = power spectral density; SNAP = suspected non-Alzheimer’s pathophysiology; SUVR = standardized uptake value ratio; TFCE = threshold-free cluster enhancement; wPLI = weighted Phase Lag Index; wSMI = weighted symbolic mutual information
Introduction
Alzheimer’s disease (AD) is the most common form of dementia, as it accounts for an estimated 60 to 80 percent of cases. The pathophysiological process of AD begins many years before the onset of symptoms (Bateman et al., 2012; Villemagne et al., 2013). It is essential to diagnose AD as early as possible because patients will be more likely to benefit from disease modifying treatments if treated early in the disease course, before major brain damage has occurred (Sperling et al., 2011). It is therefore important to develop biomarkers that are sensitive to this early, “preclinical” stage of AD even before mild cognitive impairment (MCI) occurs. At the preclinical stage subjects are cognitively unimpaired but show evidence of cortical amyloid-β (Aβ) deposition which is considered to be the most upstream process in the pathological cascade of AD (Jack et al., 2013) and is measured by amyloid PET or decreased amyloid-β1-42 and
amyloid-β1-42 / amyloid-β1-40 ratio in the CSF. Aβ deposition can be associated to pathologic tau
deposits, measured by tau PET or elevated CSF phosphorylated tau and to neurodegeneration that is revealed by elevated CSF total tau, ¹⁸F-fluorodeoxyglucose (¹⁸F-FDG) PET hypometabolism in an AD-like pattern and atrophy on MRI (Jack et al., 2018). Biomarkers for AD are important not only for identifying individuals at high risk of preclinical AD, but also to better understand the pathophysiological processes of disease progression.
The Investigation of Alzheimer’s Predictors in Subjective Memory Complainers (INSIGHT-preAD) study is an ongoing longitudinal observational study which was designed to identify risk factors and markers of progression to clinical AD in 318 cognitively normal (CN) individuals with a subjective memory complaint (Dubois et al., 2018). Among the several multimodal assessments, EEGs were performed every 12 months. In our study we focused on the analysis of baseline EEG, aiming to identify electrophysiological biomarkers, including functional connectivity (FC), that are sensitive to the preclinical stage of AD. EEG has many advantages as it is a non-invasive, cheap and reproducible technique, that directly measures neural activity with a good temporal resolution.
There is already a rich literature on the use of EEG biomarkers in MCI and AD, such as spectral measures and synchronization between brain regions (Babiloni et al., 2016). Patients with AD or MCI usually show slowing of oscillatory brain activity, reduced EEG complexity and reduced synchrony (Grunwald et al., 2001; Jeong, 2004; Babiloni et al., 2010; Stam, 2010). Decreased alpha power correlated with hippocampal atrophy and lower cognitive status (Babiloni et al., 2006, 2009; Luckhaus et al., 2008). Growing evidence show that AD targets cortical neuronal networks related to cognitive functions, which is revealed by the impairment in FC in long range networks (Babiloni et al., 2016). There are several types of measures of FC using EEG or magnetoencephalography (MEG) including spectral coherence, synchronization likelihood or information theory indexes. A decrease of alpha coherence, an increase of delta total coherence and an abnormal alpha fronto-parietal coupling have been described in AD (Jelic et al., 2000; Babiloni et al., 2009). A reduction of alpha and beta synchronization likelihood was shown in MCI and AD (Stam et al., 2003). However, the usefulness of EEG characteristics as biomarkers for the evaluation of preclinical AD is not yet fully established, as most studies have focused on EEG biomarkers at later stages of the disease, after the onset of symptoms. One recent study of the preclinical and prodromal stages of AD using MEG demonstrated that the effects of Aβ deposition were expressed as a prefrontal alpha power increment (Nakamura et al., 2018). An EEG study in older people with subjective memory complaints found no association between cortical amyloid load and FC (Teipel et al., 2018), whereas another study using MEG in CN individuals at risk for AD showed altered FC in the default mode network (DMN) (Nakamura et al., 2017). These results suggest that spectral power and FC, as measured by MEG or EEG, could potentially be sensitive biomarkers for the preclinical stage of AD, but more studies are needed in this field. Moreover, very few studies of early stages of AD consider neurodegeneration information when selecting subjects, whereas
it has been suggested that studies combining an abnormal amyloid biomarker with an abnormal neurodegeneration biomarker provide much more powerful prediction of future cognitive decline and conversion to clinical AD than studies focusing on an abnormal amyloid status alone (Knopman et al., 2013; Vos et al., 2013; Wirth et al., 2013; Mormino et al., 2014; Toledo
et al., 2014; Burnham et al., 2016; Soldan et al., 2016).
Our aim was to analyse EEG changes that take place in subjects at high risk of preclinical AD and to assess the impact of amyloid load and AD topography-specific neurodegeneration on EEG metrics. In order to evaluate if EEG metrics’ changes were a consequence of neurodegeneration, amyloid burden, or a combination of the two, we divided the whole INSIGHT-preAD cohort into four groups of subjects depending on their amyloid status (evidenced by 18F-florbetapir PET) and neurodegeneration status (revealed by ¹⁸F-FDG PET). The first group was amyloid positive and neurodegeneration positive (A+N+), which corresponds to stage 2 of preclinical AD according to (Sperling et al., 2011). The second group was amyloid positive and neurodegeneration negative (A+N-), which corresponds to stage 1 of preclinical AD according to (Sperling et al., 2011). These first two groups belong to Alzheimer’s disease continuum according to (Jack et al., 2018). The third group was amyloid negative and neurodegeneration positive (A-N+), which corresponds to “suspected non-Alzheimer’s pathophysiology” (SNAP) (Jack et al., 2012). The last group was the control group, defined by amyloid negative and neurodegeneration negative subjects (A-N-). We hypothesized that amyloid positive and/or neurodegeneration positive subjects would present specific EEG patterns and FC differences compared to controls. Moreover, we hypothesized that these EEG patterns would be modulated differently depending on the degree of severity of amyloid burden or hypometabolism.
To assess functional connectivity, we used weighted symbolic mutual information (wSMI) which is a novel measure to quantify global information sharing that was introduced to index consciousness in patients recovering from a coma (King et al., 2013). The advantages of this information-theoretic measure are its robustness to common-source EEG artifacts and its ability to easily detect non-linear coupling. We decided to focus on wSMI in theta (4-8Hz) and alpha (8-12Hz) bands as the dominant resting state rhythms are typically observed at theta and alpha frequencies and these rhythms show maximum changes in AD patients (Blinowska et al., 2017); moreover, wSMI was shown to better discriminate between different states of consciousness in the theta band (King et al., 2013; Sitt et al., 2014).
The main objective of our research was to identify resting state EEG biomarkers of preclinical AD and SNAP and to evaluate the impact of amyloid burden and neurodegeneration on EEG metrics. Electrophysiological biomarkers included spectral measures, algorithmic complexity and FC assessed with wSMI. The other aims were the exploration of cofactors involved in EEG metrics differences between the two groups, including apolipoprotein E (ApoE) genotype, age, gender, educational level and hippocampal volume.
Materials and methods
INSIGHT-preAD study design and participants
Participants were recruited in the INSIGHT-preAD study cohort at Pitié-Salpêtrière University Hospital, Paris, France. The INSIGHT-preAD study has already been thoroughly described by (Dubois et al., 2018). This cohort currently includes baseline data of 318 CN individuals, between 70 and 85 years old, with subjective memory complaints and unimpaired cognition (Mini Mental State Examination [MMSE] score⩾27 and Clinical Dementia Rating score 0), no evidence of episodic memory deficit (Free and Cued Selective Reminding Test [FCSRT] total recall score⩾41). Demographic, cognitive, functional, biological, genetic, genomic, imaging including brain structural and functional MRI, 18F-FDG PET and 18F-florbetapir PET, electrophysiological and other assessments were performed at baseline and regularly during follow-up. EEGs were performed every 12 months.
The ethics committee of the Pitié-Salpêtrière University Hospital approved the study protocol. Written informed consent according to the Declaration of Helsinki was provided by all participants.
INSIGHT-EEG study participants
On the total of 318 subjects of the INSIGHT-preAD cohort, we analysed baseline EEGs of 314 subjects because the EEG data of three subjects was rejected due to excessive EEG artifacts and one subject did not undergo 18F-FDG PET. Based on amyloid status (evidenced by 18 F-florbetapir PET) and neurodegeneration status (evidenced by 18F-FDG PET brain metabolism in AD-signature regions), we classified the subjects into four groups : A+N+, A+N-, A-N+ and A-N- (control group).
PET acquisition and processing
PET scans were acquired 50 min after injection of 370 MBq (10 mCi) ¹⁸F-florbetapir or 30 min after injection of 2 MBq/kg ¹⁸F-FDG. Reconstructed images were analysed with a pipeline developed by the Centre d’Acquisition et Traitement des Images (http://cati-neuroimaging.com) (Supplementary material). A ¹⁸F-florbetapir-PET standardized uptake value ratio (SUVR) threshold of 0.7918 was used to dichotomize subjects into amyloid positive and negative groups (Dubois et al., 2018; Habert et al., 2018).
The same image-assessment pipeline was applied to measure brain glucose metabolism on ¹⁸F-FDG PET scans. Cortical metabolic indices were calculated in four bilateral regions of interest that are specifically affected by AD (Jack et al., 2012): posterior cingulate cortex, inferior parietal lobule, precuneus, and inferior temporal gyrus, and the pons was used as the reference region. Calculation of the neurodegeneration cut-off value is detailed in Supplementary material. In the INSIGHT-preAD study, subjects were considered neurodegeneration positive if the mean ¹⁸F-FDG PET SUVR of the 4 AD-signature regions was below 2.27.
EEG acquisition and processing
EEG data were acquired with a high-density 256-channel EGI system (Electrical Geodesics Inc., USA) with a sampling rate of 250 Hz and a vertex reference. During the recording, patients were instructed to keep awake and relaxed. The total length of the recording was 2 minutes, during which participants alternated 30 seconds segments of eyes-closed and eyes-open conditions. 60 seconds of eyes-closed resting-state recording were selected for the analysis. For EEG data processing we used a pipeline that automates processing of EEG recordings with automated artifact removal and extraction of EEG measures (Sitt et al., 2014; Engemann et al., 2015, 2018). A band-pass filtering (from 0.5 to 45 Hz) and a notch filter at 50 Hz and 100 Hz were applied. Data were cut into 1 second epochs. Bad channels and bad epochs were rejected with a procedure that is detailed in Supplementary material.
Calculation and analysis of EEG metrics
We analysed 314 high-density 256-channel EEG recordings from INSIGHT-preAD baseline data. For the calculation of EEG metrics, we analysed the values of the first 224 electrodes which are the scalp (non-facial) electrodes. For each recording, we extracted a set of measures organized according to a theory-driven taxonomy (Sitt et al., 2014). Power spectral density
(PSD), median spectral frequency (MSF) and spectral entropy measure dynamics of brain signal at single electrode site and are based on spectral frequency content. Algorithmic complexity estimates the complexity of a signal based on its compressibility. It measures dynamics of brain signal at single electrode site and is based on information theory. wSMI is also an information-theoretic metric and estimates FC between brain regions. For our main analysis, we calculated 10 EEG metrics: PSD in delta (1-4 Hz), theta (4-8 Hz), alpha (8-12 Hz), beta (12-30 Hz), gamma (30-45 Hz), MSF, spectral entropy, algorithmic complexity, wSMI in theta and alpha band. The EEG metrics were averaged across all epochs (60 seconds recording). PSD was normalized as described in (Sitt et al., 2014). In a supplementary analysis, we compared the results of FC measured by wSMI to two additional “traditional” FC metrics, which are Phase Locking Value (PLV) and weighted Phase Lag Index (wPLI) (Supplementary material). All markers were computed using NICE (https://github.com/nice-tools/nice) and MNE-Python (https://github.com/mne-tools/mne-python). The collection of scripts used are publicly available.1
Statistical analysis
Statistical analyses were performed using R software, version 3.5.0. We compared baseline characteristics between the four groups using one-way ANOVA for continuous variables and χ2 test for categorical variables. When global test was significant, post hoc Tukey test was performed for continuous variables and pairwise χ2 test with Benjamini-Hochberg correction for categorical variables, to determine which groups differed from each other.
Local regression of average EEG metrics in function of amyloid SUVR and FDG SUVR First, we used local regression (LOESS) to study the relationship between average EEG metrics (mean value across all scalp electrodes), mean amyloid SUVR and mean 18F-FDG SUVR.
EEG metrics analysis
To study the impact of amyloid load, brain metabolism, age, gender, educational level, ApoE4 and hippocampal volume on EEG metrics, we performed two types of analyses. The first analysis was on the mean value of each metric across all scalp (non-facial) electrodes. The second one was on the value of each metric at each scalp electrode so there were 224 values for
each metric per participant. For wSMI, connectivity measures were summarized by calculating the median value from each electrode to all the other electrodes.
Multiple models were performed to evaluate the impact of main effects and interactions. Type II tests were performed. P-values were corrected for multiple testing on 10 measures with the Benjamini-Hochberg False discovery rate (BH-FDR) procedure.
For the analysis of average EEG metrics, multiple linear regressions were performed. Simple linear regressions were first performed to evaluate if amyloid load or brain metabolism should be included as categorical variables (A+, A-, N+, N-) or as continuous variables (amyloid SUVR, mean 18F-FDG SUVR), by maximizing the coefficient of determination R2, depending on the EEG metrics. The effects of interest were included in multiple models as well as interaction between amyloid load and brain metabolism.
For the analysis of the value of each metric at each electrode, linear mixed models were performed with the effects of interest as fixed effects as well as the electrode number, and the subject as random effect. Interactions between amyloid load, brain metabolism and electrode number were included in the models as well as all two-way interactions between these three effects. We performed a cluster-based permutation test with a threshold-free cluster enhancement (TFCE) method (Smith and Nichols, 2009) to correct for multiple comparisons on 224 electrodes and to see which electrodes showed statistically significant differences for pairwise comparisons between the following groups: A+N+ versus A-N-, A+N- versus A-N-, A-N+ versus A-N-, A+ versus A- and N+ versus N-. Cluster-based permutation test is detailed in Supplementary methods. We generated scalp topographical maps using MNE-Python (Gramfort et al., 2013).
FC analysis at source level
In order to provide anatomically based interpretation of neural activity, we did a source level FC analysis on a representative sample of the four groups of participants (Supplementary material).
Data availability
The data that support the findings of this study are available from the corresponding author, upon reasonable request.
Results
Population baseline characteristics analysis
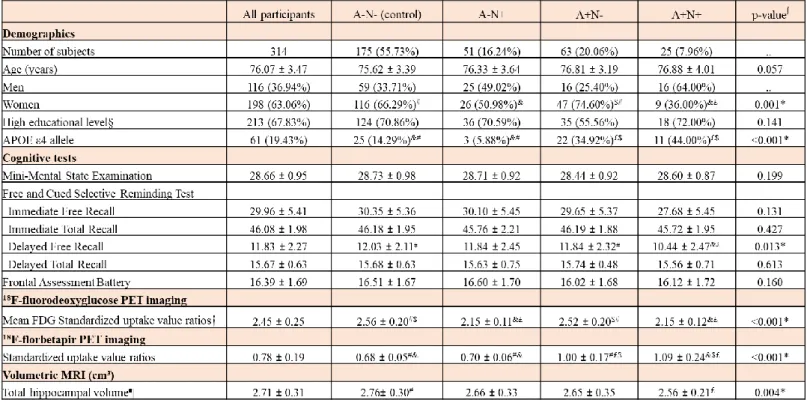
The mean age of all participants was 76.1 years (SD 3.5) and 67.8% of the participants had a high educational level (Table 1). There were no differences between the four groups for age and educational level. There were more women in A-N- (66.3%) and A+N- (74.6%) groups compared to A+N+ group (36.0%). The proportion of ApoE4 carriers was higher in A+N+ and A+N- groups than in A-N+ and A-N- groups (44.0% and 34.9% versus 5.9% and 14.3%, respectively). The four groups did not differ for cognitive scores except for the FCSRT delayed free recall where A+N+ group had significantly lower scores than A+N- and A-N- groups (10.4 [SD 2.5] vs 11.8 [SD 2.3] and 12.0 [SD 2.1], respectively). The mean ¹⁸F-FDG PET SUVR was 2.2 (SD 0.1) in A+N+ group, 2.2 (SD 0.1) in A-N+ group, 2.5 (SD 0.2) in A+N- group and 2.6 (SD 0.2) in A-N- group. The mean amyloid SUVR was 1.1 (SD 0.2) in A+N+ group, 1.0 (SD 0.2) in A+N- group, 0.7 (SD 0.1) in A-N+ group and 0.7 (SD 0.1) in A-N- group. The total hippocampal volume measured on structural MRI was significantly lower in A+N+ subjects compared to A-N- subjects (2.6 [SD 0.2] vs 2.8 [SD 0.3], respectively).
Local regression of average EEG metrics on amyloid SUVR and FDG SUVR
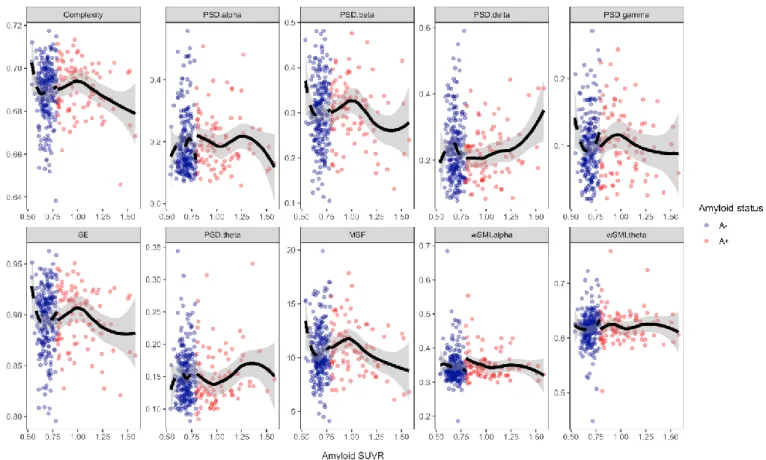
As first exploratory step, we used local regression to study the relationship between average EEG metrics and mean amyloid SUVR (Fig. 1) and mean 18F-FDG SUVR (Fig. 3).
The relationship between amyloid SUVR and PSD delta followed a U-shape curve whereas the relationship between amyloid SUVR and PSD beta, PSD gamma, MSF, spectral entropy and complexity followed an inverted U-shape curve. Amyloid SUVR inflection points values were between 0.96 and 0.98 for all the previous EEG measures. The relationship was less clear between amyloid burden, PSD alpha and PSD theta. The degree of severity of amyloid load did not seem to have an impact on wSMI theta and wSMI alpha. To better understand the relationship between amyloid load and EEG metrics we did local regression of average EEG metrics on amyloid SUVR first for N+ subjects only (Fig. 2) and second for N- subjects only (Supplementary Fig. 1). Interestingly, in N+ subjects, local regression of EEG metrics on amyloid SUVR showed much more obvious inverted U-shape curves for intermediate to very high amyloid load than the previous regression on the whole cohort, for PSD beta, PSD gamma, MSF, spectral entropy, complexity and also for wSMI theta. Moreover, in N+ subjects, the relationship between PSD delta and amyloid SUVR followed a more pronounced U-shape
curve. After exceeding a certain level of amyloid load, complexity, spectral entropy, MSF, PSD beta, PSD gamma and wSMI theta decreased markedly and PSD delta increased noticeably. Amyloid burden did not show any noticeable effect on EEG measures in N- subjects (Supplementary Fig.1). To summarize, the degree of severity of amyloid burden had a strong impact on EEG metrics in the presence of neurodegeneration, with increased high-frequency oscillations for intermediate amyloid burden and a slowing of brain oscillations for high to very high amyloid load.
Local regression of average EEG metrics on mean 18F-FDG SUVR (Fig. 3) showed a trend towards increased complexity, PSD beta, PSD gamma, spectral entropy, MSF and wSMI theta and decreased PSD delta when brain metabolism decreased. The relations between brain metabolism, PSD alpha and PSD theta were less clear. The level of brain metabolism did not seem to have an impact on wSMI alpha. Similar trends were found in local regression of EEG metrics on 18F-FDG SUVR separately for A+ and A- subjects (Supplementary Fig. 2 and
Supplementary Fig. 3). Thus, as a main effect, neurodegeneration in AD-signature regions seemed to increase high-frequency oscillations, complexity, spectral entropy and FC measured by wSMI theta, except when neurodegeneration was associated to very high amyloid load, where the trend of EEG metrics reversed.
Multiple linear regression of average EEG metrics in function of amyloid load and brain metabolism
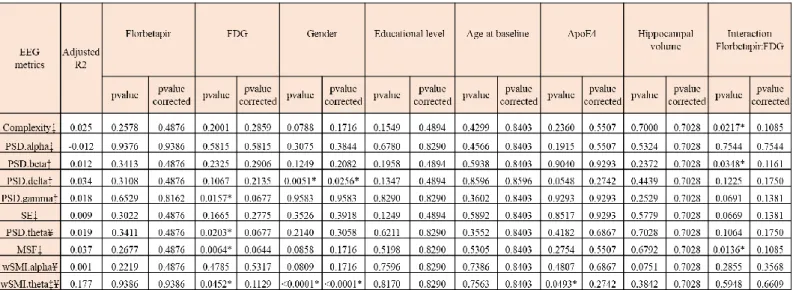
We did multiple linear regression of average EEG metrics on all scalp electrodes to assess the impact of amyloid load and brain metabolism on EEG measures, adjusting on the following potential confounding variables: age, gender, education level, ApoE4 status and hippocampal volume (Table 2).
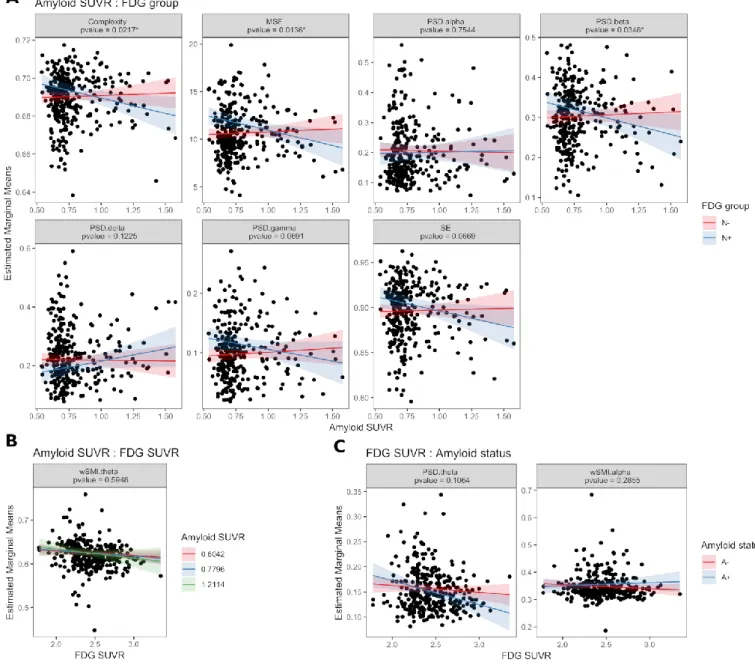
We studied the impact of brain metabolism on EEG metrics (Table 2 and Fig. 4). N+ subjects had higher PSD gamma and higher MSF than N- subjects (P=0.0157 and P=0.0064, respectively). A decrease in mean 18F-FDG SUVR was associated with higher PSD theta and higher wSMI theta (P=0.0203 and P=0.0452, respectively). N+ subjects showed a trend towards higher spectral entropy (P=0.1665) and lower PSD delta (P=0.1067). As previous local regression suggested that amyloid load had an impact on average EEG metrics only in N+ subjects and not in N- subjects, we analysed the interaction between amyloid load and brain metabolism (Table 2 and Fig. 5). There was a significant interaction between amyloid SUVR and neurodegeneration status for complexity (P=0.0217), PSD beta (P=0.0348) and MSF
(P=0.0136) and a trend towards significance for spectral entropy (P=0.0669), PSD gamma (P=0.0691) and PSD delta (P=0.1225). With increasing amyloid load, N+ subjects showed decreased complexity, MSF and PSD beta and presented a trend towards decreased spectral entropy, decreased PSD gamma and increased PSD delta, meaning a slowing of brain oscillations. N+ subjects showed a trend towards higher PSD theta in the presence of amyloid positivity compared to N+A- subjects (P=0.1064). In N-subjects, amyloid load did not appear to have an impact on average EEG metrics. If not considering the interaction between amyloid load and neurodegeneration, amyloid load alone did not show a significant impact on average EEG metrics (Table 2 and supplementary Fig. 4). This supports the fact that amyloid load has an impact on average EEG metrics only if associated to neurodegeneration. Results did not stay statistically significant after multiplicity correction on 10 EEG metrics.
Relationship between average EEG metrics, age, gender, education, ApoE4 and hippocampal volume
Men had higher average wSMI theta corrected P<0.0001) and lower PSD delta (FDR-corrected P=0.0256) compared to women (Table 2). No significant relationship was found between gender and the other EEG metrics (Supplementary Fig. 5). There was no significant relationship between EEG metrics and educational level, age and hippocampal volume. wSMI theta was higher in the presence of ApoE4 genotype (Supplementary Fig. 6) than in the absence of ApoE4 genotype (P=0.0493). No significant relationship was found between ApoE4 and the other EEG metrics.
224 electrodes analysis: topographical differences across EEG measures and groups
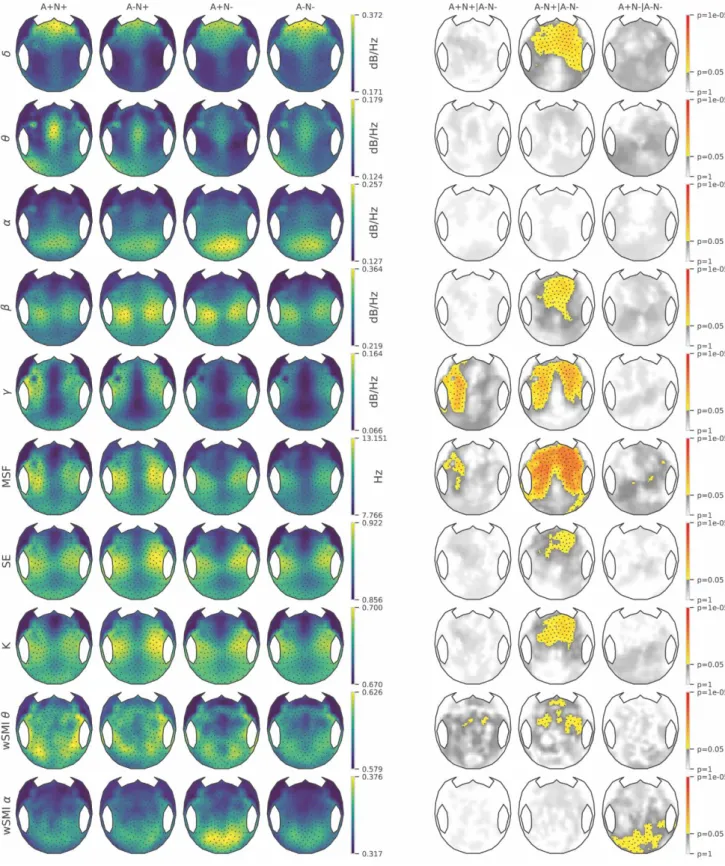
We evaluated topographical differences across EEG measures between the control group (A-N-) and the three other groups (A+N+, A+N- and A-N+) (Supplementary Table 1 and Fig. 6), then between N+ and N- subjects (Supplementary Fig. 7) and finally between A+ and A- subjects (Supplementary Fig. 8). The objectives were to assess the discrimination capacity of the different EEG metrics between groups and to better understand the impact of amyloid and neurodegeneration on EEG measures. All p-values were adjusted on ApoE4 status, gender, education level, age and hippocampal volume.
The A-N+ group showed maximum EEG changes compared to A-N- control group. A-N+ subjects had lower PSD delta in fronto-central regions and right temporal region, higher PSD
beta, complexity, spectral entropy and wSMI theta in fronto-central regions and higher PSD gamma in fronto-central and temporal bilateral regions, compared to A-N- group. The A-N+ group presented a widespread increase of MSF in fronto-central and parieto-temporal regions. Thus, several EEG measures were efficient indices in discriminating A-N+ subjects from A-N- subjects. The A+N+ group showed only an increase in PSD gamma in left fronto-temporal region and a discrete increase in MSF in left temporal region, compared to A-N- group. A+N+ group showed a trend towards increased wSMI theta in centro-parieto-temporal regions but did not reach statistical significance. The A+N- group showed significantly increased wSMI alpha in parieto-occipital regions compared to A-N- group.
We compared the N+ group to the N- group (Supplementary Fig. 7) and found that N+ subjects presented similar EEG changes than the A-N+ group (as described earlier) although the EEG changes were less marked. N+ subjects presented increased MSF in fronto-central and parieto-temporal regions and increased PSD gamma in frontal and parieto-temporal bilateral regions. N+ subjects had a discrete diminution of PSD delta in fronto-central regions and a discrete increase in wSMI theta, spectral entropy and complexity in fronto-central regions. There was a trend toward increased PSD beta in fronto-central regions in N+ subjects but it did not reach statistical significance. MSF and PSD gamma were the most powerful metrics to discriminate between N+ and N- subjects (in Supplementary Table 1, P=0.0093 and P=0.0182 for main effects of MSF and PSD gamma, respectively). Although there was a significant interaction between amyloid status and electrodes for wSMI alpha in a linear mixed model (P<0.0001 and FDR-corrected P=0.0003, in Supplementary Table 1), the comparison of A+ versus A- group (Supplementary Fig. 8) showed only a trend towards increased wSMI alpha in parieto-occipital regions but did not reach cluster statistical significance.
Comparison of wSMI with “traditional” FC measures
Results are detailed in Supplementary results.
FC analysis at source level
Results of FC source analysis are described in Supplementary results.
Discussion
To our knowledge, this is the first study to demonstrate EEG changes in preclinical AD and SNAP. Moreover, we have explored the effects of AD topography-specific neurodegeneration and amyloid-beta deposition on EEG metrics. The most prominent effects of neurodegeneration
on EEG metrics were localized in fronto-central regions with an increase in high-frequency oscillations (higher beta and gamma power) and a decrease in low-frequency oscillations (lower delta power), higher spectral entropy, higher complexity and increased FC measured by wSMI in theta band. Neurodegeneration was associated to a widespread increase of MSF. Interestingly, in the absence of neurodegeneration, at stage 1 of preclinical AD according to (Sperling et al., 2011), amyloid burden did not have any impact on average EEG metrics but had a local effect marked by an increased FC measured by wSMI alpha in parieto-occipital regions.
Importantly, in N+ subjects, we found a non-linear relationship between amyloid burden and EEG metrics, either following a U-shape curve for delta power or an inverted U-shape curve for PSD beta, PSD gamma, MSF, complexity, spectral entropy and wSMI theta. This means that in the presence of neurodegeneration, EEG patterns are modulated differently depending on the degree of severity of amyloid burden. After N+ subjects exceed a certain threshold of amyloid load, the whole trend of EEG metrics reverses, meaning increased delta power and decreased beta and gamma power, MSF, spectral entropy, complexity and wSMI in theta band, with an EEG pattern getting close to the one observed in MCI and clinical AD. The fact that N+ subjects have opposite EEG trends for intermediate amyloid load (i.e. increased high-frequency oscillations) and high to very high amyloid load (i.e. slowing of brain oscillations) can explain why A+N+ subjects showed less EEG changes than A-N+ subjects, with only a discrete increase of PSD gamma and MSF. Indeed, in the A+N+ group, some subjects have intermediate amyloid load and others have very high amyloid load, so in the A+N+ group some subjects have increased high-frequency oscillations and others have a slowing of brain oscillations; these effects going in opposite directions, in the end at A+N+ group level very little EEG changes are visible, while EEG changes are actually present at individual level.
Therefore, it seems best to individualize two different EEG phases in neurodegeneration positive subjects, depending on the level of amyloid burden. We will first focus on the results for the first EEG phase in preclinical AD subjects presenting subthreshold to intermediate amyloid burden, before amyloid load exceeds a critical threshold. Increasing high frequency spectral power in fronto-central regions is in line with one recent study which showed a functional frontal upregulation revealed by an increased frontal alpha power in preclinical AD (Nakamura et al., 2018). Compared to this previous study, we found a frontal upregulation in higher frequency bands which were beta (12-30 Hz) and gamma (30-45 Hz). Increased frontal
functional upregulation has also been shown in other studies with an increased FC in frontal regions (Mormino et al., 2011; Jones et al., 2016). In an inverse way we found decreased frontal delta power in the presence of neurodegeneration, for subthreshold amyloid SUVR. A study by (Nakamura et al., 2018) reported a negative correlation between regional metabolism in AD-signature regions and frontal delta power in an amyloid-positive group which included MCI and CN subjects, MCI subjects showing higher frontal delta power than CN subjects. At first sight these results could seem discrepant with our study but can be explained first by the fact that we studied CN subjects only and not MCI subjects; second, we found increased delta power when neurodegeneration was associated to high amyloid burden, similarly to (Nakamura et al., 2018), thus confirming that delta power increase is a marker of disease progression within the Alzheimer’s disease continuum.
The first hypothesis to explain an increase in frontal high-frequency oscillations concomitant with a decrease in low-frequency oscillations in neurodegeneration positive subjects with subthreshold to intermediate amyloid load is a compensatory mechanism, which was also proposed in previous studies (Mormino et al., 2011; Lim et al., 2014; Jones et al., 2016). A sufficient level of compensation is needed to maintain normal cognitive function despite amyloid burden and hypometabolism in preclinical AD. Compensatory mechanisms would then fail once amyloid burden exceeds a certain level, explaining the reversal of EEG metrics trend, with a slowing of brain oscillations revealed by increased delta power and decreased beta and gamma power, with a spectral pattern getting close to the one typically found in MCI and AD. Another explanation is that as participants in INSIGHT-preAD study are selected on normal cognition, subjects with neurodegeneration may have a particularly high cognitive reserve, which is revealed by baseline higher spectral power in frontal regions, reduced low-frequency oscillations and higher FC (Cohen et al., 2009; Lim et al., 2014); this cognitive reserve would be altered as amyloid load increases, which would explain why subjects with neurodegeneration and very high amyloid load show slowing of brain oscillations and lower FC.
We found a local increase of FC measured by wSMI alpha in parieto-occipital regions in subjects at stage 1 of preclinical AD. This could be explained by abnormal transient neuronal hyperexcitability related to Aβ deposition with a relative decrease in synaptic inhibition (Busche et al., 2008; Palop and Mucke, 2010; Nakamura et al., 2018). The ‘acceleration’ hypothesis suggests that once Aβ deposition is initiated by independent events, a milieu of higher FC hastens this deposition, which eventually leads to the functional disconnection or
metabolic deterioration in the subjects with amyloid burden (Cohen et al., 2009; de Haan et al., 2012; Johnson et al., 2014; Lim et al., 2014). The metabolic demands associated with high connectivity may be the detrimental phenomenon that triggers downstream cellular and molecular events associated with AD (Jones et al., 2016). Previous work in animal models has shown that intermediate levels of Aβ enhance synaptic activity presynaptically (Abramov et al., 2009), whereas abnormally high levels of Aβ impair synaptic activity by inducing post-synaptic depression (Palop and Mucke, 2010). This is consistent with our results showing basically two different EEG phases in preclinical AD stage 2. In the early preclinical stage that is characterized by neurodegeneration combined with intermediate levels of Aβ, there is an increase in brain oscillations and FC due to compensation and/or Aβ related excitotoxicity. Then, the increase in brain oscillations and FC would hasten Aβ deposition. In a later preclinical stage characterized by neurodegeneration combined with high to very high levels of Aβ, there is a slowing of brain oscillations and reduced FC due to compensatory mechanisms failure and/or post-synaptic depression, with an EEG pattern getting close to the one observed in MCI and AD. Thebreak-down of initial functional compensation would facilitate accelerated tau-related neurodegenerative processes (Jones et al., 2017).
To our knowledge our work is the first to study complexity and spectral entropy in preclinical AD subjects, coupled with metabolic evidence of neurodegeneration and Aβ biomarker information. The increased complexity and spectral entropy observed in frontal regions in the presence of neurodegeneration could also be explained by compensatory mechanisms. Compensation would then fail with increasing amyloid burden, with an EEG pattern becoming less complex and more regular, getting close to the one observed in MCI/AD (Hornero et al., 2009; Staudinger and Polikar, 2011; Al-Nuaimi et al., 2018).
One of the main strengths of our study was the use of a high-performing and practical EEG processing pipeline with automated artifact elimination and extraction of several validated EEG biomarkers. This tool avoids the need for the time-consuming manual removal of artifacts and the risk of possible human biases. Effective artifact removal is particularly important in a population of elderly subjects. Our results suggest that the EEG measures extracted with this pipeline can be successfully employed in a wide range of practical contexts whenever spectral or information-theory biomarkers are needed. wSMI has proved effective in assessing FC in previous studies (King et al., 2013; Sitt et al., 2014; Engemann et al., 2015, 2018) because unlike several traditional synchrony measures it minimizes common-source artifacts and provides an efficient way to detect non-linear coupling. Moreover, wSMI has already proven
sensitive to detect aberrant networks in other neurodegenerative conditions, including Parkinson’s disease (Melloni et al., 2015) and behavioral variant frontotemporal dementia (Dottori et al., 2017). Our study supports the idea that EEG being a non-invasive, cheap and widely-available technique, could be used as a screening tool for identifying individuals at high risk of preclinical AD and future cognitive decline. Moreover, EEG biomarkers seem to be useful tools to measure and monitor neurodegeneration.
Another novelty of our work is the division of our study population in four groups, based on amyloid and neurodegeneration criteria, in contrast to the more commonly used selection of individuals at risk for AD based on amyloid biomarker alone with a dichotomous classification of subjects as amyloid-negative or positive. First, amyloid deposition alone does not necessarily represent progression to clinical AD as both neuropathological and PET data show evidence of extensive amyloid-β pathology in CN older people (Bennett et al., 2006; Morris et al., 2010; Jagust, 2016). Second, it has been shown that neurodegeneration, particularly synapse loss, is the aspect of AD neuropathologic change that correlates most closely with symptom onset and cognitive decline (Soldan et al., 2016; Jack et al., 2018) and several studies using 18F-FDG PET
showed that cerebral metabolic rate of glucose reduction predicted cognitive decline from normal elderly cognition to MCI/AD with a high accuracy, decliners showing greater reduction of 18F-FDG SUVR values (de Leon et al., 2001; Jagust et al., 2006; Mosconi et al., 2009, 2010). A study by (Teipel et al., 2018) found no association between cortical amyloid load and FC in the INSIGHT-preAD cohort, which is explainable first by the fact that authors only assessed the impact of amyloid load and not the effect of neurodegeneration on FC; second, they used Phase Lag Index to measure FC, which is affected by noise and volume conduction. The study of four groups of subjects depending on their amyloid and neurodegeneration status enabled us to explore EEG changes at different stages of preclinical AD (stage 1 and stage 2) and to study SNAP subjects which are also at risk of future cognitive decline (Caroli et al., 2015). Moreover, we were able to assess independently the effects of neurodegeneration and amyloid burden on EEG metrics.
Our results showed increased wSMI theta in ApoE4 carriers. This is consistent with other studies showing increased FC in CN ApoE4 carriers (Filbey et al., 2006; Kramer et al., 2008), whereas other studies found reduced brain activity in ApoE4 carriers (Lind et al., 2006) or no differences in FC according to ApoE genotype (Bassett et al., 2006; Nakamura et al., 2017). We found that men had higher FC measured by wSMI theta; however, this result should be interpreted with caution as there was some gender imbalance between groups. Some studies
have found higher FC in men (Allen et al., 2011; Filippi et al., 2013), whereas others have reported that gender has a relatively small (Bluhm et al., 2008) or lack of effect (Weissman-Fogel et al., 2010) on resting state networks. Thus, further studies are needed to clarify the impact of gender and ApoE4 genotype on EEG metrics.
Our study presents some limitations. We divided the INSIGHT-preAD cohort into four groups of subjects based on 18F-florbetapir PET and 18F-FDG PET thresholds. However, principally for amyloid burden, this dichotomous distinction between A+ and A- categories is questionable as A- subjects are not necessarily completely free of amyloid, especially subjects that are slightly below the threshold. In the A-N+ (SNAP) group some subjects had subthreshold amyloid load so would be close to stage 2 of preclinical AD. In the A+N+ group the population was heterogeneous, as some subjects had intermediate amyloid burden and others had high to very high amyloid burden, making it difficult to interpret the results at A+N+ group level, as EEG metrics went into opposite directions depending on the degree of severity of amyloid burden. For that reason, we decided it was best to analyse amyloid load as a continuous variable and to describe two EEG phases in stage 2 of preclinical AD (for intermediate amyloid load and high to very high amyloid burden). Tau marker was not available, which is another limitation of this study, especially in regards with the recent NIA-AA research framework (Jack et al., 2018) which stipulates that only individuals with both Aβ and pathologic tau biomarkers would be considered to have AD. However, it has been shown that there is a strong correlation between ¹⁸F-FDG PET hypometabolism in AD-signature regions and tau pathology, and also between hippocampal atrophy and tau pathology (Gómez-Isla et al., 1997; Nelson et al., 2012). As in our study A+N+ subjects not only had a combination of high ¹⁸F-florbetapir retention and low ¹⁸F-FDG PET metabolism but also presented significant hippocampal volume reduction, it means that they have a high probability of pathologic tau deposits. We decided to do our principal analysis at scalp level and mainly use globally-averaged EEG measures so that the procedure would stay simple, keeping in mind that it could be applied as a possible routine screening tool in the future to identify individuals at high risk of preclinical AD. To have a better interpretation in terms of cerebral regions we did FC analysis at source level on four samples of subjects (Supplementary results), but due to lack of power, we did not evidence any significant differences in FC at source level. Source analysis on a larger number of subjects will need to be done in future studies. Finally, the analysis of longitudinal EEG data in the INSIGHT-preAD cohort will be most interesting to monitor
evolution of EEG metrics during follow-up, especially in patients who will cognitively decline and evolve to prodromal AD.
To conclude, our work identified several EEG biomarkers that are effective indices of AD topography-specific neurodegeneration. As these EEG biomarkers are modulated by the degree of severity of amyloid load, they will possibly help to distinguish between different stages of preclinical AD. Our findings need to be replicated in further studies with a longitudinal analysis of EEG changes to finely assess the temporal evolution of these associations.
Acknowledgements
We sincerely thank all the staff at the Institut du Cerveau et de la Moelle Epinière (ICM) and institute for memory and Alzheimer’s disease (IM2A) who supported the INSIGHT-preAD project as well as the 318 INSIGHT-preAD volunteers. We thank Christiane Metzinger (ICM) for INSIGHT data management.
Funding
The study was promoted by INSERM in collaboration with ICM, Instituts Hospitalo-Universitaires à ICM, and Pfizer and has received support within the "Investissement d'Avenir" (ANR-10-AIHU-06) program. The study was promoted in collaboration with the "CHU de Bordeaux" (coordination CIC EC7), the promoter of Memento cohort, funded by the Foundation Plan-Alzheimer. The study was further supported by AVID/Lilly. This project/research has received funding from the European Union’s Horizon 2020 Framework Programme for Research and Innovation under the Specific Grant Agreement No. 785907 (Human Brain Project SGA2). The funding sources had no role in the study design, data collection, data analysis, or data interpretation.
Competing interests
S.E. has received honoraria as a speaker or consultant for Eli Lilly, Biogen, Astellas Pharma, Roche and GE Healthcare. The other authors do not report any conflicts of interest.
Supplementary material
Appendix
INSIGHT-preAD study group: Hovagim Bakardjian, Habib Benali, Hugo Bertin, Joel Bonheur, LaurieBoukadida, Nadia Boukerrou, Enrica Cavedo, Patrizia Chiesa, Olivier Colliot, Bruno Dubois, Marion Dubois, Stéphane Epelbaum, Geoffroy Gagliardi, Remy Genthon, Marie-Odile Habert, Harald Hampel, Marion Houot, Aurélie Kas, Foudil Lamari, Marcel Levy, Simone Lista, Christiane Metzinger, Fanny Mochel, Francis Nyasse, Catherine Poisson, Marie-Claude Potier, Marie Revillon, Antonio Santos, Katia Santos Andrade, Marine Sole, Mohmed Surtee, Michel Thiebaud de Schotten, Andrea Vergallo, Nadjia Younsi
A complete listing of MEMENTO study group members can be found at:
https://www.ncbi.nlm.nih.gov/pmc/articles/PMC5576287/bin/13195_2017_288_MOESM3_E SM.docx
References
Abramov E, Dolev I, Fogel H, Ciccotosto GD, Ruff E, Slutsky I. Amyloid-β as a positive endogenous regulator of release probability at hippocampal synapses. Nat. Neurosci. 2009; 12: 1567–1576.
Allen EA, Erhardt EB, Damaraju E, Gruner W, Segall JM, Silva RF, et al. A Baseline for the Multivariate Comparison of Resting-State Networks. Front. Syst. Neurosci. 2011; 5. Available from: http://journal.frontiersin.org/article/10.3389/fnsys.2011.00002/abstract
Al-Nuaimi AHH, Jammeh E, Sun L, Ifeachor E. Complexity Measures for Quantifying Changes in Electroencephalogram in Alzheimer’s Disease. Complexity 2018; 2018: 1–12.
Babiloni C, Binetti G, Cassetta E, Forno GD, Percio CD, Ferreri F, et al. Sources of cortical rhythms change as a function of cognitive impairment in pathological aging: a multicenter study. Clin. Neurophysiol. 2006; 117: 252–268.
Babiloni C, Frisoni G, Pievani M, Vecchio F, Lizio R, Buttiglione M, et al. Hippocampal volume and cortical sources of EEG alpha rhythms in mild cognitive impairment and Alzheimer disease. NeuroImage 2009; 44: 123–135.
Babiloni C, Lizio R, Marzano N, Capotosto P, Soricelli A, Triggiani AI, et al. Brain neural synchronization and functional coupling in Alzheimer’s disease as revealed by resting state EEG rhythms. Int. J. Psychophysiol. 2016; 103: 88–102.
Babiloni C, Visser PJ, Frisoni G, De Deyn PP, Bresciani L, Jelic V, et al. Cortical sources of resting EEG rhythms in mild cognitive impairment and subjective memory complaint. Neurobiol. Aging 2010; 31: 1787–1798.
Bassett SS, Yousem DM, Cristinzio C, Kusevic I, Yassa MA, Caffo BS, et al. Familial risk for Alzheimer’s disease alters fMRI activation patterns. Brain 2006; 129: 1229–1239.
Bateman RJ, Xiong C, Benzinger TLS, Fagan AM, Goate A, Fox NC, et al. Clinical and Biomarker Changes in Dominantly Inherited Alzheimer’s Disease. N. Engl. J. Med. 2012; 367: 795–804.
Bennett DA, Schneider JA, Arvanitakis Z, Kelly JF, Aggarwal NT, Shah RC, et al. Neuropathology of older persons without cognitive impairment from two community-based studies. Neurology 2006; 66: 1837–1844.
Blinowska KJ, Rakowski F, Kaminski M, De Vico Fallani F, Del Percio C, Lizio R, et al. Functional and effective brain connectivity for discrimination between Alzheimer’s patients and healthy individuals: A study on resting state EEG rhythms. Clin. Neurophysiol. 2017; 128: 667–680.
Bluhm RL, Osuch EA, Lanius RA, Boksman K, Neufeld RWJ, Théberge J, et al. Default mode network connectivity: effects of age, sex, and analytic approach: NeuroReport 2008; 19: 887– 891.
Burnham SC, Bourgeat P, Doré V, Savage G, Brown B, Laws S, et al. Clinical and cognitive trajectories in cognitively healthy elderly individuals with suspected non-Alzheimer’s disease pathophysiology (SNAP) or Alzheimer’s disease pathology: a longitudinal study. Lancet Neurol. 2016; 15: 1044–1053.
Busche MA, Eichhoff G, Adelsberger H, Abramowski D, Wiederhold K-H, Haass C, et al. Clusters of Hyperactive Neurons Near Amyloid Plaques in a Mouse Model of Alzheimer’s Disease. Science 2008; 321: 1686–1689.
Caroli A, Prestia A, Galluzzi S, Ferrari C, van der Flier WM, Ossenkoppele R, et al. Mild cognitive impairment with suspected nonamyloid pathology (SNAP): Prediction of progression. Neurology 2015; 84: 508–515.
Cohen AD, Price JC, Weissfeld LA, James J, Rosario BL, Bi W, et al. Basal Cerebral Metabolism May Modulate the Cognitive Effects of A in Mild Cognitive Impairment: An Example of Brain Reserve. J. Neurosci. 2009; 29: 14770–14778.
Dottori M, Sedeño L, Martorell Caro M, Alifano F, Hesse E, Mikulan E, et al. Towards affordable biomarkers of frontotemporal dementia: A classification study via network’s information sharing. Sci. Rep. 2017; 7. Available from: http://www.nature.com/articles/s41598-017-04204-8
Drzezga A, Lautenschlager N, Siebner H, Riemenschneider M, Willoch F, Minoshima S, et al. Cerebral metabolic changes accompanying conversion of mild cognitive impairment into Alzheimer’s disease: a PET follow-up study. Eur. J. Nucl. Med. Mol. Imaging 2003; 30: 1104– 1113.
Dubois B, Epelbaum S, Nyasse F, Bakardjian H, Gagliardi G, Uspenskaya O, et al. Cognitive and neuroimaging features and brain β-amyloidosis in individuals at risk of Alzheimer’s disease (INSIGHT-preAD): a longitudinal observational study. Lancet Neurol. 2018; 17: 335–346. Engemann D, Raimondo F, King J-R, Jas M, Gramfort A, Dehaene S. Automated measurement and prediction of consciousness in vegetative and minimally conscious patients. In: ICML workshop on statistics, machine learning and neuroscience 2015. Lille, France; 2015.
Engemann DA, Raimondo F, King J-R, Rohaut B, Louppe G, Faugeras F, et al. Robust EEG-based cross-site and cross-protocol classification of states of consciousness. Brain J. Neurol. 2018; 141: 3179–3192.
Filbey FM, Slack KJ, Sunderland TP, Cohen RM. Functional magnetic resonance imaging and magnetoencephalography differences associated with APOEϵ4 in young healthy adults: NeuroReport 2006; 17: 1585–1590.
Filippi M, Valsasina P, Misci P, Falini A, Comi G, Rocca MA. The organization of intrinsic brain activity differs between genders: A resting-state fMRI study in a large cohort of young healthy subjects. Hum. Brain Mapp. 2013; 34: 1330–1343.
Gómez-Isla T, Hollister R, West H, Mui S, Growdon JH, Petersen RC, et al. Neuronal loss correlates with but exceeds neurofibrillary tangles in Alzheimer’s disease: Neuronal Loss in the Superior Temporal Sulcus in Alzheimer’s Disease. Ann. Neurol. 1997; 41: 17–24.
Gramfort A, Luessi M, Larson E, Engemann DA, Strohmeier D, Brodbeck C, et al. MEG and EEG data analysis with MNE-Python. Front. Neurosci. 2013; 7: 267.
Grunwald M, Busse F, Hensel A, Kruggel F, Riedel-Heller S, Wolf H, et al. Correlation between cortical theta activity and hippocampal volumes in health, mild cognitive impairment, and mild dementia. J. Clin. Neurophysiol. Off. Publ. Am. Electroencephalogr. Soc. 2001; 18: 178–184.
de Haan W, Mott K, van Straaten ECW, Scheltens P, Stam CJ. Activity Dependent Degeneration Explains Hub Vulnerability in Alzheimer’s Disease. PLoS Comput. Biol. 2012; 8: e1002582.
Habert M-O, Bertin H, Labit M, Diallo M, Marie S, Martineau K, et al. Evaluation of amyloid status in a cohort of elderly individuals with memory complaints: validation of the method of quantification and determination of positivity thresholds. Ann. Nucl. Med. 2018; 32: 75–86. Hornero R, Abasolo D, Escudero J, Gomez C. Nonlinear analysis of electroencephalogram and magnetoencephalogram recordings in patients with Alzheimer’s disease. Philos. Trans. R. Soc. Math. Phys. Eng. Sci. 2009; 367: 317–336.
Jack CR, Bennett DA, Blennow K, Carrillo MC, Dunn B, Haeberlein SB, et al. NIA-AA Research Framework: Toward a biological definition of Alzheimer’s disease. Alzheimers Dement. 2018; 14: 535–562.
Jack CR, Knopman DS, Jagust WJ, Petersen RC, Weiner MW, Aisen PS, et al. Tracking pathophysiological processes in Alzheimer’s disease: an updated hypothetical model of dynamic biomarkers. Lancet Neurol. 2013; 12: 207–216.
Jack CR, Knopman DS, Weigand SD, Wiste HJ, Vemuri P, Lowe V, et al. An operational approach to National Institute on Aging-Alzheimer’s Association criteria for preclinical Alzheimer disease. Ann. Neurol. 2012; 71: 765–775.
Jagust W. Is amyloid-β harmful to the brain? Insights from human imaging studies. Brain 2016; 139: 23–30.
Jagust W, Gitcho A, Sun F, Kuczynski B, Mungas D, Haan M. Brain imaging evidence of preclinical Alzheimer’s disease in normal aging. Ann. Neurol. 2006; 59: 673–681.
Jelic V, Johansson SE, Almkvist O, Shigeta M, Julin P, Nordberg A, et al. Quantitative electroencephalography in mild cognitive impairment: longitudinal changes and possible prediction of Alzheimer’s disease. Neurobiol. Aging 2000; 21: 533–540.
Jeong J. EEG dynamics in patients with Alzheimer’s disease. Clin. Neurophysiol. 2004; 115: 1490–1505.
Johnson SC, Christian BT, Okonkwo OC, Oh JM, Harding S, Xu G, et al. Amyloid burden and neural function in people at risk for Alzheimer’s Disease. Neurobiol. Aging 2014; 35: 576–584.
Jones DT, Graff-Radford J, Lowe VJ, Wiste HJ, Gunter JL, Senjem ML, et al. Tau, amyloid, and cascading network failure across the Alzheimer’s disease spectrum. Cortex 2017; 97: 143– 159.
Jones DT, Knopman DS, Gunter JL, Graff-Radford J, Vemuri P, Boeve BF, et al. Cascading network failure across the Alzheimer’s disease spectrum. Brain 2016; 139: 547–562.
King J-R, Sitt JD, Faugeras F, Rohaut B, El Karoui I, Cohen L, et al. Information Sharing in the Brain Indexes Consciousness in Noncommunicative Patients. Curr. Biol. 2013; 23: 1914– 1919.
Knopman DS, Jack CR, Wiste HJ, Weigand SD, Vemuri P, Lowe VJ, et al. Brain injury biomarkers are not dependent on β-amyloid in normal elderly: Neuronal Injury Biomarkers. Ann. Neurol. 2013; 73: 472–480.
Kramer G, van der Flier WM, de Langen C, Blankenstein MA, Scheltens P, Stam CJ. EEG functional connectivity and ApoE genotype in Alzheimer’s disease and controls. Clin. Neurophysiol. 2008; 119: 2727–2732.
de Leon MJ, Convit A, Wolf OT, Tarshish CY, DeSanti S, Rusinek H, et al. Prediction of cognitive decline in normal elderly subjects with 2-[18F]fluoro-2-deoxy-D-glucose/positron-emission tomography (FDG/PET). Proc. Natl. Acad. Sci. 2001; 98: 10966–10971.
Lim HK, Nebes R, Snitz B, Cohen A, Mathis C, Price J, et al. Regional amyloid burden and intrinsic connectivity networks in cognitively normal elderly subjects. Brain 2014; 137: 3327– 3338.
Lind J, Persson J, Ingvar M, Larsson A, Cruts M, Van Broeckhoven C, et al. Reduced functional brain activity response in cognitively intact apolipoprotein E ε4 carriers. Brain 2006; 129: 1240–1248.
Luckhaus C, Grass-Kapanke B, Blaeser I, Ihl R, Supprian T, Winterer G, et al. Quantitative EEG in progressing vs stable mild cognitive impairment (MCI): results of a 1-year follow-up study. Int. J. Geriatr. Psychiatry 2008; 23: 1148–1155.
Melloni M, Sedeño L, Hesse E, García-Cordero I, Mikulan E, Plastino A, et al. Cortical dynamics and subcortical signatures of motor-language coupling in Parkinson’s disease. Sci. Rep. 2015; 5. Available from: http://www.nature.com/articles/srep11899
Mormino EC, Betensky RA, Hedden T, Schultz AP, Amariglio RE, Rentz DM, et al. Synergistic Effect of β-Amyloid and Neurodegeneration on Cognitive Decline in Clinically Normal Individuals. JAMA Neurol. 2014; 71: 1379.
Mormino EC, Smiljic A, Hayenga AO, H. Onami S, Greicius MD, Rabinovici GD, et al. Relationships between Beta-Amyloid and Functional Connectivity in Different Components of the Default Mode Network in Aging. Cereb. Cortex 2011; 21: 2399–2407.
Morris JC, Roe CM, Xiong C, Fagan AM, Goate AM, Holtzman DM, et al. APOE predicts amyloid-beta but not tau Alzheimer pathology in cognitively normal aging. Ann. Neurol. 2010; 67: 122–131.
Mosconi L, Berti V, Glodzik L, Pupi A, De Santi S, de Leon MJ. Pre-Clinical Detection of Alzheimer’s Disease Using FDG-PET, with or without Amyloid Imaging. J. Alzheimers Dis. 2010; 20: 843–854.
Mosconi L, Mistur R, Switalski R, Tsui WH, Glodzik L, Li Y, et al. FDG-PET changes in brain glucose metabolism from normal cognition to pathologically verified Alzheimer’s disease. Eur. J. Nucl. Med. Mol. Imaging 2009; 36: 811–822.
Nakamura A, Cuesta P, Fernández A, Arahata Y, Iwata K, Kuratsubo I, et al. Electromagnetic signatures of the preclinical and prodromal stages of Alzheimer’s disease. Brain 2018; 141: 1470–1485.
Nakamura A, Cuesta P, Kato T, Arahata Y, Iwata K, Yamagishi M, et al. Early functional network alterations in asymptomatic elders at risk for Alzheimer’s disease. Sci. Rep. 2017; 7.Available from: http://www.nature.com/articles/s41598-017-06876-8
Nelson PT, Alafuzoff I, Bigio EH, Bouras C, Braak H, Cairns NJ, et al. Correlation of Alzheimer Disease Neuropathologic Changes With Cognitive Status: A Review of the Literature. J. Neuropathol. Exp. Neurol. 2012; 71: 362–381.
Palop JJ, Mucke L. Amyloid-β–induced neuronal dysfunction in Alzheimer’s disease: from synapses toward neural networks. Nat. Neurosci. 2010; 13: 812–818.
Sitt JD, King J-R, El Karoui I, Rohaut B, Faugeras F, Gramfort A, et al. Large scale screening of neural signatures of consciousness in patients in a vegetative or minimally conscious state. Brain 2014; 137: 2258–2270.
Smith SM, Nichols TE. Threshold-free cluster enhancement: addressing problems of smoothing, threshold dependence and localisation in cluster inference. NeuroImage 2009; 44: 83–98.
Soldan A, Pettigrew C, Cai Q, Wang M-C, Moghekar AR, O’Brien RJ, et al. Hypothetical Preclinical Alzheimer Disease Groups and Longitudinal Cognitive Change. JAMA Neurol. 2016; 73: 698.
Sperling RA, Aisen PS, Beckett LA, Bennett DA, Craft S, Fagan AM, et al. Toward defining the preclinical stages of Alzheimer’s disease: Recommendations from the National Institute on Aging-Alzheimer’s Association workgroups on diagnostic guidelines for Alzheimer’s disease. Alzheimers Dement. 2011; 7: 280–292.
Stam CJ. Use of magnetoencephalography (MEG) to study functional brain networks in neurodegenerative disorders. J. Neurol. Sci. 2010; 289: 128–134.
Stam CJ, van der Made Y, Pijnenburg YAL, Scheltens P. EEG synchronization in mild cognitive impairment and Alzheimer’s disease. Acta Neurol. Scand. 2003; 108: 90–96.
Staudinger T, Polikar R. Analysis of complexity based EEG features for the diagnosis of Alzheimer’s disease. IEEE; 2011. p. 2033–2036.
Teipel S, Bakardjian H, Gonzalez-Escamilla G, Cavedo E, Weschke S, Dyrba M, et al. No association of cortical amyloid load and EEG connectivity in older people with subjective memory complaints. NeuroImage Clin. 2018; 17: 435–443.
Toledo JB, Weiner MW, Wolk DA, Da X, Chen K, Arnold SE, et al. Neuronal injury biomarkers and prognosis in ADNI subjects with normal cognition. Acta Neuropathol.
Commun. 2014; 2. Available from:
http://actaneurocomms.biomedcentral.com/articles/10.1186/2051-5960-2-26
Villemagne VL, Burnham S, Bourgeat P, Brown B, Ellis KA, Salvado O, et al. Amyloid β deposition, neurodegeneration, and cognitive decline in sporadic Alzheimer’s disease: a prospective cohort study. Lancet Neurol. 2013; 12: 357–367.
Vos SJ, Xiong C, Visser PJ, Jasielec MS, Hassenstab J, Grant EA, et al. Preclinical Alzheimer’s disease and its outcome: a longitudinal cohort study. Lancet Neurol. 2013; 12: 957–965. Weissman-Fogel I, Moayedi M, Taylor KS, Pope G, Davis KD. Cognitive and default-mode resting state networks: do male and female brains ‘rest’ differently? Hum. Brain Mapp. 2010; 31: 1713–1726.
Wirth M, Villeneuve S, Haase CM, Madison CM, Oh H, Landau SM, et al. Associations Between Alzheimer Disease Biomarkers, Neurodegeneration, and Cognition in Cognitively Normal Older People. JAMA Neurol. 2013. Available from: http://archneur.jamanetwork.com/article.aspx?doi=10.1001/jamaneurol.2013.4013
Figure legends:
Figure 1: Local regression of average EEG metrics across all scalp electrodes as a function of amyloid SUVR. SE = spectral entropy.
Figure 2: Local regression of average EEG metrics across all scalp electrodes as a function of amyloid SUVR for neurodegeneration positive subjects only. SE = spectral entropy.
Figure 3: Local regression of average EEG metrics across all scalp electrodes as a function of mean FDG SUVR. FDG = fluorodeoxyglucose; SE = spectral entropy.
Figure 4: Estimated marginal means from multiple linear regressions of average EEG metrics according to brain metabolism. Amyloid load and brain metabolism are used either as continuous or binary measures, depending on each EEG metric to maximize R-squared values. (A) Brain metabolism as binary measure (N+ vs N-). (B) Brain metabolism as continuous measure (mean FDG SUVR). Estimated marginal means and standard deviation are depicted; covariables in the models were: age, education level, gender, ApoE4 status, hippocampal volume and Florbetapir (either binary or continuous); p-values are indicated with *P < 0.05. **P < 0.01. n.s.: not significant. FDG = fluorodeoxyglucose; SE = spectral entropy.
Figure 5: Estimated marginal means from multiple linear regressions of average EEG metrics according to interactions between amyloid load and brain metabolism. Amyloid load and brain metabolism are used either as continuous or binary measures, depending on each EEG metric to maximize R-squared values. (A) Interaction between amyloid SUVR and FDG status. (B) Interaction between amyloid SUVR and mean FDG SUVR. (C) Interaction between mean FDG SUVR and amyloid status. Estimated marginal means and standard deviation are depicted; covariables in the models were: age, education level, gender, ApoE4 status, hippocampal volume and Florbetapir (either binary or continuous); p-values are indicated with *P < 0.05. FDG = fluorodeoxyglucose; SE = spectral entropy.
Figure 6: 224 electrodes topographical maps of EEG metrics. The topographical 2D projection (top = front) of each measure [normalized power spectral density in delta (δ), theta (θ), alpha (α), beta (β), gamma (γ), median spectral frequency (MSF), spectral entropy (SE), algorithmic complexity (K) and weighted symbolic mutual information in theta band and alpha band (wSMI θ and wSMI α)] is plotted for A+N+ group, A-N+ group, A+N- group and control group A-N- (columns). Statistics were done on 224 electrodes by non-parametric cluster permutation test. The three last columns indicate non-non-parametric cluster-based permutation test results for the pairwise comparisons: A+N+ vs A-N-; A-N+ vs A-N- and A+N- vs A-N- for each EEG metric. The topographical maps in the three last columns are color-coded according to the cluster permutation tests p-values (color = P<0.05, greyscale=P>0.05). Clusters of electrodes whose EEG metrics’ values are significantly different from the control group (A-N-) are depicted.
Figure 1: Local regression of average EEG metrics across all scalp electrodes as a function of amyloid SUVR. SE = spectral entropy.
Figure 2: Local regression of average EEG metrics across all scalp electrodes as a function of amyloid SUVR for neurodegeneration positive subjects only. SE = spectral entropy.