Université de Liège
Departement de Géologie
Géorisques et Environnement
Assessment of landslide hazard in the environmental hotspot areas of
the Kyrgyz Tien-Shan:
Spatial analysis and Numeric modelling
A thesis submitted for the degree of
Doctor of Sciences
presented by
Torgoev Almazbek
Acknowledgement
I use this nice moment to restore in my mind the whole story of my PhD research. By looking back I understand that this professional milestone would not be possible without support of other people. The most valuable and most important input comes from the promoter Prof. Havenith Hans-Balder. Without his help regarding both scientific and practical issues, the completion of this thesis would definitely not have been possible. There were several periods in my research when I did not believe that I could reach the end. In these moments the support of Hans was decisive and, obviously, not in vain. I would like to thank him for this as well as for all funny and nice moments of my research, such as the field trip to Gobi desert, the happy-end affair with the Chinese intelligence service, the banana trees in Burundi, the geophysical survey in the Eifel forest, the beer parties in Belgium and many other events all around the world.
I would also like to outline that during my numerous stays in Belgium I was kindly hosted in the house of Hans. Therefore, I would also like to express my deepest gratitude to his whole family, including his mother and relatives. Special thanks go to Hans’ wife, Verena, who always gave me a warm welcome during my stays in their house in Raeren.
The other sincere thanks of mine are directed to Kyrgyzstan. I would like to express my deepest gratitude to SEC “Geopribor” with special thanks to Isakbek Torgoev and Yury Alishin. The results of their 25-year research in Kyrgyzstan formed a sound background for my PhD studies. The biggest portion of the input data and baseline information of my thesis originates from their field studies in Mailuu-Suu and Minkush target areas.
I would also like to mention the INTAS project which was a “seed” further grown into the fully-developed “tree” of my PhD thesis. In respect to that I am very grateful to Prof. Dr. Schneider, J. (BOKU University, Vienna, Austria), Prof. Dr. Casagli, N. (Università degli Studi di Firenze, Florence, Italy) and Prof. Dr. Guzzetti, F. (CNR IRPI, Perugia, Italy). I am also very thankful to numerous colleagues from these scientific organisations who have helped me during my INTAS fellowship. A special thank is also directed to Prof. Dr. Beier, G. (WHZ, Zwickau, Germany) who has certain input in the success of my research. Additionally, I would like to thank the NATO SfP LADATASHA project for a scientific and financial support of my research.
Finally, I would like to thank my close family and my wife Saniya for the hot support along the track. Their strong belief in the success of my research was always an additional impetus and “light in the tunnel” which brought me to the desired destination. A special gratitude is expressed to my mother Roza, as she has a personal input in this milestone due to the time and efforts she spent in past. I dedicate this work to my children wishing that they climb the higher summits in their life than I have done.
Благодарность
Я хочу использовать этот прекрасный момент, чтобы вспомнить всю историю этого личного проекта. Обарачиваясь назад, я понимаю, что это профессиональное достижение было бы невозможным без помощи других людей. Самый значимый вклад и самая важная поддержка была оказана моим руководителем Проф. Др. Хавеницем Хансом-Балдерем. Эта диссертация определенно не увидела бы свет без его всесторонней помощи, как в отношении научных аспектов, так и с практической точки зрения. На протяжении моей работы было несколько критических моментов, когда я уже не верил в успешное завершение моих начинаний. В такие моменты Ханс оказывал решающую поддержку, которая, очевидно, не была напрасной. Вместе с этим, я хотел бы поблагодарить его за все прекрасные, местами смешные, моменты моей исследовательской работы, такие как полевые работы в пустыне Гоби, история с китайской секретной службой (со счастливой концовкой), банановые плантации в Бурунди, геофизические исследования в Айфеле, веселые вечеринки в Бельгии и т.д. Хотелось бы особо подчеркнуть, что во время моих многочисленных визитов в Бельгию я пользовался великодушным гостеприимством Ханса. В связи с этим, я также хочу поблагодарить его мать, а также родственников его жены. Я особенно благодарен Верене, которая была очень доброжелательна и терпелива ко мне во время моего проживания в их доме в Рарене. Также хотелось бы передать искреннюю благодарность в Кыргызстан. Большое спасибо НИЦ «Геоприбор», а также лично Исакбеку Торгоеву и Юрию Алешину. Результаты их 25-летних исследований в Кыргызстане послужили твердой основой для написания моей диссертации. Значительная часть вводных данных и сопутствующей информации берет свое начало из их полевых работ в Майлуу-Суу и Мин-Куше. Хотелось бы особо отметить проект ИНТАС, который послужил в качестве «зерна» из которого впоследствии выросло «дерево» моей кандидатской диссертации. В связи с этим я выражаю свою признательность Проф. Др. Шнайдеру Ж. (Университет BOKU, г. Вена, Австрия), Проф. Др. Касагли Н. (Università degli Studi di Firenze, г. Флоренция, Италия) и Проф. Др. Гуззетти Ф. (CNR IRPI, г. Перуджа, Италия). Я также очень благодарен тем сотрудникам вышеобозначенных огранизаций, которые помогли мне в ислледования в рамках ИНТАС проекта. Также хотел выразить особую признательность Проф. Др. Баеру Г. (WHZ, г. Цвиккау, Германия), который внес определенный вклад в успех моих исследований. В дополнение к вышесказанному, я хочу поблагодарить проект NATO SfP LADATASHA за помощь моим исследованиям, как в финансовом отношении так и научном плане. В заключении, хотел бы поблагодарить мою семью и супругу Санию за их горячую поддержку. Их несгибаемая вера в успех всегда была дополнительным импульсом и «светом в конце туннелля», которые вели меня к желаемой цели. Отдельное спасибо моей маме Розе, так ее усилия и время, потраченные на меня в прошлом, обеспечили вклад в успех данного проекта. Эту работу я посвящаю своим детям с пожеланием того, чтобы они покорили более высокие вершины, чем это сделал я.Abstract
This PhD research was initiated in parallel with the Nato Science for Peace project “Prevention of Landslide Dam Disasters in the Tien Shan, Kyrgyz Republic”. During this project a large amount of thematic data on slope instabilities and landslide dams in the Kyrgyz Tien-Shan was collected. The thesis uses this information to investigate applied and fundamental aspects of the regional mapping of the landslide susceptibility, hazard and, partially, risk. The target areas selected for the PhD research are the Mailuu-Suu River Valley (southern Kyrgyzstan) and the surroundings of the Minkush settlement (central Kyrgyzstan). They represent the areas of former uranium mining hosting numerous storage sites of tailing material and waste rock. Additionally, these areas are characterised by a high level of landslide activity induced by the human and environmental impacts. The landslides in those areas present a high risk to the society and infrastructure, potentially triggering serious environmental consequences.
Structurally, the thesis is composed of two parts: Part A and Part B. These parts are different both with respect to the research methodology and the scientific targets. The common goal of both parts is the development effective techniques to regionally assess landslide hazard in mountainous areas marked by complex geomorphological, tectonic and geological settings. Due to the remote access, such areas are often lacking background information and in-situ data that are required for the precise prediction of landslide occurrence and impacts. In such cases the spatial analysis often helps to better characterise regional and, partly, local landslide susceptibility. The regional studies allow us to outline the basic relationships between affecting factors and landslide occurrence. Such results also become the basis for effective planning of in-situ investigations and localised measurements.
Part A of thesis is focused on the applied aspects of spatial analysis. This part assembles a set of the well-established approaches and methods to model landslide susceptibility, hazard and risk. The studies start with the compilation of database spatially combining various thematic information. The first type of such thematic data is represented by the multi-temporal landslide inventories. These inventories are extracted applying different sources of remote sensing data, including the satellite and aerial imagery. The second type of thematic data describes the spatial distribution of factors affecting the level of landslide activity. The mapping of affecting factors is performed by applying conventional remote sensing techniques and spatial analysis tools.
The collected thematic data are then used to extract the landslide susceptibility, hazard and risk maps. In total, four conceptually different approaches are applied to map the landslide susceptibility, both on a qualitative and quantitative basis. The results of the quantitative susceptibility mapping and thematic data are further used to calculate the landslide hazard for each part of the studied area. The calculated landslide hazard is characterized both by spatial and temporal components. The results of the landslide hazard assessment are finally used to estimate the risk of the direct impacts of landslides on selected exposed elements, including the uranium tailings sites.
One of the well-established approaches used in Part A is the Newmark method. It maps the seismically triggered landslide susceptibility based on the computed co-seismic displacements. The simplicity of this method is attractive to many researches around the world studying seismically-triggered landslide hazards. Nevertheless, the simplifications adopted in this method strongly limit the reliability of the final predictions. In the second part of thesis we provide a critical overview of the Newmark method and attempt to propose conceptual improvements of the existing mapping practice. To reach the targeted challenges we combine the spatial analysis with the dynamic simulations in the 2D and 3D domains. The studied models represent the actual topographic and geologic settings of the landslide-prone slopes. The simulations provide acceleration time histories that are recorded in different parts of the model surface. The analyses of these records allow us to outline the amplification impacts related to the topographic and geological site effects.
The modelled amplification factors are analysed with respect to their link to the local geological and topographic settings. Thus, we study how the structural or material settings of the model can impact the recorded geological amplification. Such impacting parameters can be represented by the layer thickness, inclination of the underground contacts or the contrast of the shear wave velocity (Vs) values. The 2D topographic modelling investigates the way how the pure topographic amplification factors can be predicted
based on the surface morphology. The studies show that the surface curvature can be considered as a key parameter to predict the amplification factors. This idea is further investigated in the 3D modelling studies applying different input signals and the materials of varying Vs. The results of this modelling are integrated into a single database which is subjected to spatial analysis. This finally allows us to develop a simple proxy which maps the impacts of the topographic site effects based on morphological parameters extracted from the Digital Elevation Model of the target area.
Additionally, the subset of the 2D dynamic tests analyses the shear displacements triggered by the seismic shaking. Those displacements are recorded in the models with simplified geometry, as well as in the ones presenting the real topographic settings. The recorded displacements are cross-correlated with parameters characterising the seismic impacts. The results of analyses allow us to develop a new law which can easily be used in the GIS-based studies. The proposed law applies a set of the conventional parameters as well as a novel predictor which has never been used by any regional law before.
The conceptual improvements proposed in Part B are finally tested by applying them to the geodatabase compiled in the first part of thesis. Related results are then compared with those that were produced by using the conventional Newmark method. The validation tests should assess performance of the developed proxies to improve the predictions of seismically-triggered landslides.
Table of content:
Page
Introduction………... 1
Part A: Landslide susceptibility, hazard and risk – spatial analysis
A.I Modern practice and methodology: overview
I.1 Landslide classification and terminology, susceptibility versus hazard………... 2
I.2 Classification of landslide susceptibility mapping methods………. 4
I.2.1 Geomorphological mapping………... 4
I.2.2 Heuristic methods………... 5
I.2.3 Process-based methods……….. 6
I.2.4 Statistical methods……….. 7
I.3 Landslide hazard mapping………. 11
I.4 Mapping units………... 13
I.5 Spatial analysis tools: Geographic Information Systems and Remote Sensing
15
I.5.1 Geographic Information Systems………... 15
I.5.2 Remote Sensing………... 17
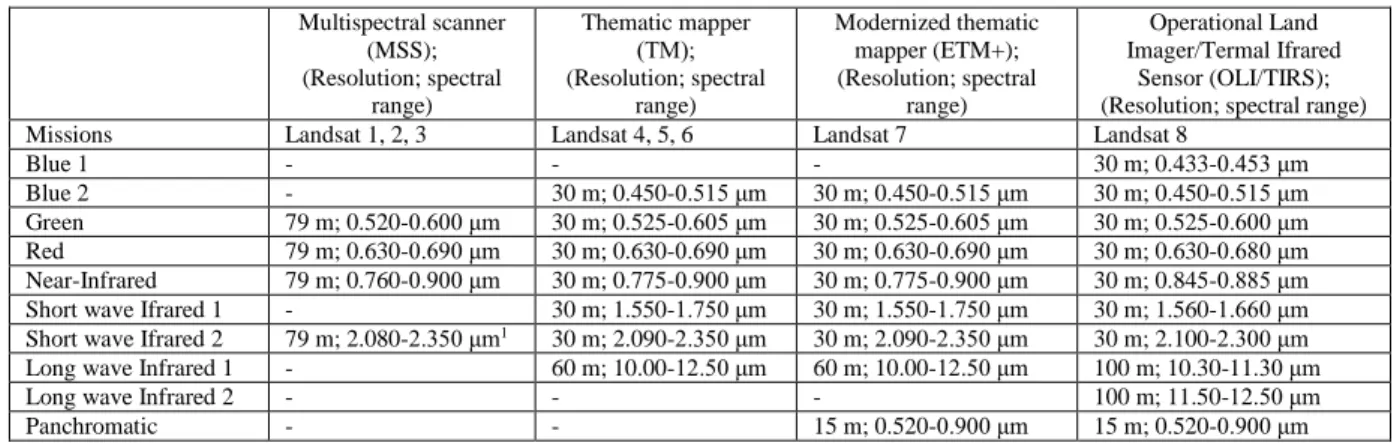
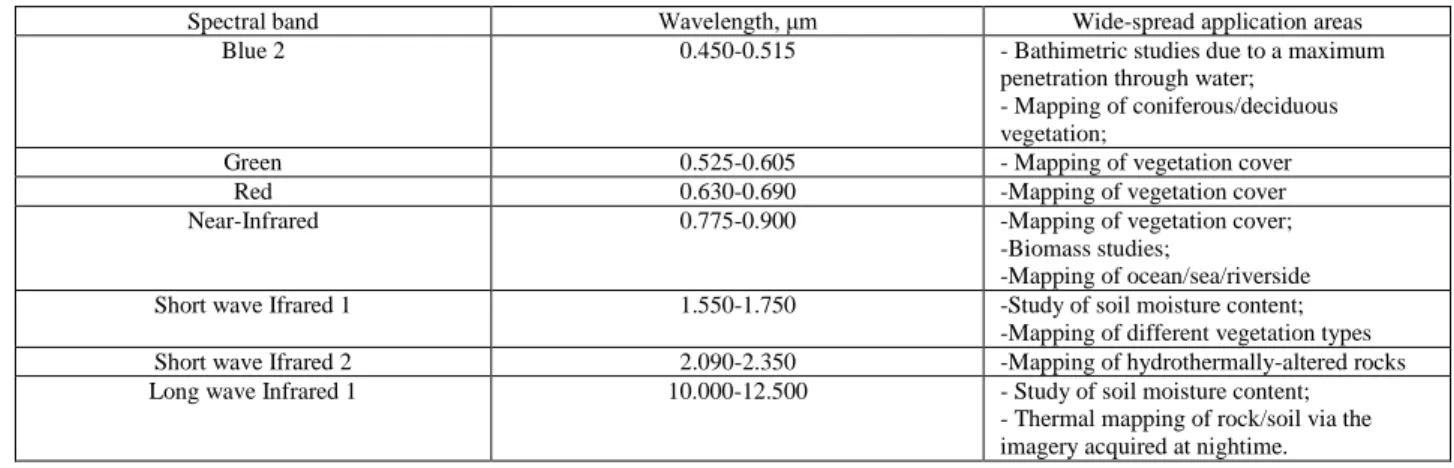
I.5.2.1 Remote Sensing missions
……….
18
I.5.2.2 Middle resolution imagery: Landsat and ASTER
………..
18
I.5.2.3 High resolution imagery: Quickbird and SPOT
………...
20
I.5.2.4 Data analysis and Remote Sensing software
………...
21
A.II The Mailuu-Suu target area
II.1 Kyrgyzstan………... 26
II.2 Neotectonic and seismic settings………. 26
II.3 The Mailuu-Suu target area: mining history and environmental conditions... 29
II.4 Landslide activity and its link with anthropogenic and environmental factors………... 29
A.III Landslide database
III.1 Methodology………... 34
III.2 Landslide inventories……….. 34
III.3 Landslide activity detection………... 39
A.IV Landslide susceptibility
IV.1 Factors contributing to landslide susceptibility……….. 45
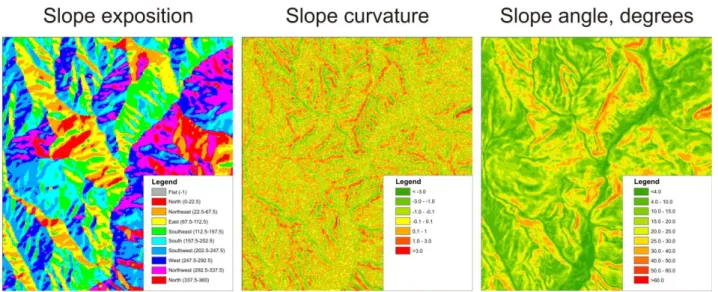
IV.1.1 Surface morphology………... 45
IV.1.2 Land cover/land use………... 48
IV.1.3 Geological units………... 50
IV.1.4 Structural control………... 54
IV.2 Landslide susceptibility mapping………..
59
IV.2.1 Index-based mapping………..
59
IV.2.2 Discriminant analysis……….
67
IV.2.3 Artificial Neural Networks………..
71
IV.2.4 Newmark Displacement………..
74
A.V Landslide hazard and landslide risk
V.1 Landslide hazard mapping………... 80
V.2.1 Risk and landslide risk: concept and underpinning issues………... 85
V.2.2 Landslide risk in the Mailuu-Suu target area: main results………. 87
Part B: Newmark Displacement method: dynamic studies and
conceptual improvements
B.I Earthquake-triggered landslides and Newmark method: current state and
problems
I.1 Earthquake triggered landslides………... 96
I.2 Seismic slope stability at a scale of single slope………... 98
I.3 Newmark model for a rigid block behaviour……… 98
I.4 The regional Newmark method………. 100
I.5 Seismic site effects……… 102
I.6 Geological site effects………..………. 103
I.7 Topographic site effects………..…………..………… 105
I.8 Combined topographic and geological site effects………... 107
I.9 Site effects and the landslide-related studies………. 108
B.II 2D dynamic numerical modelling: methodology
II.1 Methodology and applied software……….. 111
II.2 Modelled profiles………..…………..………. 111
II.3 Model geometry………..…………..………... 112
II.4 Size of FD-zones………..…………..…………... 115
II.5 Modelled materials and properties………..………. 116
II.6 Model stabilization and boundary conditions……….. 117
II.7 Dynamic loading and recordings………..……... 118
II.8 Analysis of the Ia amplification………..………. 120
II.9 Spectral studies………..…………..……… 121
B.III 2D dynamic numerical modelling: topographic site-effects
III.1 Models……… 124
III.2 Impacts of contacts………. 124
III.3 Wave focusing and PGV amplification……….. 126
III.4 PGA amplification………
127
III.5 Arias Intensity versus PGA……… 127
III.6 Spectral studies………... 128
III.7 Spectral amplification and hill dimensions………... 132
III.8 General patterns of I
aamplification……… 133
III.9 Spectral amplification versus I
aamplification………... 134
III.10 Curvature, FSC and smoothed curvature……….. 137
III.11 Link between At and smoothed curvature………... 138
B.IV 2D dynamic numerical modelling: combined geological and topographic site
effects
IV.1 Models and material sequence………... 143
IV.2 Soft layer: spectral amplification and Ag………... 144
IV.3 Soft material: longer shaking and PGV/PGA amplification ………... 150
IV.4 Coupled effects of topography and geology: distribution of Atg………... 153
IV.5 Spectral patterns: geological and topographic amplification………... 156
IV.6 Distribution of Ag and its dependence on structural settings………... 158
IV.7 Mean Ag versus dynamic properties…………..…………..…………..……… 159
B.V Shear displacement versus Newmark displacement: 2D studies
V.1 Research focus and methodology………... 162
V.2 Rigid block: Ricker tests……….. 162
V.3 Rigid block: the signals with varying central frequency………... 165
V.4 Rigid block: regional Newmark predictions……… 167
V.5 Pure topographic model: analyses settings……….. 169
V.7 Pure topographic model: regional prediction laws and updated model……... 173
B.VI Proxy for mapping of the pure topographic Ia amplification factors: based on
3D studies
VI.1 Methodology………... 176
VI.2 The Minkush target area: mining legacy and landslide hazard……….. 176
VI.3 3D modelling settings: model extraction, material sequence, input signals... 178
VI.4 The Tuyuk-Suu landslide: seismic amplification patterns………. 183
VI.5 General patterns of the Ia amplification in 3D domain……….. 187
VI.6 3D curvature: extraction and smoothing techniques……….. 190
VI.7 Atxy versus 3D smoothed curvature……….. 194
VI.8 Mapping proxy: outlines, application and discussion……… 200
B.VII Newmark method: towards an improved mapping of landslide susceptibility
VII.1 Analysed models………... 203
VII.2 Distribution of Ia: introducing At and Ag………. 204
VII.3 Advanced mapping and results comparison: Scenarios 1 and 2…………... 208
B.VIII Synthesis of results………... 212
Conclusions ………... 214
References………... 216
1
Introduction
The United Nations organization declared the 1990s as the International Decade for Natural Disaster Reduction (IDNDR). The worldwide concern was due to an increasing number of major catastrophic events, including landslides, while associated damage was also steadily growing over the past decades. According to Munich Re (2001), the number of natural hazards increased threefold over the 1990s in comparison with the 1960s, while the rate of economic losses increased by a factor of almost nine over the same period.
For many mountainous countries landslide hazards are of primary concern. An increasing rate of landslide activity is often attributed to an intensified human influence, environmental degradation and climate change (CRED-OFDA, 2002). Kyrgyzstan belongs to the list of countries where among all natural hazards the landslide activity brings the highest annual rate of economic losses and death toll. According to the Ministry of Emergency Situation of Kyrgyz Republic (2013), for the period between 1988 and 2010, the mean annual death toll attributed to the landslide activity is four times higher than the one due to earthquakes, twenty times more than the one due to snow avalanches and fifty times more than the one due to floods.
The Mailuu-Suu River Valley (southern Kyrgyzstan) and the surroundings of the Minkush settlement (central Kyrgyzstan) present two examples of areas where the landslides pose the significant threat to society and existing infrastructure. The situation is aggravated by the presence of some active landslides in close proximity to the tailing storage facilities, the legacy sites of former uranium mining in those areas. The direct and indirect landslide impacts can result in the destruction of protective infrastructure of those storage sites, potentially leading to environmental pollution. Due to this situation, both sites are recognized to be the environmentally hot-spot areas where the implementation of the remediation measures is urgently needed. Some risk reduction measures have already been applied in some of the most hazardous sites. For instance, large part of tailing № 3 in the Mailuu-Suu area was relocated to another place where it is less threatened by landslide impacts. Nevertheless, there are still many other places where the landslide activity could result in local disasters.
The Kyrgyz government and international agencies try to improve the current situation. Thus, in October 2015 the European Union has launched the project named as “Conducting an integrated environmental impact assessment and feasibility study for the safe management and remediation of the uranium legacy complex of Minkush”. A similar project for the Mailuu-Suu target area is planned to be launched in the first half of 2017. The overall objective of these projects is to conduct an integrated environmental impact assessment and feasibility study for the possible remediation and related management activities at targeted sites. Among numerous other topics, the projects goals comprise the characterisation of the landslide activity in the target area. The results of such characterisation strongly impact the selection of the remediation strategy. For example, for the Tuyuk-Suu storage site near Minkush, an on-going EU project has already selected the option of the total relocation of the tailing material to another safer place. This decision was taken due to the high probability of negative landslide impacts and water infiltration problems existing in the present location of the Tuyuk-Suu tailing. Similarly, the planned project for the Mailuu-Suu target area has an objective to characterise the landslide hazard area. The results of such characterisation can help to select the most efficient remediation options.
Both aforementioned sites are selected to be the target areas in present thesis. The developed research is structurally divided into two parts which use spatial analysis and dynamic modelling as the main research tools. The thesis has both applied and scientific objectives. The first, practically oriented part is presented in detail below.
2
Part A: Landslide susceptibility, hazard and risk – spatial analysis
I.1 Landslide classification and terminology, susceptibility versus hazard
Many countries around the world are exposed to a high level of landslide hazard and risk. This situation is especially critical for the poorest and, therefore, the most vulnerable regions of the world. In response to that, the significant resources have been invested in attempt to assess the landslide susceptibility/hazard and to produce the maps portraying its spatial distribution (CRED-OFDA, 2002). During that time, the scientific community had also put certain efforts into finalizing the common definitions of terms, such as “landslide”, “landslide susceptibility” and “landslide hazard”.
The basic concept of a “landslide” is the one of a gravitational movement of masses down a slope (Nemčok et al., 1972; Varnes, 1978; Hutchinson, 1988; WP/WLI, 1990). Landslides are classified according to the type of moving material and the type of failure (see Table AT.1). The moving material can normally consist of bedrock, consolidated soil, regolith, loose debris, various mixtures of sediment and pure water in a form of snow or ice (Bryant, 2005). According to Varnes (1978), the moving material is classified next: hard material (bedrock) and soils with coarse (debris) or fine (earth) grain size (see Table AT.1).
Table AT.1: Classification of slope movements (by Varnes, 1978).
Figure AF.1 demonstrates the main types of landslide movement. Falls occur when the moving material separates along joints, bedding or other weaknesses (Keller, 2005; Figure AF.1a). They are normally characterized by little displacement prior to failure and have very rapid to extremely rapid displacement rates (Varnes, 1978). The toppling movement listed in Table AT.1 is referred to be one variety of falling mechanism, when the forward rotation of the unit/units around some pivot point occurs (Varnes, 1978; Keller, 2005).
Flow is the downslope displacement of unconsolidated material in which particles move and mix within the mass (Keller, 2005; Figure AF.1b). The flows normally have a water content which controls the behaviour of the moving material. When the fine-grained material dominates the moving mass it is referred to as mudflow/earthflow, while debris flows normally contain coarser material (Bryant, 2005). Flow initiation and failure normally occur over a few hours to a few days, when the movement is extremely rapid with a rate of hundreds of meters per a few tens of seconds (Evans and DeGraff, 2002).
Slides are the coherent movements of material over one or more failure surfaces (Keller, 2005; Figure AF.1c). These failure surfaces can have curved or planar shape. The first case, i.e., curved failure surface is characteristic for the rotational slides/slumps (see Figure AF.1d). Translational slides and lateral spreads normally have planar sliding surfaces, such as faults, joints, a clay layer or a contrast between soft and hard rocks (Abbott, 2009).
3
Figure AF.1: Types of landslide movements (by Keller, 2005).
A literature review suggests that the terms of “landslide susceptibility” and “landslide hazard” are often mixed, while there is a clear concept separating them. The landslide susceptibility is considered to be the likelihood of a landslide occurring in an area depending on the local terrain conditions (Brabb, 1984). Another definition proposes that landslide susceptibility indicates the degree to which a terrain can be affected by slope movements and shows an estimation of “where” landslides are likely to occur (Guzzetti, 2006). Susceptibility does not consider the temporal probability of failure (i.e., when or how fast/frequently landslides occur), nor the magnitude of the expected landslide (i.e., how large or destructive the failure will be; Committee on the Review of the National Landslide Hazards Mitigation Strategy, 2004).
Landslide hazard is the probability that a landslide of a given magnitude will occur within a given period and in a given area. Besides predicting “where” the slope failure will occur, landslide hazard forecasts “when” or “how frequently” it will occur, and “how large” it will be - in this matter, landslide susceptibility is considered to be the spatial component of landslide hazard (Guzzetti et al., 2005).
According to Guzzetti (2006), landslide susceptibility and hazard mapping involves the degree of interpretation, which relies on several wide-adopted assumptions:
1. Slope failures are marked by features which can be recognized, classified and mapped in the field or through remote sensing;
2. Landslides are controlled by mechanical laws which can be determined empirically, statistically or deterministically. These instability conditions can be regionally mapped and applied in predictive models for the mapping of landslide susceptibility/hazard;
3. The future slope failures will most likely occur under the conditions which also led to past and present instability cases;
4. Spatial and temporal landslide occurrence can be inferred from heuristic investigations, computed through the analysis of environmental information or inferred from the physical models.
Ideally, any method of landslide susceptibility/hazard mapping should rely on all assumptions. Practically, all existing methods use just some of them, which limit the final reliability of these methods. The main concept of landslide susceptibility zoning involves a rating of the terrain units according to their propensity to produce landslides, i.e. landslide occurrence probability (Fell et al., 2008). There are various methods of landslide susceptibility mapping and they vary depending on input data, landscape, purposes and available resources. The next section reviews a classification of all existing method and presents a short description of them.
4
I.2 Classification of landslide susceptibility mapping methodsA review of existing landslide susceptibility mapping methods is presented by Guzzetti (2006) and Mouchel (2011). The authors outlined four main groups of the mapping methods, namely: (i) geomorphological; (ii) heuristic (index-based); (iii) process-based (conceptual) and (iv) statistical modelling. In general, these mapping methods are subdivided into the direct/non-direct and qualitative/quantitative ones (Varnes and IAEG Commission on Landslides and other Mass-Movements, 1984; Carrara and Guzzetti, 1995; Hutchinson, 1995 among others). The proposed classification of methods is “fuzzy”, as involved concepts and/or applied computational solutions often have a certain degree of similarity.
The classification into quantitative and qualitative methods reflects the output provided by these methods (see Figure AF.2). The qualitative ones provide subjective and pure descriptive (non-quantitative) estimates of the landslide susceptibility level. The quantitative methods provide the output in numerical terms, i.e. a probability of landslide occurrence in any given area.
Figure AF.2: Classification of existing mapping methods based on provided output (by Mouchel, 2011). Direct methods are based on the geomorphological mapping of landslide susceptibility applying field observations and data gained from interpretation of the aerial photographs or satellite images (Verstappen, 1983; Nossin, 1989). In most cases, but not necessarily, direct methods are associated with a production of the landslide inventory maps, which become a basis for further susceptibility ranking. The direct methods apply an expert-based opinion and normally do not involve a lot of automatic data post-processing.
Indirect methods are considered to be essentially stepwise and should normally contain the next investigation/processing stages: (i) preparation of the landslide inventory map; (ii) identification and mapping of the instability factors; (iii) estimate of a relative input of all instability factors into a final susceptibility level; (iv) classification of a studied area into the domains with certain level of landslide susceptibility; (v) assessment of model performance and model fit.
As it was noted above, the boundaries between different methods are not rigid. Some methods present a certain grade of hybridization. Nevertheless, there is certain conceptual difference between four main groups of methods. The next sub-sections review in more details a concept and methodology involved in each group.
I.2.1 Geomorphological mapping
The geomorphological mapping represents a direct (sometimes indirect) method which can be considered as an expert-based mapping methodology. This qualitative approach relies on the ability of investigator to track
5
a relationship between the landslide activity and the factors, affecting instability level (see an example in Figure AF.3). Normally this method also considers a historical evolution of landslide activity together with an analysis of possible consequences (Humbert, 1977; Kienholz et al., 1978; Bosi et al., 1985; Zimmerman et al., 1986; Seeley and West, 1990; Hansen et al., 1995 among others). The collected information provides a basis for a landslide susceptibility mapping, when the susceptibility ranking strongly depends on the observed relationship between the affecting factors and instability cases. Such kind of mapping is considered to be a form of an expert judgment which involves certain subjectivity depending on the investigator experience. It is very difficult to formalize the mapping methodology due to a presence of subjective opinion. Nevertheless, for example, Cardinali et al. (2002) and Reichenbach et al. (2005) present the attempts to develop the semi-automated expert-based mapping techniques.
Figure AF.3: An example of the geomorphological mapping of the landslide susceptibility for the target area presented by the whole territory of Kyrgyzstan (by Ministry of Emergency Situation of Kyrgyz Republic, 2013).
I.2.2 Heuristic methods
The heuristic or index-based approach is considered to be the indirect or semi-direct, mostly qualitative mapping method. It is based on the priory knowledge on the link between landslide activity and instability factors. The method application normally involves classification, ranking and weighting of the instability factors with a following mapping of the landslide susceptibility. To some extent this method is considered to be an expert-based approach, as a selection of affecting factors and analysing procedure directly depend on the investigator (see an example in Figure AF.4). There are several applied examples, when the heuristic decision rules were employed for a mapping of the landslide susceptibility in the different target areas (Nilsen and Brabb, 1977; Hollingsworth and Kovacs, 1981; Neeley and Rice, 1990; Montgomery et al., 1991; Pachauri and Pant, 1992; McClelland et al., 1997; Nagarajan et al., 2000; Lee et al., 2002; Liu et al., 2004; Moreiras, 2005 among others).
The main disadvantage of an index-based approach originates from the subjective consideration of the involved affecting factors. Another disadvantage comes from the point that this approach does not consider a complex interaction between different factors. For example, Guzzetti (2006) comments that this method separately considers slope and lithology, like it is in Figure AF.4, while a complex interaction of them should be taken into account.
6
Figure AF.4: The index-based landslide susceptibility mapping in the Rio Mendoza Valley, Argentina applying lithologic and slope angle thematic layers (by Moreiras, 2005).
I.2.3 Process-based methods
Another group of landslide susceptibility mapping methods is presented by the process-based or conceptual models. This set of methods relies on the physical laws controlling the slope stability, i.e., they estimate the balance between stabilizing and driving forces acting along a potential sliding surface. These models often apply a simplified concept generalizing all specific cases of the landslide occurrence under one single model. The simplification often considers a planar sliding surface situated at a fixed depth and parallel to the topographic surface. Such models are mostly developed to study a particular type of landslides (e.g., shallow soil slides, debris flows, rock falls, etc.) or to investigate the effect of a specific trigger, i.e. an intense rainfall period or an earthquake.
In our studies we apply the regional Newmark method which belongs to the group of the process-based models. The Newmark models are developed for a regional seismic slope stability analysis. It is based on an original technique developed by Newmark (1965). The author suggested that co-seismic slope displacement can be calculated by the double integration of the part of the impacting acceleration-time history exceeding the critical acceleration value, which is a function of the Factor of Safety of the studied slope. Several authors have later adapted this concept to a regional application. These adapted concepts are relying on the empirical laws rather than on the precise stability calculations and integration of the affecting seismic signal (Wilson and Keefer, 1983; Wieczorek et al., 1985; Jibson, 1993; among others). As an example, Figure AF.5 presents the results of seismic landslide susceptibility mapping in the Oat Mountains, California obtained by application of the regional Newmark method (Jibson et al., 1998).
Part B of this thesis applies the set of the dynamic simulations to analyse the original Newmark (1965) technique as well as its regional models. It will be shown that our simulations suggest some conceptual improvements of the existing mapping methodology. These improvements should finally increase the reliability of model predictions.
7
Figure AF.5: The distribution of Newmark displacement and landslide susceptibility mapped by regional Newmark method in the Oat Mountains, California (by Jibson et al., 1998).
Some other process-based methods consider the rainfall as the main factor triggering slope instability. These models basically analyse the shallow rainfall-induced landslides and they normally employ simplified stability models widely adopted in geotechnical engineering. The analysis includes a complex consideration of the conventional parameters such as the normal stress, angle of internal friction, cohesion, pore water pressure, external loads, etc. Many authors present applications of the regional models studying the rainfall-induced landslides (Ward et al., 1981, 1982; Dunne, 1991; van Ash et al., 1999; Gritzner et al., 2001; Lan et al., 2005 among others).
The physical-based models studying the regional rock fall potential are presented by van Dijke and van Westen (1990). Following this concept, Guzzetti et al. (2002) apply Digital Elevation Model (DEM) and spatially distributed information to simulate three dimensional rock fall failure for areas ranging from a few thousands of square meters to several hundreds of square kilometers. The results of these studies normally include the extent/location of the areas potentially subjected to the rock falls, the estimates of the maximum velocity and the maximal travel distance.
I.2.4 Statistical methods
The statistical modelling is an indirect and quantitative method. It determines the landslide susceptibility through a description of functional relationships between the instability factors and the past and/or present distribution of slope failures (Carrara, 1983).
The simplest statistical methods are based on a determination of the relative abundance (proportion, percentage, frequency) of the landslides in the ranked classes representing the geographical distribution of the stability/instability factors. In general, these methods are classified according to a general instability index (e.g., Carrara, 1978), a landslide susceptibility/hazard index (e.g., Sarkar et al., 1995), a frequency index (e.g., Parise and Jibson, 2000) and a surface percentage index (e.g., Uromeihy and Mahdavifar, 2000). These indexes provide a direct or weighted measure of a relative/absolute abundance of a landslide area or a number of them in the different terrain categories. This information is further applied by the investigator to establish the susceptibility levels in different parts of study area.
Michie et al. (1994) made an overview of more advanced statistical methods (Figure AF.6). These methods employ different “philosophical” concepts and can be classified as follows: (i) classical (frequentist or Fisherian) statistical techniques, (ii) modern (subjectivist or Bayesian) statistical methods, (iii) fuzzy logic systems, (iv) artificial neural networks and (v) expert systems.
8
Figure AF.6: Classification of advanced statistical modelling (by Michie et al., 1994).
The classical, “frequentist” approach is further subdivided into the next techniques: (i) bivariate analysis, (ii) multiple regression analysis, (iii) discriminant analysis (DA) and (iv) logistic regression analysis. DA and logistic regression analysis are recognized to be the most wide-spread techniques (Guzzetti, 2006).
DA employs a classification of the samples or cases into one of several mutually exclusive groups based on their values for a set of predictor variables (Fisher, 1936). For the landslide susceptibility mapping the classification cases are presented by the landslides, while the exclusive groups are presented by the mapping units with instability potential (with landslides) and those without instability potential (free of landslides). The interaction between predictor variables (affecting factors) and the landslide occurrence is further analysed. It provides a basis to establish the instability potential in any part of the study area expressed via the value of the sliding probability (see an example in Figure AF.7).
Figure AF.7: Landslide inventory and landslide susceptibility maps for Collazzone study area, Italy (landslide susceptibility is mapped by the DA method - by Guzzetti, 2006).
9
Cox (1958) was the first to introduce the Logistic Regression Analysis (LRA) to investigate a binary response from a set of measurements. This technique predicts the success or failure of a process based on a set of the measurements (Michie et al., 1994; Brown, 1998). Landslide susceptibility studies often employ a curvilinear model relationship between the independent variables (affecting factors) and the response (landslide presence/absence). The mapped distributions of affecting factors are later used to estimate the instability potential in a study area on the basis of the Bernoulli probability. This value indicates if a certain area belongs to a stable or non-stable mapping unit.
Another group of advanced statistical methods employs the Bayesian theorem for the conditional probability, which represents a chance of a hypothesis being true or false given a piece of evidence (Gorsevski et al., 2003). This approach proposes the way to deal with the uncertainties normally involved in the landslide susceptibility mapping (Chung and Fabbri, 1999; Gorsevski et al., 2003). The Bayesian theorem is applied to determine the probability that a region will have slope failures considering the local environmental conditions. According to Guzzetti (2006), there are several techniques which employ a similar idea, namely: weight of evidence methods, weighting factors, weighted linear combination of instability factors, landside nominal risk factor, likelihood ratio, certainty factors, information value and modified Bayesian estimation. These methods are often difficult to differentiate, as they often mix with each other. An advantage of the Bayesian probabilistic modelling is the possibility to introduce uncertainty into the susceptibility model and to explicitly consider an expert knowledge which often exists for the investigated area (Chung and Fabbri, 1999).
Figure AF.6 also presents a group of techniques referred to as the fuzzy logic system. Zadeh (1975) developed a fuzzy set theory which updated the ordinary set theory. The original technique, i.e., ordinary set theory, allows an element to have only 0 or 1 values as possible membership degrees. The fuzzy set theory allows the membership degree (landslide susceptibility) to be any value from 0 and 1. In the case of the landslide susceptibility mapping each affecting factor is ranked into the classes and the following analysis establishes a membership degree for a link between the landslide presence/absence and the parameter class (e.g., the presence of landslides in the 10-20 degree slope class). Such kind of analysis is performed for all affecting factors and the analysis results are integrated at the end to get the final value of landslide susceptibility. Figure AF.8 presents an example of fuzzy logic application – the authors analysed lithology, slope angle, slope aspect, land cover, level of weathering, fault distance and anthropogenic impact as affecting factors in this study (Champati ray et al., 2007)
Figure AF.8: Landslide susceptibility mapping for Bhagirathi valley, Himalaya applying fuzzy integration of membership values (by Champati ray et al., 2007).
10
The Artificial Neural Networks (ANN) and expert system methods presented in Figure AF.6 are integrated into one common group referred as an expert knowledge approaches. A more detailed description of ANN is presented in the section, where it is applied to the mapping of landslide susceptibility in our target area. Conceptually, ANN reproduces the behaviour of human brain in solving complex problems (Michie et al., 1994). At first, the training areas are applied to establish a link between a distribution of affecting factors and landslide occurrence. At the last step, the observed relationships are “spread” over the rest of a study area to estimate the landslide susceptibility level for each part of it (see an application example in Figure AF.9).
Figure AF.9: Landslide susceptibility mapping for the Riomaggiore River valley, Italy, applying different techniques of Artificial Neural Networks (by Ermini et al., 2005).
Expert systems are computer programs capable of exploiting complex information to make decisions based on a set of the rules (Michie et al., 1994). The decisions taken by the expert system include categorization, which means selection between the possible alternatives. The rules applied in the expert systems can be established a priori or defined by the same system by learning from the errors. The expert systems provide a possibility to establish rules for the special cases or individual instability events, which cannot be performed by other statistical or physically based models. There are several documented cases, when rule-based expert systems are employed for the landslide susceptibility mapping (Al-Homoud and Masanat, 1998; Al-Homoud and Al-Masri, 1999; Pistocchi et al., 2002).
Data mining can be considered as part of the expert systems. Its implementation in the quantitative landslide susceptibility mapping has strongly advanced during the last decade. The data mining algorithms simulate the process of expert decision making by classifying the terrain into stable and unstable regions according to particular parameters (Fernandez-Steeger, 2002). An ability to deal with non-linear problems is considered to be the major advantage for analysis of slope stability problems (Lee et al., 2003). This tool has also proved to be robust for the analysis of incomplete or noisy data, which is often a problem for spatially distributed information (Melchiorre et al., 2008). As both categorical and continuous data are allowed, it avoids a data classification which normally involves subjectivity. The data mining algorithms are often referred to as
11
“black box” models, and their application demands a deep understanding of the data preparation and post-processing steps (Fayyad et al., 1996).
A good example of application of data mining tools to landslide susceptibility mapping is presented by Braun (2010). The author applied three different techniques (ANN, Bayesian network and Ensemble) to map the landslide susceptibility in the Mailuu-Suu River Valley, Southern Kyrgyzstan. Figure AF.10 presents snapshots of some of the landslides in the study area. The author shows that ANN mainly outlines areas with landslides, while Bayesian network proved to be a perspective technique for the landslide susceptibility mapping (it has better prediction capabilities, while ANN is best in recognition).
Figure AF.10: The zoom to some of the landslides in the Mailuu-Suu River Valley, Kyrgyzstan together with the results of automatic recognition of existing landslides applying ANN, Bayesian network and Ensemble models (by Braun, 2010).
I.3 Landslide hazard mapping
The well-adopted concept of landslide hazard states that it represents the probability of the potentially damaging landslide to occur within a specified period of time and within a given area (Varnes and the IAEG Commission on Landslides and other Mass-Movements, 1984). Guzzetti et al. (1999) modified this definition by inclusion of the landslide magnitude. Thus, the authors mathematically expressed the landslide hazard (HL) as follows:
HL = ML* SL* TL (AE.1),
where ML is the probability of landslide magnitude exceedance, SL is the spatial probability (landslide
susceptibility) and TL is the temporal probability of the landslide occurrence.
Different methods of the landslide susceptibility (SL) mapping have already been described in the preceding
section. According to Equation AE.1, it is obvious that only quantitative mapping methods are suitable to landslide hazard zonation, as it applies a numeric measure of SL. The geomorphological and some
index-based methods do not fulfil this criterion, while the groups of conceptual and statistical methods provide a numeric measure of landslide susceptibility (see Figure AF.2).
12
There is no common opinion on the definition of the landslide magnitude exceedance probability (ML). For
example, Guzzetti (2006) proposes the landslide area (size/volume) to be a proxy of landslide magnitude measure. The authors analysed five multi-temporal landslide inventories for the Staffora River basin, Italy and estimated the distribution of the mean landslide area (see Figure AF.11) which later was considered as proxy to estimate ML. Many other authors prefer to relate the landslide magnitude to a measure of energy
released during landslide failure. For instance, Hungr (1997) relates the landslide magnitude to its destructive potential. Raetzo et al. (2001) introduces an intensity scale for the damage magnitude. This last term, i.e., landslide destructive/damaging potential is suggested to be a function of the landslide volume and the expected landslide velocity (Cardinali et al., 2002; Reichenbach et al., 2005).
Figure AF.11: (a) Probability density and (b) probability for the mean landslide area in the Staffora River basin, Italy - solid blue line is inverse gamma distribution and dotted red line is a double Pareto distribution (by Guzzetti, 2006).
The third term in Equation AE.1 is presented by the temporal probability of the landslide occurrence (TL). It
is estimated by an analysis of the multi-temporal landslide inventories (Coe et al., 2000; Guzzetti et al., 2003; Guzzetti et al., 2005). To calculate this parameter the landslides are considered to be independent point events randomly distributed in time (Crovelli, 2000). Two models are commonly applied to investigate the occurrence probability of these point events: the Poisson and the binomial models (Crovelli, 2000; Coe et al., 2000; Önöz and Bayazit, 2001; Vandine et al., 2004; Roberds, 2005 among others). Other models of the landslide temporal probability can include the Weibull distribution (Bebbington and Lai, 1996) and the mixed exponential distribution (Nathenson, 2001).
Crovelli (2000) compared the Poisson and the binomial probability models for a set of multi-temporal landslide inventories. It was shown that both models differ for the short prediction period (recurrence interval), while the larger time periods are characterized by very similar estimates. Figures AF.12b and AF.12c present the examples of temporal probability mapping applying five multi-temporal inventories, summarized in Figure AF.12a (Guzzetti, 2006). The Poisson probability model was adopted to map the temporal probability for 25-year (Figure AF.12b) and 50-year (Figure AF.12c) recurrence intervals.
13
Figure AF.12: (a) Cumulative landslide inventory compiled on the base of five multi-temporal inventories, including relict and old landslides (grey poligons) for the Staffora River Valley, Italy; (b) temporal probability map for 25-year recurrence interval and (c) temporal probability map for 50-year recurrence interval (by Guzzetti, 2006).
I.4 Mapping units
The preceding sections reviewed the main methods of landslide susceptibility and hazard mapping. These methods are applied in a given study area and one of the main parameters in this regional analysis is the type of mapping unit. It represents a portion of land surface which contains a set of ground conditions that differ from the adjacent units across definable boundaries (Hansen, 1984). The regional landslide susceptibility/hazard studies normally employ six groups of mapping units, namely: (i) grid cells, (ii) terrain units, (iii) unique condition units, (iv) slope units, (v) geo-hydrological units, (vi) topographic units, and (vii) geographical units. Figure AF.13 presents extracts of landslide susceptibility maps illustrating different types of mapping units, like grid cells (Figure AF.13a), unique condition units (Figure AF.13b) and slope units (Figure AF.13c).
Figure AF.13: The results of the landslide susceptibility mapping, portrayed by different types of mapping units, like (a) grid cells, (b) unique condition units and (c) slope units.
14
According to Carrara and Guzzetti (1995) the selection of an appropriate mapping unit depends on a number of factors, like: (i) studied type of landslide, (ii) scale of the studies, (iii) available resources, (iv) quality, resolution and type of the input thematic information, (v) availability of the analysis tools (software) and (vii) type of the method applied for the landslide susceptibility/hazard mapping.
Table AT.2 summarizes the application of different mapping units in the groups of the susceptibility mapping methods, described above. The grid cells are preferred by the heuristic, statistical modeling and process-based methods. The unique conditions units are mostly used in the heuristic methods and statistical modelling (van Westen et al., 1993; Carrara and Guzzetti, 1995; Ardizzone at al., 2002). The slope units and geo-hydrological units are often used for the statistical modelling (Carrara et al., 1991; Ardizzone et al., 2002), whereas topographic units are used in the process-based models (Montgomery and Dietrich, 1994). Table AT.2: Application of the mapping units in the different methods of the landslide susceptibility mapping (by Guzzetti, 2006).
Geomorphological mapping Heuristic (index-based) Statistical modelling Process-based (conceptual) Grid cell x x x Terrain unit x
Unique conditions unit x x
Slope unit x
Geo-hydrological unit x
Topographic unit x
Geographical unit x
The grid cells subdivide the target area into a set of the regularly distributed elements (pixels) which can have square, rectangular, triangular or hexagonal shapes (see an example in Figure AF.13a). It works well for areas where the input parameters/properties have sharp and distinct boundaries. The cases of gradual and smoothed change of parametric limits can also be presented by grid cells, but this requires an adaptation of the cell size.
The terrain unit subdivision is considered to be an expert-based approach, when the study area is delineated based on the similarity of geomorphologic and geologic conditions. The subjectivity of delineation is a disadvantage of these mapping units. Additional disadvantage comes from the fact that landslide susceptibility can often not be related to specific geomorphologic and geologic settings.
The unique condition units (UCUs) may be partly similar to the terrain units. They are extracted through a subdivision of the target area into the zones of similar properties (unique conditions). For example, this subdivision can represent the zones of similar geology, elevation and slope angle, like it was for a case shown in Figure AF.13b. Once all thematic layers are ranked, the further extraction of UCUs can be performed automatically. This process can often create a large number of small groups of unique conditions. Additional disadvantage is the subjectivity involved during a choice and ranking of the input thematic layers. The slope units represent hydrologic regions, in other words, small-scale drainage and catchment areas (see an example in Figure AF.13c). The subdivision process can be provided manually or automatically based on the DEM of target area. The problems often appear when a scale/size of slope unit should be adapted to the size of studied landslides. For example, a study of the big deep-seated landslides would need bigger scale slope units, while small and shallow slides would need a finer subdivision.
The extraction of geo-hydrological units is based on the slope units which are further subdivided into the zones of similar conditions, e.g. of similar lithology. This subdivision can also be based on a change of land use or land cover. It works well when the landslide susceptibility is strongly related to a change of some key factors, e.g., to a change of rock type.
The topographic units result from a vector-based subdivision, when a catchment area or a single slope is subdivided into the stream tube elements of irregular size and shape (Guzzetti, 2006). The upper and lower boundaries of a stream tube are defined by the adjacent contours, and the lateral boundaries are delineated by the flow lines orthogonal to the contours (O’Loughlin, 1986; Moore et al., 1988; Moore and Grayson, 1991). The topographic and geo-hydrological units are the special cases of the slope units. Therefore, these mapping units are also impacted by the subjectivity introduced during delineation process.
The geographical units are based on the national, political, administrative or demographic borders. This type of units is often applied to the big-scale landslide susceptibility studies, like country scale, for example. The
15
main limitation of these units is that they do not reflect the morphologic, hydrological, lithological and other parametric boundaries, while landslide susceptibility is directly related to them. Nevertheless, some landslide susceptibility methods can apply these units. For example, Guzzetti and Tonelli (2004) employed the historical records to estimate the landslide susceptibility for different regions in Italy. A data representation in a shape of geographical units is very appealing to the politicians and decision-makers working at the regional/national scales (Guzzetti, 2006).
I.5 Spatial analysis tools: Geographic Information Systems and Remote Sensing
The conceptual framework of landslide susceptibility/hazard assessment was reviewed in the previous sections. In the following one we will describe the tools and software solutions applied in these studies. The instrumental tools widely applied in the regional mapping of landslide susceptibility/hazard are referred to as spatial analysis tools and include Geographic Information Systems (GIS) and Remote Sensing (RS) techniques. According to the most general definition, RS is an acquisition of information about an object/phenomenon without making a physical contact with them, and GIS is a system designed to capture, store, manipulate, analyse, manage and present all types of geographic data with main application in 2D (Williams, 2001). Earth Remote Sensing (ERS or simply RS) can be defined as the measurement of object properties on the Earth’s surface using data acquired from aircrafts and satellites (Prost, 2001). From a broader scope, ERS or RS can be defined as the set of scientific and applied approaches which utilise aerial or satellite sensor technologies to detect and classify objects on the Earth by the means of propagated signals, e.g., electromagnetic radiation (Campbell, 2011).
Early discussions on a link between these spatial tools only considered RS as a source of a spatial information for the GIS database (Peplies and Keuper, 1975), while interpretation of the RS imagery was considered to be a separate research domain (Marble et al., 1983). More recent concepts tend to treat RS and GIS in a more general framework, as both tools can be mutually related (e.g., Parker, 1988; Star and Estes, 1990 among others). For example, while RS provides additional input into the spatial database, GIS is often applied to improve imagery quality/accuracy (Sabins, 1996).
At present time, GIS and RS are widely applied in numerous domains, spanning from the engineering/planning to insurance/business activities. The regional studies are highly demanded in earth sciences. For instance, GIS and RS are employed in atmospheric sciences, oceanography, geology and physical geography. A more detailed overview of these spatial analysis tools is presented in the next sub-sections.
I.5.1 Geographic Information Systems
From a technical point of view, GIS is considered to be an organised database, which assembles and relates different types of information based on their geographic location (Prost, 2001). GIS, as a spatial analysis tool, has 40 years of history which started from the initial attempts of the Canadian Geographic Information Survey to employ geographically related polygons in assessing land use properties (Williams, 2001). A growing importance of GIS is related to the large number of possibilities available in this tool:
- to locate studied objects in a desired geographic coordinate system (georeference); - to relate the georeferenced objects with respect to each other;
- to convert and adapt spatial data in the formats applied for further analysis or data modelling; - to visualise a set of the spatial data in a user-friendly format.
Due to these options GIS is a very perspective tool for a lot of tasks in engineering, science, social studies and economics. A progress of GIS application is strongly related to the hardware/software developments, as data manipulation needs a rapid processing. An increasing calculation capacity gives more perspectives for the data modelling/representation in the 3D domain, while in some applied areas, e.g., construction, geological prospecting and mining engineering 3D GIS tools have already been widely applied during the last 15-20 years.
The RS imagery or a georeferenced topographic map often become a basic platform to which other data are related based on their geographic location. These data include any types of physical information, like geology, road network, engineering constructions, technical infrastructure, lifelines, etc. It can also include an output from a preceeding data analysis, i.e., the results of geophysical surveys, sampling data, etc.