HAL Id: dumas-00854995
https://dumas.ccsd.cnrs.fr/dumas-00854995
Submitted on 28 Aug 2013HAL is a multi-disciplinary open access archive for the deposit and dissemination of sci-entific research documents, whether they are pub-lished or not. The documents may come from teaching and research institutions in France or
L’archive ouverte pluridisciplinaire HAL, est destinée au dépôt et à la diffusion de documents scientifiques de niveau recherche, publiés ou non, émanant des établissements d’enseignement et de recherche français ou étrangers, des laboratoires
Energy Measurements for Cassandra Cloud Storage
System: Exploring and improving Energy-Consistency
Tradeoff
Yue Li
To cite this version:
Yue Li. Energy Measurements for Cassandra Cloud Storage System: Exploring and improving Energy-Consistency Tradeoff. Distributed, Parallel, and Cluster Computing [cs.DC]. 2013. �dumas-00854995�
M
ASTER RESEARCHI
NTERNSHIPM
ASTER RESEARCHI
NTERNSHIP REPORTEnergy Measurements for Cassandra Cloud Storage System:
Exploring and improving Energy-Consistency Tradeoff
Author: Yue LI Supervisor: Gabriel ANTONIU Shadi IBRAHIM Houssem CHIHOUB Luc BOUGE KerData, INRIA
Contents
1 Introduction 3
2 The state of the art 5
2.1 Replication . . . 5
2.2 Consistency in cloud storage system . . . 5
2.2.1 CAP theorem . . . 5
2.2.2 consistency models . . . 6
2.3 Cassandra storage system . . . 8
2.3.1 Partitioning in Cassandra . . . 8
2.3.2 Replication in Cassandra . . . 9
2.3.3 Consistency in Cassandra . . . 10
2.3.4 Reads and writes in Cassandra . . . 12
2.4 Energy management in Cloud . . . 12
2.5 Related work . . . 13
2.5.1 Consistency management in cloud storage system . . . 13
2.5.2 Energy management in cloud storage system . . . 15
3 Energy Measurements for Cassandra Cloud storage system 17 3.1 Methodology . . . 17 3.1.1 Grid’5000 testbed . . . 17 3.1.2 Experiment tools . . . 18 3.2 Experiment setup . . . 19 3.3 benchmarks . . . 19 3.4 Macroscopic analysis . . . 21
3.4.1 Energy consumption in different consistency levels . . . 21
3.4.2 Energy consumption in different access pattern . . . 21
3.4.3 Energy consumption in different loads . . . 21
3.5 Microscopic analysis . . . 24
4 Data-layout policies 27 4.1 Overview . . . 27
4.2 Implementation . . . 27
4.2.1 Even data distribution . . . 27
4.2.2 Uneven data distribution . . . 28
5 Evaluation 30
Abstract
Cassandra is an open-source cloud storage system that offers three types of consis-tency per-operation including weak, eventual and strong consisconsis-tency. It is being used by many data-center applications (e.g., Facebook, AppScale). Most existing research efforts have been dedicated on exploring and improving performance, consistency-latency and consistency-monetary cost tradeoffs. In contrast, little work is focusing on energy-consistency tradeoff. As power bills have become a substantial part of the mon-etary cost for operating a data-center, this report aims at providing more clear under-standing of the interplay between consistency and power consumption. Accordingly, a serious of experiments have been conducted to explore the implication of different fac-tors including the selected consistency level and the access pattern and the load of the running applications on the energy-consumption. Our experiments have revealed a no-ticeable energy consumption variation according to the selected consistency and the ac-cess patten and load exhibits by the application. Moreover, we observe that this variation is contributed to by the obtained throughput of the applications and also by the uneven distribution of the loads amongst different nodes in the Cassandra system. Accordingly, we have proposed three data-layout policies and we evaluate the energy-consumption of these policies in Cassandra through experiments. Interestingly, we have achieved 24% energy saving when assigning 50% of the nodes to the warm pool for the applications with moderate ratio of reads and writes when applying eventual (Quorum) consistency. Keywords: Cloud storage system, Cassandra, Eventual Consistency, Energy consumption,
power efficiency, Data-layout,
Acknowledgement : My deepest gratitude goes first and foremost to Shadi Ibrahim, Houssem Eddine Chihoub, my supervisors, for their constant encouragement and guidance during my internship. They have walked me through all the stages of work from problem analysis, experiment setup and results presentation. Without their consistent and illumi-nating instruction, this thesis could not have reached its present form. I am also grateful to Gabriel Antoniu who accepted me as an internship student and his warm welcome for working at Kerdata. I would like to express my warmest gratitude to Prof. Luc Bougé, for his instructive suggestions and valuable comments on the writing of this thesis. I also owe my sincere gratitude to Alexandru Costan, Zhe Li, Radu Tudoran, Rui Wang, who gave me their help and time in listening to me and helping me work out my problems during the difficult course of the thesis.
1
Introduction
Cloud computing is a new computing paradigm which can deliver scalable, flexible and eco-nomical functionalities to external customers. Cloud computing offers three distinct classes of service such as IaaS (Infrastructure-as-a-Service), PaaS (Platform-as-a-Service) and SaaS (Software-as-a-Service) to users. Users are therefore able to outsource their infrastructures, harness their application development and use online software at a low cost according to their acquired service in Pay-As-You-Go manner. In the context of IaaS, Cloud providers offer two main types of resources: computing resources and storage resources. This report focuses on the cloud storage services.
Cloud storage system is a set of networked and geographically distributed machines where client’s data can be stored and retrieved. With the help of cloud storage system, users do not need to save their data on the local disk or on their physical storage infrastructures device. Alternatively, they need only to upload their data to the cloud storage system and access it via Internet as they want from any location. Compared to the traditional data stor-age system, cloud storstor-age system has several advantstor-ages. For example, it can provide rapid access to data for users as long as they have Internet. All of storage infrastructure main-tenance work are offloaded to the responsibility of service provider. Users can save their cost for storing data because they only pay for storage service so that they avoid the cost on purchasing the physical storage infrastructure. Amazon Simple Storage Service (Amazon S3) [22] is a typical cloud storage service which can used to store and retrieve any amount of data at any time from anywhere on the web.
Cloud storage system should provide high quality of service including high-availability and high-performance to users. To achieve these requirement the cloud storage system re-lies on data replication as an essential technique. Data files are usually copied to different geographically located sites and when some sites are down users can access to other sites to retrieve the data. However, the design and implementation of data replication in cloud storage system comes at the cost of consistency: it must guarantee that all the replica should appear the same to the outside observer at all times. Ensuring strong consistency introduces delays as all the replica need to be synchronized, therefore the performance will be degraded and even it will make the system unavailable.
Cloud storage system spans over multiple sites, this requires that system to be able to continue operating correctly even if the network link is broken. CAP Theorem, which was firstly introduced by Eric Brewer [5] in 2000 and then proven [16] in 2002 states that it is impossible to make cloud storage system be consistent, available, and partition-tolerant at the same time. Only two of these requirements can be satisfied and one on them must be dropped when designing cloud storage system.
Recently, many cloud storage system have opted to relax consistency constraint in order to achieve high availability. Some weak consistency models are introduced to satisfy these needs on availability. These models don’t oblige all the nodes to be consistent all the time so they can be applied to some applications which don’t have such high consistency require-ment. Eventual consistency is another approach to make the tradeoff between consistency and availability. It allows some nodes to return some stale data but ensures that all the nodes will be eventually consistent. In eventually consistency model the consistency level can be tuned at each read or write operation according to the service needs.
Cassandra [19] is such an open source distributed key-value storage system that is widely used as a backend storage system of many large scale web applications (e.g., Facebook). Cassandra provide a highly available and scalable service with no single point of failure by virtue of flexible (i.e., configurable) consistency: Cassandra offers three types of con-sistency per-operation including weak, eventual and strong concon-sistency. Cassandra nodes span across multiple data-centers and is recently used by many data-center applications (e.g., Facebook, AppScale). Most existing research efforts have been dedicated on explor-ing and improvexplor-ing consistency-performance, consistency-latency and consistency-monetary cost offs [10] [18] [9]. In contrast, little work is focusing on energy-consistency trade-off. As power bills have become a substantial part of the monetary cost for operating a data-center. For example, Hamilton [29] estimated that, in 2008, the cost of power on servers and colling units had exceeded 40 percent of total cost for data centers, which reached more than 1 million per month for a single data center. Moreover, the cost is still increasing as both prices of power and scale of data centers are rising. Therefore, improving energy efficiency has become an increasingly important issue for data center operators. Consequently, this re-port aims at providing more clear understanding of the interplay between consistency and energy consumption and offers useful insight into designing power-efficient techniques for Cassandra cloud storage system.
In this work, a serious of experiments have been conducted to explore the implication of different factors including the selected consistency level and the access pattern and the load of the running applications on the energy-consumption in Cassandra Cloud storage system. Interestingly, our experiments reveals that the energy consumption varies not only according to the selected consistency model but also according to the access patten and load exhibits by the application. To understand more our results, we zoomed on Quorum con-sistency in Cassandra. Our in-depth analysis reported that this variation is contributed to by the obtained throughput of the applications and also by the uneven distribution of the loads amongst different nodes in the Cassandra system. For example, the difference between energy usage among the data nodes varies from 10.4% to 30%.
Accordingly, we have proposed three data-layout policies that divide the nodes into warm and cold pool by statically controlling the number of nodes participating in the oper-ations (i.e., introducing unbalanced distribution of the data amongst the Cassandra nodes) and we evaluate the energy-consumption of these policies in Cassandra through experi-ments. Interestingly, we have achieved 24% energy saving when assigning 50% of the nodes to the warm pool for the applications with moderate ratio of reads and writes when applying eventual (Quorum) consistency.
This report is organized as follows. Section 2 presents the state of the art about replication and consistency in cloud storage system and the problem which motivates our investigation. Section 3 details the power measurement experiment methodology and analysis the results obtained from the experiments. Section 4 proposes the optimization solutions according to the results and presents to the next experiment to evaluate our solutions. Section 5 presents the results of solutions and analyses the best solution in all cases. Finally Section 6 conclude the report and discusses the future work for improving our solution.
2
The state of the art
This section firstly talks about replication policies and consistency strategy in cloud storage system and we explain the consistency issues caused by replication. We introduce the CAP theorem and it shows that consistency, availability and partition-tolerance cannot be reached at the same time in distributed system. Then we analyse different consistency models and details Cassandra cloud storage system to understand how it targets these issues. Next we talk about energy management in cloud and its importance. Finally we present some related work about consistency and power management and its limit to explain the motivation of out work.
2.1 Replication
Replication in cloud storage systems means that the same data is stored on multiple storage devices such as separate data centers located in geographically diverse sites. The goal of replication is for:
• Enhancing the performance: it can enhance the performance because user’s requests can be re-directed to other replicas within the same data center (but different racks) in order to avoid overloading one single copy of data. Therefore, the system can have achieve load balancing for all the nodes
• Enhancing availability and fault tolerance: if one node fails, the backup can take over its task so the single points of failure is avoided.
• Providing fast access: the system can choose the closest replica for responding the user’s request in order to avoid communication’s delay and make latency lower. Figure 1 shows that if the system is under heavy load and multiple replicas coexist, the load will be shared by these replicas and the performance is therefore improved. For the availability, if the node R3 fails, the load will be re-directed to R4 in the same data center. If the node R5 fails, the load will be re-directed to the remote data center. For fast access, the user 1 will be directed to the node R1 as R1 is the nearest node to user in the region.
2.2 Consistency in cloud storage system
2.2.1 CAP theorem
Since data is replicated among distributed nodes, then how to ensure the consistency among all the replicas becomes an issue. For example, if the data is updated on one node, the other replicas for this data may not be updated at the same time due to the network latency or node failure. When a read request for this data arrives on the node which is not update yet, the node can not return the most recent data and the system is inconsistent. However, the CAP theorem (Consistency Availability Partition tolerance) that was introduced by Eric.A.Brewer in July, 2000 states that [5] :
Figure 1: Data replication
For a shared data-system, you can have at most two of the following proper-ties: Consistency, Availability, Tolerance to network Partitions.
That means that only two of three properties above can be guaranteed simultaneously. Then this theorem is proven by Nancy Lynch and Seth Gilbert [16] in 2002. Now we explain the three properties as follows.
Consistency : Consistency means that all the replicas must return the same data for the same request. From the user’s point of view, the same requests generated from differ-ent users at the same time should give the same result.
Availability : Availability means that every operation must receive a response about whether it was successful or failed from the system in a certain time. For example, in a web shop service, a shopping cart application answering with a browser notifica-tion for a time out doesn’t respect availability.
Partition tolerance : Partition Tolerance means that in a distributed system which consists of a collection of communicating nodes, if the network is partitioned, which means that many messages will be lost sent from one node to another, the partitioned systems can still work correctly.
2.2.2 consistency models
With CAP theorem in some cases consistency must be given up to reach high availability and partition tolerance. However, inconsistency will cause stale read and this problem has a high cost in some applications such as bank or e-commerce applications. But in other cases such as social network applications, inconsistency has not such bad effect as the aforementioned applications. Therefore, there exits three major consistency models: strong consistency, weak consistency and eventual consistency.
Strong consistency Strong consistency means that after an update operation has been fin-ished, any process which performs a read operation should have agreed before returning
the value to the client. In a distributed storage system, it means that for a successful read or write operation, all the replicas should agree before return the value to the clients. A well-known strong consistency model is one-copy-serializability. In the traditional transactional sense, one-copy-serializability means that a concurrent execution of transaction on the repli-cated objects is equivalent to a serial execution of these transactions on a single object at a time.
Weak consistency Weak consistency doesn’t guarantee that it will always return the most updated value to the subsequent read operation and it allows to return stale read.Hereafter we discuss the state of art about weak consistency models:
Causal consistency : if a process A has updated a data item which is causally ordered before the write operation performed by process B, then the subsequent access by B will return the value that has been updated by A. For a process C which has no causal relationship with A will follow the normal weak consistency rule.
Read-your-writes consistency : If process A has updated a data item and performed a read operation after that, it must always return this updated value and never return the value that is written before the updated operation.
Session consistency : If we put the access process in the context of a session, the read-your-writes consistency will be always ensured as long as the session is open.
Monotonic read consistency : If a process A value reads the value of a data item x, any subsequent read operation on x by A will always return that same value or a more recent value.
Monotonic write consistency : If a process does a write operation on data item x, then any subsequent write operation must wait for this operation until it is completed. It means that all write operations must be serialized.
Time-line consistency : this consistency model is implemented by PNUTS [11], a hosted data service from Yahoo providing a geographically distributed database that aims at guaranteeing low latency and high availability guarantees. This consistency model means that all replicas of a given record play all updates in the same order so that all replicas move only forward in time.
Eventual consistency Since strong consistency will introduce high latency especially when data is replicated over geographically distant areas and weak consistency may return stale data, eventual consistency was proposed as an alternative to the traditional consistency models. Unlike strong consistency, eventual consistency allows the system to return some stale data at some points in time, but ensures that all data will become eventually consistent. First we look at the conditions for strong consistency :
For better understanding the replication and consistency in cloud storage system, we will introduce Cassandra in the next section to show how the replication and consistency are implemented in practice.
2.3 Cassandra storage system
Apache Cassandra [23] is a high performance, extremely scalable, fault tolerant cloud stor-age system. Cassandra combines all the benefits of Google Bigtable [8] and Amazon Dy-namo [13] to handle the types of database management to provide high available and scal-able cloud storage service. For example, Facebook uses Cassandra to scale up to host data for more millions of active users. The following will part will introduce how Cassandra par-tition and replicate data and consistency in Cassandra [25] to achieve high availability and performance.
2.3.1 Partitioning in Cassandra
Cassandra is a distributed database management system that easily and transparently par-titions data across all participated nodes in a database cluster. Each node is responsible for part of the overall database. In Cassandra, each row of data is identified by a row key. Each row key is mapped to a hashed value called a token. Partitioner can compute the token for a row key and then distribute the data across the nodes in the cluster according to the token.
Cassandra cluster can be considered as a ring which is formed by the nodes. The ring is divided into ranges and each node is responsible for one or more ranges. The node position in the ring is determined by the token value. Each node is responsible for the region of the ring between itself(inclusive) and its predecessor(exclusive). The last node is considered the predecessor of the first node hence forms a ring. To find the node where the given data live, Cassandra will compare the token value of the row key of the given data and the nodes clockwise until it finds a node whose token value is greater than that of the row key then this given data is managed by that node.
We can take an example of Cassandra storage system which is composed of four nodes as shown in Figure 2:
Figure 2: Partitioning in Cassandra
which can be represented successively by [0-25], [26-50], [51-75] and [76-100]. The four nodes have the token value successively 0, 25, 50, 75. If the token value of a row key is 20, the node 1 will take care of this data because it’s the node whose token value is greater clockwise than 20.
Before deploying a Cassandra cluster, each node must be assigned an initial token to determine the position of nodes in the ring by partitioner. There are two types of partitioner: RandomPartitioner and ByteOrderedPartitioner.
RandomPartitioner uses tokens to help assign equal portion of data to each node and evenly distribute data from all tables throughout the ring or other grouping. With this par-titioner, read and write request to the cluster are also evenly distributed and load balancing is simplified since each part of the hash range receives an equal number of row on aver-age. RandomPartitioner is the default partitioning strategy and the use of this partitioner is strongly recommended.
ByteOrderedPartitioner is for ordered partitioning.This partitioner orders rows lexically by key bytes. The key is represented by a hexadecimal number of its leading character.
2.3.2 Replication in Cassandra
Cassandra uses replication to ensure reliability and fault tolerance. Replication means that the same data can be copied on one or more nodes in a cluster. Cassandra uses replication factor to determine the number of copies of data. For example, the replication factor 1 means that there is only one copy of data on one node. The replication factor 2 means the data will be copied two times and owned by two nodes. As Cassandra is a peer-to-peer system, all the replicas are equally important and there is no master replica.
There are two replica strategies in Cassandra: SimpleStrategy and NetworkTopologyStrat-egy.
SimpleStrategy is used in single data centers cluster. It means that the first replica will be stored on the node which is determined by the partitioner. The other replicas will be managed by the next nodes clockwise in the ring without considering rack or data center location. It is a "rack-unaware" strategy. Figure 3 shows the detail of SimpleStrategy.
A, B, C, D, E, F, and G represent the nodes whose value is generated randomly within this space so that their positions in the ring can be identified according to this value. Each data item has a key which will be hashed to find its position on the ring. For assigning each data item to a node, the data item should find clockwise the first node with a position larger than the item’s by comparing with their hash value. For example, the hash value of key K is in range (A, B) and the first clockwise node is B so it is attached to node B. Since the replication factor is 3 then node B replicates the key K at nodes C and D in addition to storing it locally. Thus, node D will store the keys that are located in ranges (A, B), (B, C) and (C, D).
NetworkTopologySrategy is used for deploying Cassandra on multi data centers. It can determine how many replicas will be replicated on each data center. It is a "rack-aware" strategy. Here is the steps to place the replicas using NetworkTopologyStrategy:
Figure 3: Replication in Cassandra
• Additional replicas are placed by walking the ring clockwise until a node in a different rack is found. If no such node exists, additional replicas are placed in different nodes in the same rack.
2.3.3 Consistency in Cassandra
Cassandra provides tunable data consistency [24] and users can choose strong consistency to eventual consistency on the need. Tuning consistency can be done on a per-operation basis and both for reads and writes. Clients can specify a desired consistency level ZERO, ONE, QUORU M, ALL, or ANY with read or write operation depending on their requirements for response time versus data accuracy.
The write consistency level in Cassandra means that how many replicas the write must succeed before returning an acknowledgement to the client application. For example, a write consistency level ONE means that the write request will not return until at least one replica node where the key is stored has written the new data to its commit log and memory table. A write consistency level ALL means that a write must be written to commit log and memory table of all replica nodes in the cluster for that key. If any of the replicas is not available, the write fails.So ALL will have lowest availability. A write consistency QUORU M means that the write must be written to a quorum (replication factor/2) nodes. So QUORU M can tolerate some replicas down and it has higher availability than ALL.
The read consistency level in Cassandra means that how many replicas should respond before a result is returned to the client application. For example, a read consistency level ONE means that if at least one replica responds (normally from the closest replica) to the read requests, the result will be returned to the client. A read consistency QUORU M means that the system will return the record with the most recent data (based on the timestamps) among the response from a quorum of replica. A read consistency level ALL means that all the replicas must respond to the read requests and the system returns the most recent data if the replicas respond different versions of data .If one replica does not respond the read fails
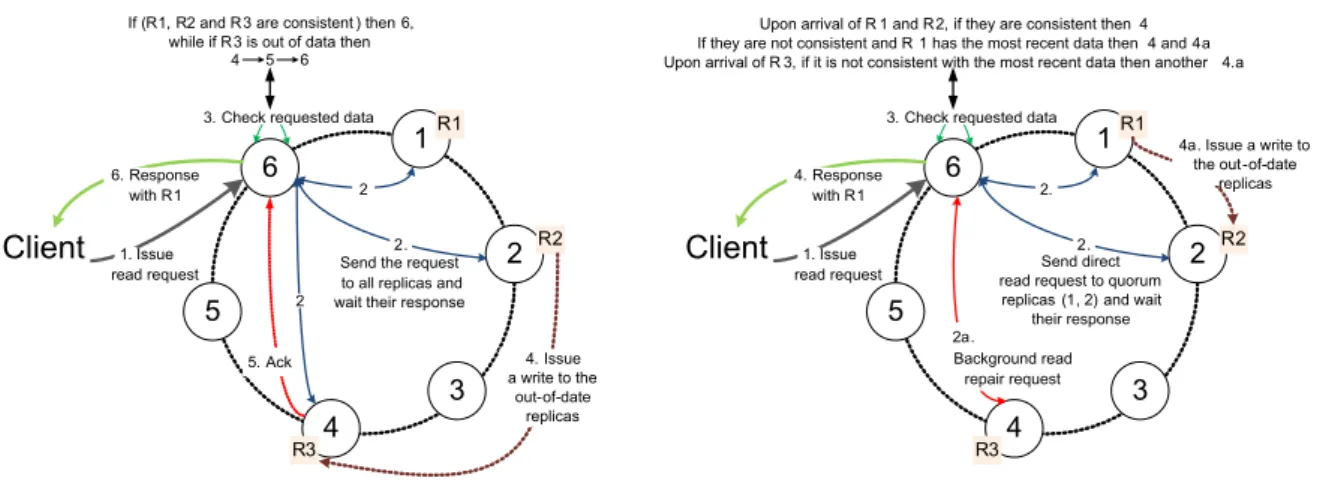
so ALL will introduce high latency for the read in Cassandra. Figure 4 explains consistency management in Cassandra:
Issue read request 6 5 4 3 2 1R1 Client R3 R2 3. Check requested data
1. Send direct 2.
read request to quorum replicas (1, 2) and wait
their response 2.
Background read repair request Upon arrival of R 1 and R 2, if they are consistent then 4 If they are not consistent and R 1 has the most recent data then 4 and 4a Upon arrival of R 3, if it is not consistent with the most recent data then another 4.a
4. Response with R1
4a. Issue a write to the out -of-date
replicas 2a. Issue read request 6 5 4 3 2 1R1 Client R3 R2 3. Check requested data
1. Send the request2. to all replicas and wait their response
2
2
If (R1, R2 and R 3 are consistent ) then 6, while if R 3 is out of data then
4 5 6 5. Ack 6. Response with R1 4. Issue a write to the out-of-date replicas
Strong Consistency in Cassandra Eventual Consistency in Cassandra
Figure 4: Consistency management in Cassandra [10]
It shows the synchronous replication vs Quorum replication in Cassandra: When a client connects to a node in Cassandra cluster and issues a read request, this node will serve as the coordinator (node 6) for this particular operation. However, the read operation consistency is set to ALL which represents consistency, the coordinator will wait for all the replicas to respond with the requested data. If they are not consistent and the stale data is detected the coordinator will not respond to the client until the inconsistent nodes have been repaired with the newest data. While if the read consistency is set to QUORU M, the coordinator will answer the read request with the most recent data (based on the timestamps) when 2 out of 3 replicas are responding. Meanwhile an asynchronous process called read-repair will repair the stale replicas at latter time.
Cassandra allows to tune the consistency of each read and write operation to achieve different tradeoffs between consistency and latency. We note the R is the number of replicas consulted during a read, and W is the number of replicas consulted during a write, Cassan-dra is fully consistent under the following condition:
R+W>N (1)
This condition means that the intersection of replicas involved in both operations con-tains at least one replica with the last update and with the read-repair mechanism that runs at background all the other replicas will be consistent. Therefore Cassandra is always con-sistent. For example, QUORU M on read and writes meets that requirement and is a com-mon starting position which provides consistency without inhibiting performance or fault-tolerance. ALL on both read and write meets also this condition but it will have high latency.
However, if low latency is required we use this condition to give up the consistency:
2.3.4 Reads and writes in Cassandra
Cassandra is a read/write anywhere architecture.This architecture allows users to connect to any node in any data center and read/write the data they need. So each node is capable of servicing any user request to read from or write to a particular key. Figure 5 show one write operation in Cassandra. Once a node receives a write requests, the write is firstly written to a commit log for durability, and then to an in-memory table called a memtable. If the write is written to the commit log and memory, this write can be considered as successfully performed. Once the memtable reaches a certain size it is periodically flushed to disk to a persistent table structure known as a SSTable.
In the background, Cassandra periodically merges SSTables together into larger SSTables using a process called compaction. During the compaction runtime, the disk usage will be temporarily double and this is an I/O and CPU intensive operation. Therefore it will in-crease power consumption for the system.
Figure 5: Write operation in Cassandra [32]
Figure 6 shows the read operation in Cassandra. Reads are much more I/O intensive than writes and it can usually cause higher latency. To improve read performance, Cassandra uses an in-memory structure called Bloom filter. Each SSTable has a Bloom filter associated with it that checks if any data for the requested row exists in the SSTable before doing any disk I/O. Then Cassandra checks the global key cache and finally it performs a single seek and a sequential read of columns in the SSTable if the columns are contiguous, and returns the result set. However, using bloom filter will incur high memory consumption. Bloom filters are probabilistic sets that enable to trade memory for accuracy. This probabilistic value is 0.01 for SizeTieredCompactionStrategy by default and 0.1 for LeveledCompactionStrategy by default).
2.4 Energy management in Cloud
The energy consumption in data centers is increasing vastly. According to the report [14] of the US Environmental Protection Agency,
the servers and data centers in USA alone consumed about 61 billion kilowatt-hours (kWh) at a cost of $ 4.5 billion, which was about 1.5 % of the total U.S. elec-tricity consumption in 2006, and this energy consumption is expected to double by 2011 if continuously powering computer servers and data centers using the same methods.
Figure 6: Read operation in Cassandra [31]
High energy consumption will cost highly for managing and maintenance for data cen-ters. Therefore, power management is of extremely high importance.
If we investigate on the power consumption at node level, the components in a node can consume power in different ways. For example, the power consumption in CPU is dif-ferent on difdif-ferent frequencies. The power consumption in hard disk depends on difdif-ferent speeds.There are many research work on power management at CPU level, Dynamic Volt-age Frequency Scaling (DVFS) is a well-known used method to provide a variable amount of power consumption by tuning the CPU frequency. It is based on the fact that dynamic power consumption of processor is strongly dependent on the core voltage V and the clock frequency.
Now we move to the power management at the data center scale. A typical factor which can affect power consumption is the number of nodes that are switched on. It means that if more nodes are switched on, more power consumption in data center will have. Therefore, much work focuses on consolidate workload on fewer nodes in order to reduce the nodes that are switched on thus save power consumption. DVFS policies can be also used in data center. By lowering CPU frequency of those nodes that are not fully used, the total power consumption can be reduced in data center.
2.5 Related work
2.5.1 Consistency management in cloud storage system
According to the CAP theorem, a real tradeoff between consistency and availability should be addressed since partition tolerance is necessary for scalable distributed systems that rely on networking. Abadi [1] rewrites CAP theorem and he described a refining model called PACELC to clarify some tradeoffs with the CAP theorem. He defined a new tradeoff between latency and consistency. For example, in Cassnadra, it it experiences partition then it gives up consistency for availability. If Cassandra runs normal, it must sacrifice consistency for obtaining lower latency.
Some studies shows that the actual provided consistency can be measured in cloud stor-age platform [21] [3] [4]. Wada et al. [21] analyse the consistency properties that commercial
storage systems provide and presents how consumer may encounter stale data under what conditions. Meanwhile, they measure the performance improvement of using weaker con-sistency constraints. Anderson et al. propose an offline concon-sistency verification algorithm and test three kind of consistency semantics on registers in the Pahoehoe key-value store. They find that the inconsistency increases if the same key is accessed concurrently.
On the other hand, another approach called adaptive consistency tuning are proposed to meet the consistency requirements of application and reduce the consistency violation or save the monetary cost cased by consistency violation in cloud storage system. Now we detail these approaches as in the next paragraphs.
Harmony Harmony is a novel approach which is proposed by Chihoub et al. [10] to achieve adequate tradeoffs between consistency and both performance and availability. Har-mony builds an automated and self-adaptive system which can tune the consistency level at run-time to reduce the probability of stale reads. The key idea behind Harmony is an intel-ligent estimation model of stale reads, allowing to elastically scale up or down the number of replicas involved in read operations to maintain a low tolerable fraction of stale reads. Harmony estimates the stale read rate by means of probabilistic computations according to the network latency and access pattern. Unlike other existing work, Harmony uses the stale read rate of the application to precisely define the consistency requirement
The idea is that if the consistency requirement is greater than the current estimated stale read rate, the system choose the eventual consistency because the current stale rate is tolera-ble. If not, that means the current stale rate is not tolerable and the system must recompute the number of replicas necessary to let the consistency requirement be greater than the cur-rent stale rate and then choose the new consistency level.
Harmony is built on Cassandra and is deployed on both Grid’5000 and Amazon EC2 [27]. The experiment results show that Harmony provides provide almost the same latency as the eventual consistency but less stale reads than the eventual consistency approach. There-fore Harmony can provide better performance than traditional approaches that are based on strong consistency. Moreover, it provides more adequate consistency than eventual consis-tency approaches.
Consistency Rationing This approach [18] builds a trade-off between cost, consistency and availability. The idea is based on the fact that not all data have the same consistency re-quirement. It describes the effect of consistency by cost. For example, strong consistency will introduce high cost per transaction and reduce the availability but the penalty costs can be avoided whereas low consistency will make the operation cost lower but results in a higher penalty cost. Therefore, the idea is to build a dynamic consistency strategy to meet to the consistency requirement. If the penalty cost is low then it decreases the consistency level and if the penalty cost is high then it increases the consistency level. To build the cost model, this approach proposes a Consistency Rationing which is inspired by the Inventory Rationing.The data is divided into three categories (A, B, and C) in which A category re-quires strong consistency and C category rere-quires weak consistency, and B category rere-quires the varying consistency which implies that the penalty cost is varying. This means that we can make an ideal trade-off between the cost per operation and the consistency level for the B category data by defining different policies to switch the consistency at runtime thus we
can get the cost benefits.
Bismar In cloud computing, the economic cost of using rented resources is very important and should be considered when choosing the consistency policy. Chihoub et al. [9] analyse the monetary cost in cloud storage system in their paper. Stronger consistency may intro-duce high latency and increase the monetary cost because the time for leasing cloud service is longer due to the high latency in cloud. Weaker consistency can reduce the service time thus save monetary cost but it increases the rate of stale data which will impact the finan-cial profit of the cloud service providers. This paper addresses this problem and make an in-depth study of the monetary cost of different consistency levels in order to optimize cost efficiency.
This paper is the first to provide a thorough analysis of the consistency cost in cloud storage systems. In this paper, the total cost of cloud services can be decomposed into three parts: Instances cost, Storage cost and Network cost. It gives the formulae to calculate the three kinds of cost based on different consistency levels. Then this paper defined a novel metric: consistency-cost efficiency. This metric reveals the relation between consistency and monetary cost and it can be used to optimize the consistency cost in cloud storage systems. With the help of this metric, this paper introduces a new approach called Bismar which can reduce the monetary cost while keeping the stale reads tolerable at the same time by means of adaptively tuning the consistency level at run-time.
This is an efficient-aware algorithm that takes into account the read/write rates and the network latency. Bismar makes a probabilistic estimation of the stale reads and the rela-tive costs of the replication based on the current read/write rates and network latency col-lected at run-time. Then the algorithm selects the right consistency level for making the consistency-cost efficiency maximum.
2.5.2 Energy management in cloud storage system
Many studies were dedicated to improving the Map/Reduce energy consumption efficiency in data centers and cloud . Much of them focus on power-aware data-layout policies which allow servers to be turned off without affecting data availability. Some work use Convering Set (CS) that keeps only a small fraction of the nodes powered up during periods of low utilization. Another technique is called ALL-In Strategy that uses all the nodes in the cluster to run a workload and then powers down the entire cluster. We present three related work for these two strategies.
GreenHDFS GreenHDFS [17] is an energy-conserving, hybrid, logical multi-zoned variant of HDFS for managing data-processing intensive; commodity Hadoop cluster. GreenHDFS trades performance and power by logically separating the Hadoop cluster into Hot and Cold zones. Zone’s temperature is defined by its power consumption and the performance re-quirements.
GrennHDFS relies on data classification driven data placement to realize guaranteed, substantially long periods of idleness in a subset of servers designated as the Cold zone in the Hadoop cluster. Meanwhile, zoning in Green HDFS will not affect the Hot zone’s
per-formance adversely and the computational workload can be consolidated on the servers in the Hot zone. Simulation results show that GreenHDFS is capable of achieving 26% savings in the energy costs of a Hadoop cluster in a three-month simulation run.
Rabbit Rabbit [2] is a distributed file system that arranges its data-layout to provide ideal power-proportionality down to very low minimum number of powered-up nodes. Rabbit addresses the node failure rates of large-scale clusters with data layouts that minimize the number of nodes that must be powered-up if a primary fails. It maintains a primary replica of data on a small covering set of always-on nodes. Remaining replicas are stored in larger set of secondary nodes which are activated to scale up the performance or to tolerate primary failures.
All-in-Strategy These approaches which are presented above used technique called Cover-ing Set (CS) that keeps only a small fraction of the nodes powered up durCover-ing periods of low utilization. Lang and Patel [20] propose an extreme opposite approach called the ALL-In strategy (AIS) which aims to improve the energy efficiency of the popular MapReduce (MR) clusters to exploit low utilization periods.
The idea is simply to run the MapReduce job on all the nodes in the system and power down the entire system when there is no work. AIS will firstly batch the MapReduce jobs in a queue. After deciding the duration to batch the jobs according to prediction models, AIS powers up the entire system and run the entire batch of job with full cluster utilization.
According to the aforementioned related work, there are much work which aim at study-ing the impact of consistency strategies and address tradeoff with consistency but little work explores the tradeoff between consistency and power efficiency. Moreover, there are also much work which focus on providing energy-efficient management in cluster. However, to our knowledge there is no work which take consistency into consideration when improving energy consumption. In contrast to these work, we address the consistency and power ef-ficiency tradeoff in Cassandra cluster and evaluate the energy consumption with different consistency. To achieve our goal, we conduct a series of experiments with different consis-tency, access pattern and loads configurations to reveal how they can affect power efficiency in Cassandra cloud storage system.
3
Energy Measurements for Cassandra Cloud storage system
From the previous study, consistency management is a critical issue for modern storage sys-tems as it has a direct impact on performance and availability. At the scale of cloud comput-ing, the impact is even larger. Prior to this work, the investigation of consistency tradeoffs in favour of performance and availability was widely studied. However, the impact of consis-tency on the energy consumption of the storage cluster remain unexplored. Therefore, our target is to explore this issue and show how consistency affects energy consumption. We do a complete profiling of resources usage with different consistency level and we study the consumption patterns of different consistency levels with different read/write ratio accesses and increasing number of clients.
This section presents firstly the our experiment methodology and the necessary tools for conducting the experiment. Then we describe how to setup the experiment environment with YCSB benchmark. According to the obtained results, we make a macroscopic and a microscopic analysis to understand the energy consumption in different consistency levels, access patters and loads in order to propose new policies to improve power efficiency in Cassandra.
3.1 Methodology
3.1.1 Grid’5000 testbed
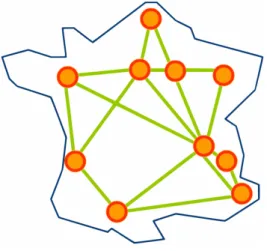
Grid’5000 [7] a scientific instrument designed to support experiment-driven research in all areas of computer science related to parallel, large-scale or distributed computing and net-working. It aims at providing an experimentation testbed to study large scale parallel or distributed systems. It is also a highly reconfigurable, controllable and monitorable experi-mental platform to make the simulation realistic and obtain reproducible results. Grid’5000 platform is distributed across 9 sites in France and One in Luxembourg at it contains more than 20 clusters with almost 8000 cores located on the different sites. The network connec-tion between these sites is provided by RENATER (The French naconnec-tional telecommunicaconnec-tion network for technology, education, and research) through 10Gb/s fibre links. Figure 7 below shows the whole Grid’5000 infrastructure located in France.
Grid’5000 allows users to reserve the nodes via OAR advance reservation system [6]. OAR provides a practical interface in which users can specify the total reservation time of resources and when the reservation will start and when it will finish. Once the reservation is successfully submitted, the reserved nodes are entirely dedicated to users and they can de-ploy customized environment and any desired application on these nodes. Moreover, with the help of OAR, users can specify also the number of nodes and which cluster they want to reserve by adding complementary properties in OAR. Once users reserve the nodes suc-cessfully, they can deploy their configured environment on these nodes using the Kadeploy tool [15].
The experiment is based on the hypothesis that the network latency is not changed and the network latency between any two nodes among 39 nodes are the same because all the 39 nodes are located in the same rack of the same data center. Before our experiment we mea-sure the network latency using ping tool and the average network latency is 0.1 ms between
Figure 7: grid5000 two nodes.
In our experiment, we write to collect the CPU,memory and power usage with a reso-lution of 1 second between measurements. Then we write a script in Python to parse the result to get the statistics about the total energy consumption in the whole Cassandra cluster during a run and the average CPU, memory and power usage per node, the throughput and stale reads rate in order to make a macroscopic analysis. We can also get the maximum and minimum usage among the nodes during a run to facilitate our microscopic analysis. Next we introduce the tools needed for conducting our experiments.
3.1.2 Experiment tools
YCSB benchmark For our experiment, we need a benchmark tool which can run work-loads on cloud storage system to evaluate the performance of system. After studying work in [12] [33], we decide to choose Yahoo! Cloud Serving Benchmark (YCSB) framework . YCSB is a standard benchmark and benchmarking framework evaluate the performance of different key-value and cloud serving storage system such as MongoDB [30], Hadoop HBase [28] and Cassandra. YCSB can provide the feature of a real cloud serving environ-ment such as scale-out, elasticity and high availability. YCSB can provide different online read/write access patterns called workload to data such as heavy read load, heavy update load and other loads. Request distribution or record and operation size can be specified when running the benchmark.
We will use Dstat and the PDU to retrieve the CPU, memory usage and energy consump-tion from the cluster:
Dstat As read and write operation will occupy CPU and memory thus have power con-sumption in the cluster, in our experiment, we manage to monitor the CPU usage, memory usage and power consumption for each node every second. We use a versatile resource statistics tool called Dstat for monitoring CPU and memory usage. Dstat is capable to view all of the system resources instantly and gives the most detailed information in columns. Moreover, Dstat can write the monitoring data into a CSV file which can be parsed easily.
Figure˜reffig:dstat shows an example of Dstat utilization:
Figure 8: A Dstat example usage
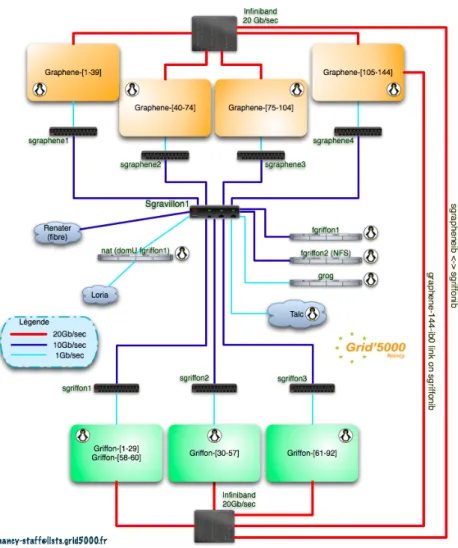
PDU (Power distribution unit) On the Nancy site two kinds of PDU (Power Distribution Units) are installed: EATON PDU and APC PDU. EATON PDU is provided by EATON company [26] and it provides reliable data center power distribution and it supervises 40 graphene nodes (graphene-[105-144]) of graphene cluster. These 40 nodes are equipped with power monitoring hardware consisting of 2 PDUs and each hosts 20 outlets. These ePDUs can provide a measurement of power consumption nodes by nodes. Each node is mapped to a a specific outlet so that with the help of the Simple Network Management Protocol (SNMP) we can use snmpget command to retrieve information from a PDU to get the power consumption. Our experiment is based on the PDUs of graphene cluster to monitor the power consumption on these 40 nodes on graphene cluster.
3.2 Experiment setup
We run our experiments on Grid’5000 and deploy the environment on the Nancy sites. Nancy site comprises 2 clusters: Graphene and Griffon. We use Graphene cluster as the experiment testbed. Graphene cluster is equipped with 144 nodes and each node has a disk of 320 GB space, 16GB of memory and 4-cores of CPU Intel Xeon. The nodes in Graphene cluster have one 20GB infiniband and they are interconnected via Gigabyte Ethernet. The network architecture of Nancy site is depicted in this Figure˜reffig:nancy:
3.3 benchmarks
In our experiment we deployed Cassandra with 39 nodes on Nancy site. We used Cassandra-1.1.4 with a replication factor of 5. Since we only use the nodes from one cluster, we choose SimpleStrategy for simple single data center clusters. We use YCSB with different workloads that have different read/update ratio. For our experiment on Grid’5000, we initially insert 2 millions 1 KB records which represent totally 2 GB of data into Cassandra. Each node will
Figure 9: Network architecture on Nancy site
have 250 MB of inserted data after replication. Each workload that was run will do 20 million operations on these nodes. We vary the number of threads starting from 100 threads, then 70 threads, 20 threads and finally, 5 threads which can access data from Cassandra concurrently. We use YCSB-0.1.4 and we vary the read-update ratio for workload from heavy update (read/update ratio : 20/80), moderate read and update (read/update ratio : 60/40) and then heavy read (read/update ratio : 80/20) using the YCSB interface and we run each benchmark under three consistency levels: ONE, QUORU M and ALL. In each run we monitor the CPU and memory usage for each node per and we measure the power usage with a resolution of 1 second. Finally we parse the result to compute the total energy consumption for each run.
3.4 Macroscopic analysis
3.4.1 Energy consumption in different consistency levels
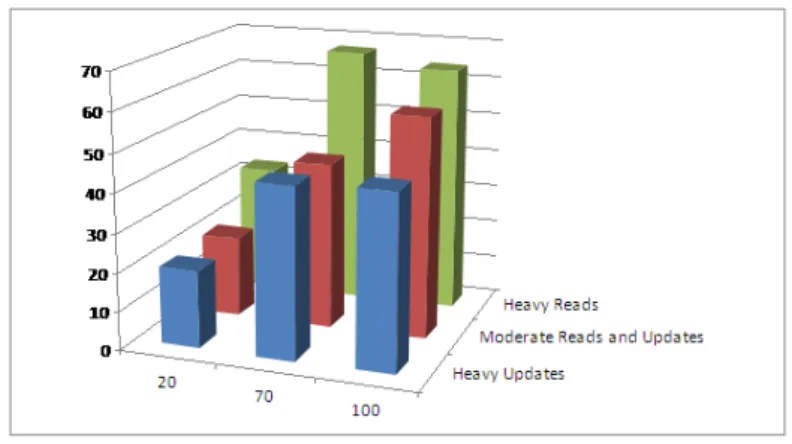
As shown in Figure 10, the total energy consumption varies when different consistency levels are used. We observe that the energy consumption decreases when the consistency level varies from ALL, QUORU M to ONE. For example, in Figure 10(a), with 20 threads under heavy updates(read/update ratio : 20/ 80), the energy consumption is increased by 29% from consistency ONE to QUORU M and 74% from ONE to ALL. This can be explained by the throughput increase. As lower consistency levels involve fewer replicas in read/update operations and then the latency is lower. Therefore, the system can finish more operations per unit time and the throughput is increased. Throughput increases will have less execution time which leads to less energy consumption because the total number of operation is fixed. We notice that the throughput is decreased by 21% from ONE to QUORU M and the time is increased by 27%. From this result we can say that he consistency level which is set to ONE is the most energy saving but it is at the cost of stale data read. From the previous section, we can infer that QUORU M and ALL for read and write will not have the stale data read because they satisfy the R+W > N condition and the read can always get the most recent data. However the consistency level of ONE for both read and write can not guarantee that the read can always get the updated data. Figure 11 shows the stale read rate at consistency level ONE. We observe that the stale read rate can reach more than 60% in some cases which is means that almost two of three reads are useless.
3.4.2 Energy consumption in different access pattern
Figure 12 shows energy consumption with different access patterns. We have three kinds of access pattern: heavy updates (read/update ratio : 80/20), moderate read and update (read/update ratio : 60/40), heavy reads (read/update ratio : 20/80). We take 70 threads in consistency ONE for analysing. We find that there are significant variation in energy consumption with different access pattern. For example, the energy consumption increases by 50% from heavy updates to moderate reads and updates and it increases by 46%. This is also due to the throughput variation. This can be explained by the fact the throughput de-pends on the operation latency. As the read latency are different and different read/update ratio will lead to different operation latency.
3.4.3 Energy consumption in different loads
As shown in Figure 10, different loads have also different energy consumption. In our exper-iment, we define three loads which are presented by the number of threads: 20 threads, 70 threads and 100 threads. 100 threads means the highest loads whereas 20 has the lowest loads. We observe that the energy consumption is reduced by 51% from 20 threads to 70 threads and 49% from 20 threads to 100 threads. This is also due to the throughput varia-tion. The system can finish more operation per unit time at higher loads and the throughput is increased. However, the energy consumption at 70 threads is not always higher than that 100 threads (from 946331 Joules to 990028 Joules). This can be explained by the processing capacity the system can support. As the number of threads is higher than the number of
Figure 10: Energy consumption in different consistency, access pattern and loads
Figure 11: Stale reads rate
storage hosts, the threads are served concurrently and the throughput will not be increased from 70 threads to 100 threads. Thus, the energy consumption at 70 threads is not necessarily higher than that at 100 threads.
Figure 13 shows clearly the impact on the throughput with different consistency levels, access patterns and number of threads. For example, in Figure 13(b) with 100 threads, un-der moun-derate reads and updates (read/update ratio : 60/40), the throughput is decreased
Figure 12: Energy consumption in different access pattern ( 70 Threads, consistency ONE by 41% and 50% when passing from ONE to QUORU M, and from ONE to ALL respec-tively form which we conclude there is a remarkable impact on throughput with different consistency levels.
Figure 13: Throughput with different access patterns and different threads
• The energy consumption varies due the different consistency levels, access patterns and loads.
• The lower consistency results in lower energy consumption.
• The energy consumption is mainly depending on the throughput, but there exists some exceptional cases.
Next we will make a microscopic analysis to understand the other factors which can have impacts on energy consumption.
3.5 Microscopic analysis
To illustrate different factors which affects the power efficiency in Cassandra, we presents the details about the consistency QUORU M for the microscopic analysis. Figure 14 shows energy consumption, throughput and power usage with different access patterns and differ-ent loads at consistency QUORU M.
Figure 14: Energy consumption, throughput and power usage with consistency QUORUM Figure 14 shows the energy consumption, throughput, and average power usage with three access patterns and three loads and Figure 15 show their incontrastwithbase
Now we zooms on moderate reads and updates (read/update ratio : 60/40) and combine Figure 15(a), Figure 15(b) Figure 15(c) in Table 1 From this table we find that the in contrast
Figure 15: The percentile of Energy consumption, throughput and power usage in contrast to the baseline (the baseline is defined as the average of all scenarios
Table 1: Zoom on Moderate read and write in contrast of base
20 Threads 70 Threads 100 Threads Energy consumption in contrast with base 1.04 0.01 -0.35
Throughput in contrast with base -0.6 -0.13 0.33
Power usage in contrast with base -0.03 0.03 0.001
with base for energy consumption is 1.04 whereas this metric is -0.6 and -0.03 in through-put and power usage respectively. Therefore, energy consumption does not depends on throughput proportionally.
We can conclude that throughput is not the only factor which affect energy consumption. There must exist other bias which contributes the energy consumption. In order to find this bias, we introduce two metrics, coefficient of variation and max-min different for power and CPU usage.
In our experiment, for every run we calculate the average of power usage of nodes and we note it mean. Meanwhile, we calculate also the average of power usage for every node and we note it avri, 1≤i≥39. Therefore we can get the maximum and minimum power usage
among 39 nodes and we note them respectively max and min. Finally, we compute the standard deviation of power usage for these 39 nodes and we note it std. Thus the coefficient
of variation is defined as follows:
coe f f icient o f variation=std/mean (3)
where mean= ∑Ni=1avri
N and std=
q
∑N
i=1(avri−mean)2
N the second metric is defined as follows:
Max−Min di f f erence= (max−min)/100 (4) where max = max(avri, 1≤i≥N) and min = min(avri, 1≤i≥N) where N is the number data
nodes
Table 2 shows the coefficient of variation of power usage with different access patterns and loads. For example, the coefficient of variation is from 3.6% to 9.5% when the loads are increased at heavy reads and this bias is not negligible it shows clearly that different nodes have very different power usage in all the configurations. Table 3 proves our observation as we note that the difference between maximum and minimum power usage among the 39 nodes is from 10.4% to 30%. We can conclude that there is a bias in the power between different node and they have different power usage in a run.
Table 2: coefficient of variation for power usage (%)
20 Threads 70 Threads 100 Threads
Heavy update 6.4 8.9 8.4
Moderate read and write 6.2 8.8 7.0
Heavy read 3.6 8.0 9.5
Table 3: Max-min difference for power usage (%)
20 Threads 70 Threads 100 Threads
Heavy update 16.6 24.4 25.2
Moderate read and write 16.5 31.4 23.1
Heavy read 10.4 23.4 30.0
Now we move to the two metrics for CPU usage to see the difference between nodes. Table 4 shows the coefficient of variation and it is much higher than that for power usage. For example, the coefficient of variation of power usage under heavy read with 20 threads is 3.6% whereas it is 34.4% for CPU usage. Table 5 shows the Max-Min difference of CPU usage and we have the same observation as the previous one.
Table 4: coefficient of variation for CPU usage(%)
20 Threads 70 Threads 100 Threads
Heavy update 35.6 31.6 24.0
Moderate read and write 41.1 28.9 20.1
Heavy read 34.4 26.7 25.7
In conclusion, the bias exists both in the power and CPU usage when the benchmark runs on Cassandra and this bias can affect energy consumption and power efficiency. There-fore, we can define data-layout optimization to leverage this bias and improve the power efficiency.
Table 5: Max-min difference for CPU usage(%)
20 Threads 70 Threads 100 Threads
Heavy update 32.5 47.5 50.0
Moderate read and write 43.2 52.2 52.4
Heavy read 28.0 44.8 45.7
4
Data-layout policies
4.1 Overview
As discussed in the previous section, different nodes have different power and CPU usage and there must be a bias. That means in a run some nodes are more active (more power and CPU usage) than others and these active nodes process more requests. Our solution is to make a full usage these active node to optimize the power and CPU usage from the observed bias. In order to do that we want the data can be more distributed on these active nodes thus they can process more data. As shown in the state of the art, data is distributed on a ring in Cassandra cluster and each node is responsible for some ranges of the ring to store the data. Each node is assigned a token that determine which data it can store. By designing different token assignment we can have different data-layout in Cassandra cluster to clarify which data-layout can improve the power efficiency. For our experiment, we defined four kinds of data distribution: Even data distribution (load balancing), 1/2 warm pool and 1/2 cool pool, 1/3 warm pool and 2/3 cool pool and finally 2/3 warm pool and 1/3 cool pool.
4.2 Implementation
4.2.1 Even data distribution
In this configuration, we generate 39 tokens and assign them to 39 nodes we reserve for that every node has the equal portion of data of the ring. Therefore, each node is responsible for roughly an equal amount of data called load balancing. M is number of generated token and N is the number of node. Algorithm 1 shows how to make the even data distribution among 39 nodes.
Algorithm 1Even data distribution algorithm
set M : isthenumbero f tokens, N : isthenumbero f nodes for ifrom 0 to M−1 do
token i = 2127/M∗i
end for
for jfrom 0 to N do
assign node j with the token(j−1)
end for
Figure 16: Even data distribution 4.2.2 Uneven data distribution
We have three configurations where the data is not evenly distributed among the nodes. The idea is to let the nodes in the warm pool be responsible for two ranges of data and let the nodes in the cool pool be responsible for only one range of data. Therefore, the read and write requests to the nodes from warm pool are two times as much as the ones to the nodes from cool pool.
1/2 warm pool and 1/2 cold pool : In this configuration, we divide the cluster into two parts, 20 of 39 nodes are in the warm pool and 19 of 39 nodes in the cold pool. We generate 59 tokens and assign 39 of them to 39 nodes. The token assignment is depicted in Algorithm 2: Algorithm 21/2 warm pool and 1/2 cold pool algorithm
set M=59, N =39 for ifrom 0 to M−1 do
token i = 2127/M∗i end for
for jfrom 1 to N2 do
assign node j with the token 2∗ (j−1)
end for
for jfrom N2 +1 to N do
assign node j with the token(k+M−N−1)
end for
Figure 17: Uneven data distribution
1/3 warm pool and 2/3 cold pool In this configuration, we divide the cluster into two parts, 13 of 39 nodes are in the warm pool and 26 of 39 nodes in the cold pool. We generate 52 tokens and assign 39 of them to 39 nodes. The token assignment is depicted in Algorithm 3: Algorithm 31/3 warm pool and 2/3 cold pool algorithm
set M=52, N =39 for ifrom 0 to M−1 do
token i = 2127/M∗i end for
for jfrom 1 to N3 do
assign node j with the token 2∗ (j−1)
end for
for jfrom N3 +1 to N do
assign node j with the token(k+M−N−1)
end for
2/3 warm pool and 1/3 cold pool In this configuration, we divide the cluster into two parts, 26 of 39 nodes are in the warm pool and 13 of 39 nodes in the cold pool. We generate 65 tokens and assign 39 of them to 39 nodes. The token assignment is depicted in Algorithm 4:
Algorithm 42/3 warm pool and 1/3 cold pool algorithm set M=65, N =39 for ifrom 0 to M−1 do token i = 2127/M∗i end for for jfrom 1 to N3 ∗2 do
assign node j with the token 2∗ (j−1)
end for
for jfrom N3 ∗2+1 to N do
assign node j with the token(k+M−N−1)
end for
5
Evaluation
We use YCSB-0.1.4 and we vary the access pattern from heavy update, moderate reads and updates to heavy reads. The workloads consists of 20 million operations and 2 millon rows which represents 10 GB of data with replication f actor 5. We vary also the number of threads from 20 threads, then 50 and finally 70 threads to run the workload. We evaluate the sys-tem with different data-layout for every scenario defined above and present our detailed observation with moderate reads and updates (read/update ratio : 60/40) with 70 threads.
Figure 18 shows respectively energy consumption, average power usage of nodes, execu-tion time and stale reads at consistency ONE and we observe that different data-layout have different impacts on them. We notice that that 1/2 warm data-layout (20 nodes in warm pool and 19 nodes in cold pool) can economize 18% of energy consumption compared to the even data distribution. This can be explained by reduction of the average power usage and execution time because the average power usage is reduced by 2% and the execution time is reduced by 16.5%. But the 1/2 warm data-layout has still a high cost of stale reads rate to pay because it reduces only 4.6% stale reads rate.
The 1/3 warm data-layout (13 nodes in warm pool and 26 nodes in cold pool) and 2/3 warm data-layout (26 nodes in warm pool and 13 nodes in cold pool) do not have such significant reduction on energy consumption as the 1/2 warm. We observe that the reduction is respectively 8% and 10%. However, these two data-layout do not improve stale reads rate and they even increase them 7% and 9% respectively.
From these observations we can conclude that the data-layout 1/2 warm is the most optimized solution for saving energy consumption and reducing the stale reads rate. The data-layout 1/3 warm and 2/3 warm can save the energy consumption but they increase the stale reads rate.
Figure 19 presents the energy consumption, average power usage and execution time at consistency QUORU M. As the read and write consistency are both QUORU M, the stale reads rate is 0. Therefore, We focus on the reduction of energy consumption with different data-layout. We observe that for the 1/2 warm, 1/3 warm and 2/3 warm data-layout, the energy consumption can be reduced by 24%, 3.5% and 9.6% respectively so we can conclude that 1/2 warm data-layout is still the most optimized data-layout technique of consistency QUORU M.
Figure 18: Energy Consumption, Average Power usage Execution time with consistency ONE
Figure 19: Energy Consumption, Average Power usage Execution time with consistency QUORU M
Finally, Figure 20(a) shows the also that 1/2 warm data-layout save the energy consump-tion by 21% and the 1/3 warm data-layout does not reduce energy consumpconsump-tion it even
in-creases by 14.3%. The reason is although 1/3% warm reduces average power by 2%, the execution time is increased by 16% which contributes more energy consumption. 2/3 warm saves energy also by 11% but it has higher average power usage and lower execution time. Therefore, 1/2 warm is the best data-layout policy which reduces energy consumption, av-erage power usage and execution time at the same time.
6
Conclusion
Cloud computing has recently emerged as a key technology to provide individuals and com-panies with access to remote computing and storage infrastructures on a pay-per-use basis. In order to achieve highly-available yet high-performance services, these storage systems rely on replication. However, with the use of replication comes the issue of consistency. Given that cloud applications are significantly varying in their consistency requirements (e.g., an e-shop require strong consistency while social applications tolerate retrieving not up to date data), strong consistency may limit the performance of some cloud applications. New consistency models therefore have been introduced to improve the performance while guaranteing the consistency requirement of the specific application. Many cloud storage systems have therefore adopted flexible (e.g., configurable) consistency model: giving the users the freedom to select the consistency level according to their application requirement.
Cassandra is an open-source cloud storage system that offers three types of consistency per-operation including weak, eventual and strong consistency and it is being used by many data center applications. However, the energy consumption in data center is increasing vastly with large scale data and power bills have become a substantial part of the monetary cost for operating a data center. As little work is focusing on energy-consistency tradeoff, this report aims at providing more clear understanding of the interplay between consistency and energy consumption and offers useful insight into designing energy-efficient techniques for Cassandra cloud storage system.
Firstly, we conducted a series of experiments on Cassandra to measure energy consump-tion with different factors including the selected consistency level and the access pattern and the number of clients of the running applications with even data distribution. The ex-periment results revealed that the energy consumption is increased by 74% when tuning consistency from ONE to ALL with 20 threads under moderate reads and updates. More-over, there is a significant variation of energy consumption when the number of threads increases while maintaining the consistency and access pattern. We conclude that the power consumption varies not only according to the selected consistency model but also according to the access patten and load exhibits by the application. Our experiment revealed also there is a bias on power usage between different nodes because the difference between maximum power usage and minimum usage can reach 30% and 50% for CPU usage, respectively. We conclude that the energy consumption variation is affected by throughput but also by the bias on power usage between different nodes. To leverage the bias, we propose three data-layout techniques to divide the cluster into warm and cold pools by controlling the number of nodes participating the operation and we introduce uneven data distribution amongst the Cassandra nodes. Our experiment shows that different data layout contribute to different energy consumption. Moreover, with 1/2 warm pool data-layout policy (i.e., 20 nodes in the warm pool and 19 nodes in the cold pool), we have achieved 24% energy saving with moderate ratios of reads and updates under eventual consistency (QUORUM).
In considering the future work, we want to extend our empirical evaluation to explore the power-consumption when applying adaptive consistency approaches including Bismar and harmony. In addition, we intend to introduce a model to measure the energy consumption of cloud storage system, given the applications and the system characteristics. This in turn will help us in designing energy-efficient techniques for cloud storage systems.


![Figure 5: Write operation in Cassandra [32]](https://thumb-eu.123doks.com/thumbv2/123doknet/5560547.133208/14.892.250.654.470.633/figure-write-operation-in-cassandra.webp)
![Figure 6: Read operation in Cassandra [31]](https://thumb-eu.123doks.com/thumbv2/123doknet/5560547.133208/15.892.184.721.159.382/figure-read-operation-in-cassandra.webp)