Barley and Pathogenic Fungi in the Soil
Marie Fiers1, Georges Lognay2, Marie-Laure Fauconnier3*, M. Haı¨ssam Jijakli1
1 Phytopathology Unit, Gembloux Agro-Bio Tech (GxABT), University of Lie`ge, Gembloux, Belgium, 2 Analytical Chemistry Laboratory, Gembloux Agro-Bio Tech (GxABT), University of Lie`ge, Gembloux, Belgium,3 General and Organic Chemistry Unit, Gembloux Agro-Bio Tech (GxABT), University of Lie`ge, Gembloux, Belgium
Abstract
Plants are able to interact with their environment by emitting volatile organic compounds. We investigated the volatile interactions that take place below ground between barley roots and two pathogenic fungi, Cochliobolus sativus and Fusarium culmorum. The volatile molecules emitted by each fungus, by non-infected barley roots and by barley roots infected with one of the fungi or the two of them were extracted by head-space solid phase micro extraction and analyzed by gas chromatography mass spectrometry. The effect of fungal volatiles on barley growth and the effect of barley root volatiles on fungal growth were assessed by cultivating both organisms in a shared atmosphere without any physical contact. The results show that volatile organic compounds, especially terpenes, are newly emitted during the interaction between fungi and barley roots. The volatile molecules released by non-infected barley roots did not significantly affect fungal growth, whereas the volatile molecules released by pathogenic fungi decreased the length of barley roots by 19 to 21.5% and the surface of aerial parts by 15%. The spectrum of the volatiles released by infected barley roots had no significant effect on F. culmorum growth, but decreased C. sativus growth by 13 to 17%. This paper identifies the volatile organic compounds emitted by two pathogenic fungi and shows that pathogenic fungi can modify volatile emission by infected plants. Our results open promising perspectives concerning the biological control of edaphic diseases.
Citation: Fiers M, Lognay G, Fauconnier M-L, Jijakli MH (2013) Volatile Compound-Mediated Interactions between Barley and Pathogenic Fungi in the Soil. PLoS ONE 8(6): e66805. doi:10.1371/journal.pone.0066805
Editor: Boris Alexander Vinatzer, Virginia Tech, United States of America Received November 26, 2012; Accepted May 15, 2013; Published June 20, 2013
Copyright: ß 2013 Fiers et al. This is an open-access article distributed under the terms of the Creative Commons Attribution License, which permits unrestricted use, distribution, and reproduction in any medium, provided the original author and source are credited.
Funding: This study was financially supported by the University of Lie`ge - Gembloux Agro-Bio Tech. The funders had no role in study design, data collection and analysis, decision to publish, or preparation of the manuscript.
Competing Interests: The authors have declared that no competing interests exist. * E-mail: [email protected]
Introduction
Smell emission and detection, though relatively unknown, is a major means for plants to interact with other organisms within their environment. Since the 1980’s, the scientific community has been interested in volatile organic compounds (VOCs), which are secondary metabolites produced by plants, and in their effects on their biological environment [1]. Thanks to their low molecular weight, their lipophilic nature and their high vapour pressure, some VOCs can freely cross membranes and be released into the atmosphere. In a way, they act as a kind of language for plants. Plants are known to emit airborne VOCs to attract pollinators and seed dispersers and to prevent herbivores’ and pathogens’ attacks [2,3]. Some VOCs induce direct or indirect defences through tritrophic plant-herbivore-carnivore interactions. Plants under herbivore attack emit VOCs that attract specific enemies of the same herbivores. For example, corn seedlings attacked by caterpillars release large amounts of terpenoid volatiles that repel herbivores and allow parasitic wasps to locate potential hosts [4,5]. Unaffected plants in the vicinity are also able to recognize volatiles emitted by infected or attacked plants and react by emitting defence volatiles [6]. Very precise signals can be emitted by plants according to the kind of noxious organism they meet. But the particular response also depends on the ability of the organisms to discriminate between different odour profiles [7]. The study of below-ground emissions of VOCs started only recently.
However, volatiles emitted from roots are already known to contribute to the defence system by acting as antimicrobial and anti-herbivore substances, or by attracting enemies of root-feeding herbivores [8]. However scientific literature is rather poor concerning fungal infections. In this paper, the below-ground volatile interactions between plant roots and pathogenic fungi are investigated. The chosen models are barley and two pathogenic fungi, Cochliobolus sativus and Fusarium culmorum.
Barley has high agronomical significance (123 million tons produced in the world in 2010) and is sensitive to many diseases (40 pathogens inducing an average loss of$252 million per year, i.e. 19.6% of the average annual value of barley crop) [9,10]. Cochliobolus sativus (Ito and Kuribayashi) Drechsler ex. Dastur, 1942 [anamorph Bipolaris sorokiniana (Sacc.), Shoemaker] [11] and different Fusarium species, especially F. culmorum (W.G. Smith, 1892, Sacc.) are the major seed-borne and soil-borne pathogenic causal agents of common root rot of barley. This major edaphic disease of cereals causes between 9 and 23% yield losses, depending on growth area and cultivars [12–14]. Primary symptoms are seedling blight sometimes leading to sprout death. The advanced stages of the diseases show dark-brown lesions on the outer coleoptile tissue and/or on the leaves and head blight, i.e. premature head death or blighting spikelets [15,16]. The VOCs emitted by fungi can contribute to the success of an infection since they are lethal for some other fungi and act as pathogenic factors by inhibiting plant growth or being toxic for plants [17,18].
The objective of this paper is to show what kind of volatile interactions can take place between barley and the pathogenic fungi C. sativus and F. culmorum. Firstly, the VOCs produced by each organism and during the interaction between the two organisms were identified. Secondly, the effects of the total VOC emission from barley root on fungi, and vice versa were assessed. Materials and Methods
1. Fungal Strains
F. culmorum (MUCL 28166) and C. sativus (MUCL 46854) strains were provided by the Belgian Co-ordinated Collection of Microorganisms (BCCM – MUCL) (Louvain-la-Neuve, Belgium). They were stored on PDA medium (Merck KGaA, Darmstadt, Germany) at 23uC and by cryopreservation at 280uC.
2. Plant Material
Barley plants (Hordeum vulgare L. cv. ‘Quench’) were grown in vitro from seeds (Jorion, Belgium). Before use, they were surface-sterilized according to a protocol adapted from Lanoue et al. [19] with incubation in H2SO4 (10% v/v). They were placed on Hoagland agar medium (1.6 g/L Hoagland, Plantmedia, Dublin, Ohio, USA; 1% agar, BD-Difco, Franklin Lakes, New Jersey, USA) for 48 hours at 23uC for pregermination until roots emerged.
3. Volatile Organic Compounds Analyses
3.1. Sample preparation for VOCs analyses. In order to analyse the blend of VOCs emitted by the two fungi and by non-infected or non-infected barley roots, samples of each organism were prepared. Fungi were grown on PDA medium slants. Barley roots were grown in vitro on Hoagland agar medium for 7 days.
Conidial suspensions of F. culmorum or C. sativus were prepared by pouring 1 or 4 ml of sterile water on PDA plates colonized by C. sativus or F. culmorum, respectively. The mycelium was gently scratched with a sterile scalpel and the water-and-conidia mix was filtered on a double layer of cheesecloth placed on a sterile funnel. This operation was repeated as many times as necessary to obtain the required volume of filtrate. The concentrations of the suspensions were determined by counting conidia on a Fuchs-Rosenthal counting chamber (Hecht Assistent, Sondheim/Rho¨n, Germany) according the manufacturer’s instructions. The con-centrations were adjusted at 26103conidia/mL for fungal VOC analyses and at 16106 conidia/mL for infected barley root analyses, using sterile water. In order to distribute the conidia evenly, 0.1% Tween 20 (Merck KGaA, Darmstadt, Germany) was added to each conidial suspension.
Fungal cultures were conducted on 7 mL PDA slants in 20 mL SPME vials (Filter Service, Eupen, Belgium) fitted with sealed caps (White silicone/blue PTFE, Filter Service). A drop of 50mL of conidial suspension at 26103 conidia/mL was poured onto the slant and spread across the whole surface (about 40 cm2) with a loop. The caps on the vials were not fully closed to allow for oxygen supply. The vials were placed in a growth chamber, at 23uC +/22uC. Five replicates of each fungal culture were prepared. The 5 replicates of C. sativus were prepared and analysed on the same day, but the replicates 1, 2, and 3 and the replicates 4 and 5 of F. culmorum were analysed at two different periods of time after an interval of 50 days. Empty vials and vials containing only PDA were used as controls. VOCs analyses were carried out 2, 7, 14, 21 and 27 days after inoculation (dai) for F. culmorum and 2, 7, 14, 21 and 28 dai for C. sativus.
Non-infected and infected barley roots were obtained by growing barley on square Petri dishes (Greiner, Belgium, 12 cm)
containing 50 mL of Hoagland agar medium (1% v/v). After 2 days germination, 10 sterile barley seeds per Petri dish were placed in a row, 3 cm from the edge. For the production of infected roots, 10 seeds were infected by spraying 1 mL of F. culmorum and/or C. sativus suspension (16106conidia/mL) onto the Petri dishes with a spray gun (Badger 350, Badger, Illinois, USA). A control treatment was carried out by spraying seeds with 0.1% Tween 20 in 1 mL of sterile water. Dishes of non-infected or infected roots were hermetically closed and placed vertically, plant roots pointing downward, in a growth chamber under LED light (94mmol photons/m2/s) with a 20 h/4 h photoperiod at 22uC +/ 20.5uC for 7 days. Five replicates of each treatment were produced and analysed strictly in the same conditions, in two independent experiments after an interval of 44 days, except for roots infected by the two fungi for which the 5 replicates were produced and analysed on the same day. After 7 days, the plants were gently pulled off the Hoagland agar medium and the roots were excised with scissors just under the seed. The roots of 10 plants were placed into a 20 mL SPME vial. Empty vials and vials with a piece of Hoagland agar medium were used as controls. After analyses, barley roots were dried in a drying oven at 150uC during 24 h and weight.
3.2. Head-Space Solid-Phase-Micro-Extraction (HS-SPME). The Solid-Phase-Micro-Extraction (SPME) technique consists in catching the VOCs contained in the head-space above a sample in an SPME vial with a fibre coated with adapted stationary phases.
SPME fibres were coated with three 65mm thick stationary phases : divinylbenzene – carboxen - polydimethylsiloxane (DVB – Carboxen - PDMS) (Supelco, Bellefonte, PA, USA). All fibres were conditioned before first use at 270uC for 1 hr according to the supplier’s recommendations and they were tested before each analysis to minimize the variations due to the fibre deterioration. They were tied to a plunger within a protective needle that directly pierced through vial septa and were exposed to the head-space within the sample vials. Internal standards (1mL of a methanolic solution of butylbenzene ($99%, Sigma-Aldrich, Belgium) at 86.6 ng/mL for fungal analyses and at 8.66 ng/mL for root analyses were added into each vial using a 1-mL-gas-tight calibrated Hamilton syringe. Briefly, SPME extractions were performed using the following method : after equilibration of the vials for 10 min at 25uC, the fibre was inserted into the head-spaces for 20 min at the same temperature. After extraction, the volatile compounds were desorbed in pulsed splitless mode for 5 min at 250uC.
3.3. GC-MS analyses. Gas chromatography–mass spectrom-etry (GC-MS) analyses were performed on a gas chromatograph (Agilent Technologies 7890A) coupled to a mass selective detector (Agilent Technologies 5975 C) with enhanced Chemstation version E.02.00.493 software. The GC, fitted with a Gerstel MPS autosampler (Maestro 1, version 1.4.8.14/3.5; Mu¨llheim/ Ruhr, Germany), was used for SPME injection and it was checked weekly for its resolution capacity and the conservation of retention times. Separation was performed on a VF-WAX column (Agilent technologies, USA; 30 m x 0.250 mm I.D, 0.25mm film thickness). Helium was used as a carrier gas at a constant flow rate of 1.5 mL/min. The inlet temperature was 250uC. Pulsed splitless injection mode in a 1.5 mm HS-liner was used (injection pulse pressure of 30 psi for 1 min). The following temperature programs were used: 35uC for 2 min, 5uC/min up to 155uC, 20uC/min up to 250uC, and a final hold at 250uC for 10 min. The mass spectrometer was operated in electron ionization (EI) mode at 70 eV, source temperature 230uC; quadrupole temperature 150uC; scanned mass range from 20 to 350 amu, threshold of
150 amu; scan speed, 4.27 scans/sec. It was regularly calibrated in order to produce ions of exact mass and constant response intensity in time.
3.4. Compounds identification. VOC identification was undertaken by comparing retention times and recorded mass spectra using the Wiley 275, pal600k and NBS75K spectral databases. Further identification was carried out by comparing the theoretical non-isothermal Kovats retention indices of each molecule with calculated retention indices. Retention indices were calculated by injecting saturated n-alkane standard solution C7– C30 (1,000mg/mL in hexane, Supelco, Belgium), using the definition of Van den Dool and Kratz [20].
Whenever possible, identifications were confirmed by injecting available commercial standards provided by Sigma-Aldrich with chromatographic purity, except n-hexane (Scharlau; $96%); heptane (VEL; $99%); octa-1,3-diene (Interchim); p-xylene and m-xylene (UCB chemicals); butan-1-ol (Janssen Chimica; 99.5%); longifolene (Penta Manufacturing); (2E,6Z)-nona-2,6-dienal (Inter-chim) and tetradecanal (TCI; .95%). A mix was made from pure concentrated standards by diluting standards 105 fold in methanol (concentration range from 65.9 to 101.7 mg/L). For GC-MS measurements, 1mL of a standard mix was placed on the walls of a 20 mL vial before quickly closing it securely. Only the 5 major non-identified VOCs with a relative quantity higher than the limit of quantification (i.e. signal/noise ratio .3 at the same retention time) were included in the results.
3.5. Quantification. GC-MS analyses only allow for relative quantifications of emitted VOCs. Relative quantities were calculated by comparing the area of the butylbenzene peak, whose quantity was known (86.6 or 8.66 ng), with the area of the peak of interest. They were expressed as mean percentages of total relative VOC quantities. For barley root analyses, the mean percentages were standardized for 1 gram of dry roots.
4. In vitro Co-culture of Fungi and Barley
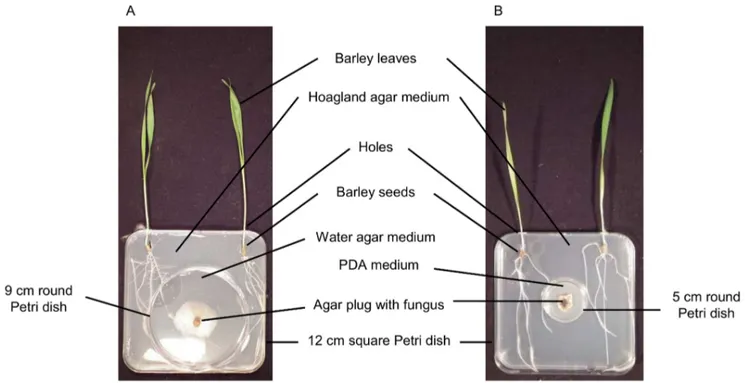
In order to investigate the effect of fungal VOCs on barley and vice versa, barley and fungi were grown in different compartments of a co-culture device, sharing the same atmosphere. VOCs were thus the only way the two organisms could communicate. Moreover, barley leaves were removed from the co-culture device in order to only take into account the VOCs emitted by the roots (Figure 1).
4.1. Effects of the blend of VOCs from non-infected barley roots on pathogenic fungi. To assess the effects of the spectrum of VOCs emitted by barley roots on fungi, the co-culture device consisted of 9-cm round Petri dishes without a lid (VWR, Belgium) placed in 12-cm square Petri dishes (Greiner, Belgium). Square Petri dishes were higher than round Petri dishes to allow VOCs to diffuse freely within the entire experimental device. Twenty-five mL of sterile water agar (1% w/v) were poured into each round Petri dish and 45 mL of Hoagland agar medium (1% w/v) were poured into each square Petri dish around the round Petri dish. Two holes were made with a heated puncher through each square Petri dish and lid to allow barley leaves to develop outside. The holes were filled with sterile cotton wool until the leaves were long enough to be taken out of the Petri dish (Figure 1A).
Two surface-sterilized barley seeds germinated for 48 hrs were placed in front of each hole. A 7-mm round plug of agar colonized by a 5-days old F. culmorum or a 14-days old C. sativus was placed in the center of each round Petri dish. Four treatments were tested: F. culmorum with or without barley and C. sativus with or without barley. Three independent trials were set up, with 10 replicates per treatment. The co-culture devices were sealed with parafilm and placed on a rack in a quasi-vertical position in a climatic chamber at 23uC. After 24 or 48 hrs, when barley leaves reached 2 cm, they were taken out of the co-culture device through the previously bored holes. Holes were filled as much as possible around the coleoptile using parafilm.
Figure 1. Pictures of the barley and fungi co-culture devices. Experimental devices for in vitro co-culture for the study of the effects of VOCs from non-infected or infected barley roots on pathogenic fungi (A) and for the study of the effects of fungal VOCs on barley (B).
The diameter of each fungus was measured 24, 48, 72, 96, 168 and 192 hours after inoculation (hai).
4.2. Effects of the blend of VOCs from infected barley roots on pathogenic fungi. The experimental device was the same as previously described. Each barley seed was inoculated with a conidial suspension of F. culmorum and C. sativus. Conidial suspensions were prepared as described in part 2.4.1. The concentration of each conidial suspension was adjusted at 1?106 conidia/mL with sterile water and 0.1% Tween 20 was added. About 100mL of conidial suspension were sprayed on each barley seed as previously described. For each fungus, roots were infected with F. culmorum (5 replicates), C. sativus (5 replicates) or water with 0.1% Tween 20 as a control (5 replicates).
4.3. Effects of the blend of VOCs from pathogenic fungi on barley. The co-culture device was almost the same as described in part 2.4.1. It consisted of 5-cm round Petri dishes without a lid (VWR, Belgium) containing 10 mL of PDA, placed at the center of 12-cm square Petri dishes (Greiner, Belgium) containing 50 mL of Hoagland 1% agar medium (Figure 1B).
Three different treatments were tested: barley cultivated alone or in the presence of F. culmorum or C. sativus. Four independent trials with 10 replicates per treatment were set up.
Two surface-sterilized barley seeds germinated 48 hrs earlier were placed in each square Petri dish, in front of each hole. A 7-mm diameter piece of agar colonized by a 5-days old F. culmorum was placed in the center of each round Petri dish. The same was done with a 14-days old C. sativus. Co-culture devices without fungi were used as controls. Co-culture devices were sealed with parafilm and placed on a rack in a quasi-vertical position in a climatic chamber at 23uC for 7 days. Barley leaves higher than 2 cm were taken out of the Petri dishes through the holes.
After 7 days, a picture and a scan of each co-culture device were taken. Plant aerial parts and roots were counted and weighed, and leaf surfaces and root lengths were measured.
5. Data Analysis
In each experiment, only the VOCs detected at the two dates of analysis were taken into account in order to minimize the variations due to the different dates of analysis. Thus the variations of VOC emission in time were minimized.
The data were analyzed using analysis of variance (P,0.05) performed under Excel software (Microsoft Office Excel, 2007), and Dunnett’s multiple comparisons test (a ,0.05) were performed under Minitab 16.2.2 software [21]. Leaf surfaces were measured with MVHimage software (PC v.8, John Pickle and Jacqueline Kirtley, Museum of Science, Boston, MA, 2004). Results
1. Analysis and Identification of Fungal and Barley VOCs
1.1. VOCs emitted by pathogenic fungi. Biogenous fungal VOCs were determined by comparing the analyses of fungal VOCs with control analyses (column, fibre, empty vial and the vial containing agar medium). In order to compare fungal analysis with barley roots analysis, only the fungal VOCs released after 7 days in vitro culture were reported in Table 1. The VOCs emitted over time after 2, 7, 14, 21, and 27 or 28 days are reported in the table S1 data. The ANOVAs (P,0.05) comparing the variances of the 5 replicates of each experiment showed that there were significant differences between the replicates that were analysed at different periods of time, only after 2 days culture. The replicates 1, 2 and 3 were different from the replicates 4 and 5 for C. sativus (p,0.0001) and F. culmorum (p = 0.005). At 7, 14, 21 and 27 or 28 days culture, the differences between the 5 replicates were not
significant either for C. sativus (0.451,p,0.977) or for F. culmorum (0.079,p,0.351). Gas chromatography analyses showed that seven biogenous VOCs were emitted by F. culmorum after 7 days culture (Table 1 and Figure 2 A), and 13 were emitted after 27 days (Table S1). Alcohols represented 43% of the volatile diversity emitted by F. culmorum and 53% of the total relative quantity emitted in 7 days. Concerning C. sativus, 105 compounds were detected after 7 days culture and 141 after 28 days culture, most of them were not identified (Table 1, Figure 2 B and Table S1). Terpenes represented 15% of VOC diversity and 97% of the relative quantity emitted in 7 days. Non identified molecules represented 5% of the relative emitted quantity and at least 16 of them were terpenoid compounds.
The VOCs emitted by F. culmorum and C. sativus were quite different. Only 2-methylpropan-1-ol was common to the two fungi after 7 days (Table 1), and only methyl methanoate, 2-methyl-propan-1-ol, 2-methylbutan-1-ol, and 3-methylbutan-1-ol were emitted by both the fungi over the whole period of analysis (Table S1).
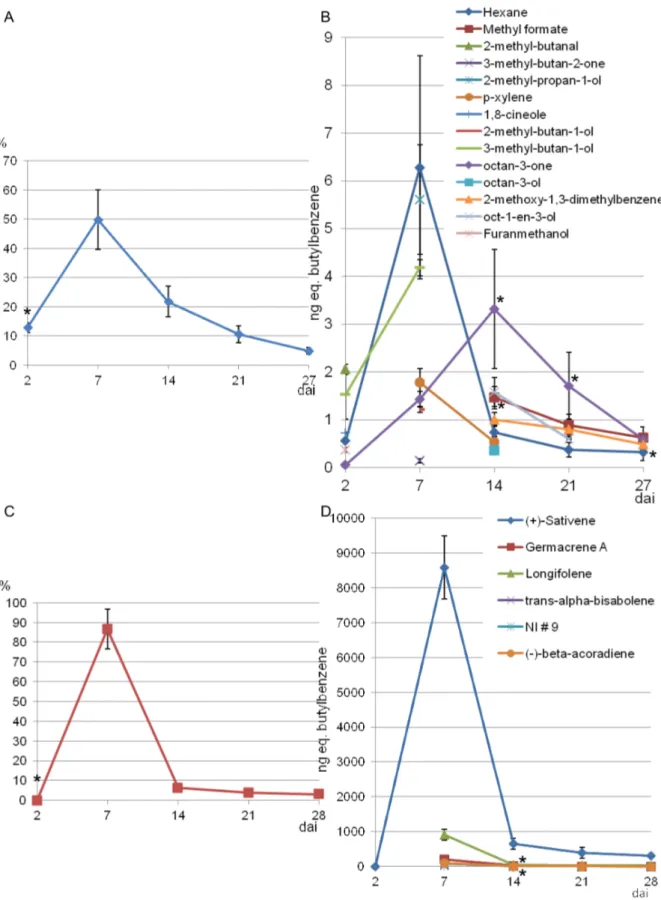
Variations in fungal VOC emissions were monitored over time between 2 and 27 or 28 days culture on agar medium (Figure 3). ANOVAs (P,0.05) were carried out at each sampling time for all the main volatiles emitted by C. sativus and F. culmorum. These statistical tests compared the variances of the replicates 1, 2 and 3 and the replicates 4 and 5 which were analyzed at different periods of time. For F. culmorum, there were no significant differences between the replicates except for 3 volatiles: hexane after 27 days culture (p = 0.017), methyl formate after 14 days culture (p = 0.024) and octan-3-one after 14 (p = 0.036) and 21 days culture (p = 0.039). For C. sativus, no significant differences were observed except for 2 volatiles: Germacre`ne A (p = 0.009) and longifolene (p = 0.035) after 14 days culture.
All F. culmorum VOCs were first emitted within 14 days culture and the highest emission occurred after 7 days, when 50% of the relative quantity of VOCs was emitted (Figure 3, A and B). N-hexane, octan-3-one, 2-methylpropan-1-ol and 3-methylbutan-1-ol were the most abundant m3-methylbutan-1-olecules (Table S1) : they represented 65% of the total relative quantity of VOCs emitted by F. culmorum in 27 days, even though 2-methylpropan-1-ol was emitted only punctually after 7 days culture. Some molecules were newly produced in relatively small quantities after 14 days; however total VOC emissions gradually decreased after 7 days.
Concerning C. sativus, VOCs were mainly produced after 7 days culture, when 87% of the relative quantity of VOCs was emitted. Sativene was by far the most abundant VOC emitted by C. sativus. It represented almost 83% of the total relative quantity emitted in 28 days. After the peak at 7 days, total VOC emissions decreased abruptly.
1.2. VOCs emitted by infected barley roots. Seven days after inoculation, the fungal infections were well developed on barley roots and common root rot symptoms were visible on each plant. Volatiles were collected from C. sativus- and F. culmorum-infected roots and compared with volatiles from non-culmorum-infected control plants. ANOVAs (P,0.05) were carried out to compare the variances of the 5 replicates of each treatment. There were no differences between the 5 replicates of healthy root analyses (p = 0.343), analyses of roots infected by C. sativus (p = 0.45), and analyses of roots infected by the two fungi (p = 0.31). However, ANOVAs showed significant differences between the 5 replicates of analyses of roots infected by F. culmorum (p,0.0001). The fifth replicate was significantly different from the four other. GC-MS analyses of the collected volatiles showed major differences between the VOCs emitted by fungus-injured barley roots and the VOCs from non-infected roots. Around 54 VOCs (44
Table 1. Percentages of VOCs emitted by the pathogenic fungi Fusarium culmorum and Cochliobolus sativus , b y non-infected barley roots and by barley roots infected by F. culmorum ,b y C. sativus or by both. Emitted b y Compounds a CAS RIcal b RIref c Identification d Class e C. sativus f F. culmorum f Non-infected roots g C. sativus -infected roots g F. culmorum -infected roots g C. sativus + F. culmorum infected roots g Pentane 1 09-66-0 500 500 MS, RI Aa – – 0.97 6 0.60 0.11 6 0.05 0.16 6 0.12 – n-hexane 1 10-54-3 600 600 MS, RI, STD Aa -3 0.4 6 22.63 – – – – 2-methylbuta-1, 3-diene 78-79-5 665 -M S A e 0.01 6 0.00 – – – – – Methyl methanoate 107-31-3 736 682 [46] MS, RI E – – – 3.36 6 3.37 -1 7.65 6 2.25 Dimethyl sulphide 75-18-3 737 844 [47] MS, RI, STD S – – 1.2 6 0.26 0.75 6 0.43 0.35 6 0.26 0.15 6 0.06 Methyl acetate 79-20-9 814 864 [47] MS, RI, STD E – – 2.73 6 1.43 0.99 6 0.55 1.4 6 1.68 2.2 6 0.44 Ethyl acetate 141-78-6 826 898 [48] MS, RI, STD E – – 2.14 6 1.11 – – – Methyl propanoate 554-12-1 889 911 [49] MS, RI, STD E – – – 3.43 6 4.13 -2 .19 6 0.65 3-methylbutan-2-one 5 63-80-4 918 – MS, STD K – 0.69 6 0.46 – – – – Methyl acrylate 96-33-3 938 – MS, STD E – – – 1.75 6 0.97 – 1 .06 6 0.09 Formic acid, 1-methylpropyl ester 589-40-2 941 – M S E – – – , LOQ – 0.24 6 0.04 Octa-1,3-diene 1 002-33-1 949 – MS, STD Ae – – – 1.06 6 0.51 0.27 6 0.02 0.45 6 0.08 2-methylpropyl formate 542-55-2 953 – MS, STD E 0.01 6 0.003 – – 2.32 6 0.6 – 3 .75 6 0.33 Pentan-3-one 96-22-0 957 984 [50] MS, RI, STD K – – 3.4 6 0.23 0.73 6 0.15 1.31 6 0.39 1.08 6 0.30 Methyl butanoate 623-42-7 962 982 [51] MS, RI, STD E – – 0.55 6 0.43 0.36 6 0.16 – 0 .31 6 0.05 Butanoic acid, 2-methyl, methyl ester 868-57-5 985 -M S E – – 0.83 6 0.29 -0 .68 6 0.47 0.41 6 0.09 Methyl 3-methylbutanoa te 5 56-24-1 995 1015 [52] MS, RI E – – 1.08 6 0.65 0.78 6 0.13 0.43 6 0.37 0.61 6 0.21 2-methylbut-3-en-2-ol 1 15-18-4 1020 1 036 [53] MS, RI, STD A , LOQ – – – – – Compounds a CAS RIcal b RIref c Identification d Class e C. sativus f F. culmorum f Non-infected roots g C. sativus -infected roots g F. culmorum -infected roots g C. sativus + F. culmorum infected roots g NI # 1 h – 1032 – – A a – – – 0.18 6 0.04 0.24 6 0.29 , LOQ NI # 2 h – 1041 – – A a – – – 0.18 6 0.02 , LOQ -Methyl pentanoate 624-24-8 1066 1 087 [49] MS, RI, STD E – – – , LOQ – , LOQ Undecane 1 120-21-4 1100 1 100 MS, RI Aa – – 0.48 6 0.13 0.19 6 0.07 – – 1,3-cis,5-cis-octatriene 3 3580-05-1 1102 1 108 [54] MS, RI Ae – – -, LOQ – 0.87 6 0.87 2-methylpropan-1-ol 7 8-83-1 1103 1 108 [55] MS, RI A , LOQ 2 7.2 6 11.07 -, LOQ – 0.3 6 0.14 Heptan-4-one 123-19-3 1108 -MS, RI K – -, LOQ 1 6 0.59 0.69 6 0.09 para-xylene 1 06-42-3 1109 1 127 [49] MS, RI, STD H – 8.62 6 2.83 1.88 6 0.46 0.22 6 0.16 0.54 6 0.8
-Table 1. Cont. Emitted b y Compounds a CAS RIcal b RIref c Identification d Class e C. sativus f F. culmorum f Non-infected roots g C. sativus -infected roots g F. culmorum -infected roots g C. sativus + F. culmorum infected roots g meta-xylene 1 08-38-3 1115 1 132 [49] MS, RI, STD H – – 1.27 6 0.24 0.09 6 0.00 0.09 6 0.02 -Butan-1-ol 7 1-36-3 1121 1 145 [56] MS, RI, STD A – – 0.24 6 0.09 , LOQ -Pent-1-en-3-ol 616-25-1 1137 1 176 [49] MS, RI, STD A – – – 0.34 6 0.11 -, LOQ alpha-phellandrene 99-83-2 1137 1 205 [57] MS, RI T – – – – 1.1 6 0.90 , LOQ alpha-terpinene 9 9-86-5 1154 1 208 [58] MS, RI, STD T – – – – 0.25 6 0.04 , LOQ (E)-hex-2-enal 6728-26-3 1160 1 220 [59] MS, RI, STD O – – – – – 0.12 6 0.06 Methyl hexanoate 106-70-7 1166 1 125 [60] MS, RI, STD E – – 0.36 6 0.12 0.36 6 0.16 0.13 6 0.01 , LOQ 1,8-cineole 4 70-82-6 1173 1 224 [57] MS, RI, STD T – – 0.43 6 0.18 – – – beta-phellandrene 555-10-2 1175 1 241 [57] MS, RI T – – – – 6.43 6 5.37 2.18 6 1.26 2-methylbutan-1-ol 137-32-6 1183 1 212 [49] MS, RI, STD A 0.1 6 0.04 5.89 6 0.57 – – -3-methylbutan-1-ol 123-51-3 1183 1 215 [49] MS, RI, STD A – 20.3 6 1.63 – – – 1 .85 6 1.48 1-ethyl-3-methylbenzen e 6 20-14-4 1196 1 222 [61] MS, RI, STD H – – – – 0.05 6 0.01 – 1-ethyl-2-methylbenzen e 6 11-14-3 1196 1 257 [61] MS, RI H – – 2.17 6 1.48 0.27 6 0.1 0.25 6 0.10 – Compounds a CAS RIcal b RIref c Identification d Class e C. sativus f F. culmorum f Non-infected roots g C. sativus -infected roots g F. culmorum -infected roots g C. sativus + F. culmorum infected roots g 2-pentylfuran 3777-69-3 1210 1 229 [62] MS, RI, STD F -19.51 6 10.80 1.64 6 0.80 1.35 6 0.98 , LOQ gamma-terpinene 99-85-4 1215 1 265 [57] MS, RI, STD T -1.45 6 1.02 0.42 6 0.22 Pentan-1-ol 7 1-41-0 1220 1 255 [50] MS, RI, STD A -2.63 6 0.91 0.7 6 0.4 -, LOQ Pentyl propanoate 624-54-4 1223 1 239 [49] MS, RI E -, LOQ -0.29 6 0.2 Octan-3-one 1 06-68-3 1230 1 244 [63] MS, RI, STD K -6.95 6 1.57 -3.14 6 0.58 18.03 6 15.94 7.02 6 3.45 3-methylbut-3-en-1-ol 7 63-32-6 1236 1 264 [52] MS, RI A , LOQ – – – – – para-cymene 9 9-87-6 1244 1 277 [57] MS, RI, STD T – – – – 1.99 6 1.92 0.29 6 0.06 Heptan-4-ol 5 89-55-9 1261 1 250 [64] MS, RI A – – – , LOQ 0.83 6 0.62 0.31 6 0.13 (E)-Pent-2-en-1-ol 1576-96-1 1272 1 335 [49] MS, RI, STD A – – 0.54 6 0.21 -2-(2-pentenyl)furan 70424-14-5 1273 -MS, RI F – – 0.50 6 0.35 -Oct-1-en-3-one 4312-99-6 1275 1 323 [57] MS, RI, STD K – – – , LOQ 1.12 6 0.65 0.69 6 0.28 5-methyl-hept-5-en-3-one -1282 -MS K – – – , LOQ 1.02 6 0.80 – (Z)-Pent-2-en-1-ol 1 576-95-0 1294 1 313 [53] MS, RI, STD A – – 1.31 6 0.16 0.3 6 0.01 – , LOQ 6-methyl-hept-5-en-2-one 110-93-0 1312 1 319 [58] MS, RI, STD K – – , LOQ – – 0 .44 6 0.17 3-butenylbenzene 768-56-9 1329 -MS H , LOQ – – – – – Hexan-1-ol 111-27-3 1330 1 360 [57] MS, RI, STD A – – 4.47 6 0.58 0.22 6 0.04 -, LOQ Methyl octanoate 111-11-5 1362 1 378 [47] MS, RI, STD E – – 0.63 6 0.34 , LOQ 0 .25 6 0.21 , LOQ Octan-3-ol 589-98-0 1373 1 388 [63] MS, RI, STD A – – – , LOQ 1.58 6 1.30 0.82 6 0.28
Table 1. Cont. Emitted b y Compounds a CAS RIcal b RIref c Identification d Class e C. sativus f F. culmorum f Non-infected roots g C. sativus -infected roots g F. culmorum -infected roots g C. sativus + F. culmorum infected roots g (E)-Hex-2-en-1-ol 9 28-95-0 1376 1 400 [65] MS, RI, STD A – – 1.14 6 0.33 – – – 1-methyl-2-(2-propenyl) -benzene 1 587-04-8 1379 -MS H , LOQ – – – – – 2-methoxy-3-(1-methyle thyl)-pyrazine 25773-40-4 1411 1 427 [51] MS, RI O – – – – – , LOQ Compounds a CAS RIcal b RIref c Identification d Class e C. sativus f F. culmorum f Non-infected roots g C. sativus -infected roots g F. culmorum -infected roots g C. sativus + F. culmorum infected roots g NI # 3 h – 1412 – – A e – – 0.2 6 0.07 – – – Oct-1-en-3-ol 3 391-86-4 1431 1 438 [66] MS, RI, STD A – – 0.79 6 0.15 11.96 6 6.44 35.49 6 25.1 25.21 6 7.21 delta-elemene 2 0307-84-0 1444 1 468 [67] MS, RI T 0.004 6 0.00 – – – – – NI # 4 h – 1444 – – F – – 0.40 6 0.13 – 0 .05 6 0.01 – NI # 5 h – 1445 – – A e – – – , LOQ , LOQ 0 .37 6 0.03 2,6-dimethyloct-7-en-2-ol 5 3219-21-9 1457 1 443 [68] MS, RI A – – 0.7 6 0.50 – 0 .07 6 0.02 – NI # 6 h 26456-76-8 1482 -MS Ae – – 0.24 6 0.07 12.69 6 3.36 5 .88 6 3.87 11.15 6 1.97 2-methoxy-3-(1-methylp ropyl)-pyrazine 24168-70-5 1485 1 490 [51] MS, RI, STD O – – – – – , LOQ 2-butenylbenzene 1560-06-1 1488 -MS H 0.03 6 0.02 – – – – – Pyrrole 109-97-7 1489 1 509 [69] MS, RI, STD O – – – – – , LOQ (E)-Non-2-enal 1 8829-56-6 1507 1 528 [66] MS, RI, STD O – – 4.44 6 1.78 0.84 6 0.25 1.56 6 0.90 0.87 6 0.62 (+ )-Sativene 3 650-28-0 1508 1 527 [70] MS, RI, STD T 8 2.45 6 17.41 – – 46.73 6 9.59 – 11.05 6 3.44 NI # 7 (sesquiterpene, MW = 2 04) h -1544 -T 0.73 6 0.22 – – – – – alpha-acoradiene 2 4048-44-0 1548 -MS T -– – – 1.73 6 0.94 0.2 6 0.02 Longifolene 4 75-20-7 1550 1 574 [71] MS, RI, STD T 7.98 6 2.70 – – 2.58 6 0.48 1.78 6 1.41 1.19 6 0.21 NI # 8 (sesquiterpene, MW = 2 04) h– 1555 -– T – – – – 0.75 6 0.47 , LOQ NI # 9 (sesquiterpene, MW = 2 04) h– 1562 -– T 0.84 6 0.17 – – , LOQ – – (2E,6Z)-nona-2,6-dienal 26370-28-5 1567 1 605 [72] MS, RI, STD O – – 0.9 6 0.46 0.14 6 0.01 0.24 6 0.07 , LOQ NI # 10 h – 1571 – – N I – – , LOQ – 0.15 6 0.11 – Epi-bicyclosesquiphel landrene 5 4324-03-7 1588 -MS T – – – – 3.55 6 1.08 0.36 6 0.05 Methyl non-2-enoate 111-79-5 1594 -MS, STD E – – 2.27 6 0.81 0.51 6 0.13 0.78 6 0.87 0.53 6 0.18 Compounds a CAS RIcal b RIref c Identification d Class e C. sativus f F. culmorum f Non-infected roots g C. sativus -infected roots g F. culmorum -infected roots g C. sativus + F. culmorum infected roots g NI # 11 h – 1595 – – A e – – 0.19 6 0.05 – – – Methyl benzoate 93-58-3 1595 1 635 [55] MS, RI, STD E – – 1.35 6 0.51 0.4 6 0.13 0.16 6 0.06 0.36 6 0.14 Widdrene 470-40-6 1609 1 626 [71] MS, RI T 0.01 6 0.00 – – – – – NI # 12 h -1631 -N I -– 0.29 6 0.06 , LOQ 0 .06 6 0.00 , LOQ
Table 1. Cont. Emitted b y Compounds a CAS RIcal b RIref c Identification d Class e C. sativus f F. culmorum f Non-infected roots g C. sativus -infected roots g F. culmorum -infected roots g C. sativus + F. culmorum infected roots g NI # 13 (sesquiterpene, MW = 2 04) h -1633 -T 0.40 6 0.14 – – – – – Nonan-1-ol 143-08-8 1643 -MS, STD A -– 0.57 6 0.23 0.17 6 0.07 0.09 6 0.03 , LOQ beta-acoradiene 28477-64-7 1645 -MS T 1.02 6 0.33 – – – 0.13 6 0.05 – alpha-humulene 6 753-98-6 1647 1 663 [58] MS, RI, STD T 0.02 6 0.09 – – – – – NI # 14 (sesquiterpene, MW = 2 04) h – 1651 – MS T – – – , LOQ – , LOQ NI # 15 (sesquiterpene, MW = 2 04) h – 1654 – – T 0.62 6 0.22 – – – – – cis-piperitol 1 6721-38-3 1657 1 698 [58] MS, RI T – – – – 1.21 6 0.42 1.12 6 0.60 beta-terpineol 138-87-4 1659 1 616 [71] MS, RI, STD T – – 1.03 6 0.17 , LOQ , LOQ , LOQ (Z)-non-3-en-1-ol 1 0340-23-5 1666 1 682 [73] MS, RI A – – 2.18 6 0.48 – – , LOQ alpha-amorphene 483-75-0 1670 1 691 [71] MS, RI T 0.04 6 0.01 – – – – – NI # 16 (sesquiterpene, MW = 2 04) h – 1677 – MS T 0.32 6 0.12 – – – – – alpha-terpineol 9 8-55-5 1691 1 711 [48] MS, RI T – – 0.29 6 0.09 , LOQ 0 .05 6 0.01 – Epizonarene 41702-63-0 1697 1 688 [74] MS, RI T 0.03 6 0.01 – – – – – (E)-non-2-en-1-ol 3 1502-14-4 1700 1 722 [75] MS, RI, STD A – – 16.78 6 5.46 0.29 6 0.05 0.15 6 0.02 , LOQ 3-methyl-6-propan-2-ylcy clohex-2-en-1-one 89-81-6 1704 1 739 [71] MS, RI K – – – – 1.02 6 0.85 0.43 6 0.06 alpha-muurolene 1 0208-80-7 1711 1 727 [71] MS, RI T 0.02 6 0.01 – – – – – Compounds a CAS RIcal b RIref c Identification d Class e C. sativus f F. culmorum f Non-infected roots g C. sativus -infected roots g F. culmorum -infected roots g C. sativus + F. culmorum infected roots g trans-alpha-bisabolene 25532-79-0 1718 1 740 [71] MS, RI T 0.33 6 0.15 – – – – – Germacrene A 28387-44-2 1736 1 737 [76] MS, RI T 1.93 6 0.66 – – , LOQ – , LOQ (3E,6Z)-nona-3,6-dien-1-o l 5 6805-23-3 1739 1 731 [54] MS, RI A – – 0.58 6 0.18 – – – NI # 17 h – 1748 – – N I – – – – 1.38 6 1.08 0.27 6 0.02 NI # 18 (MW = 150) h – 1748 – – H – – – , LOQ – 0.32 6 0.05 (2E,6Z)-nona-2,6-dien-1-o l 2 8069-72-9 1748 1 776 [77] MS, RI, STD A – – 8.14 6 3.54 , LOQ 0 .04 6 0.00 -n-dibutylformamide 7 61-65-9 1754 – MS, STD O – – 2.3 6 0.30 0.22 6 0.04 0.22 6 0.18 -beta-sesquiphellandrene 2 0307-83-9 1759 1 782 [58] MS, RI T 0.01 6 0.00 – – – – – 1-phenylbutan-1-one 4 95-40-9 1779 -MS, STD K 0.02 6 0.01 – – – – – 1-phenylethanol 98-85-1 1790 1 795 [77] MS, RI, STD A – – – , LOQ – , LOQ NI # 19 h – 1846 – – N I – – 0.39 6 0.09 -– – 2-phenylethanol 60-12-8 1886 1 859 [62] MS, RI, STD A , LOQ – 0.42 6 0.05 , LOQ – – Tetradecanal 124-25-4 1910 1 940 [77] MS, RI, STD O – – 0.9 6 0.57 – 0 .33 6 0.15 –
Table 1. Cont. Emitted b y Compounds a CAS RIcal b RIref c Identification d Class e C. sativus f F. culmorum f Non-infected roots g C. sativus -infected roots g F. culmorum -infected roots g C. sativus + F. culmorum infected roots g 1,3-benzothiazole 95-16-9 1930 1 951 [78] MS, RI, STD O – – 0.93 6 0.41 , LOQ 0 .16 6 0.03 , LOQ 5-pentyloxolan-2-one 104-61-0 2000 2 063 [72] MS, RI K – – 0.9 6 0.48 , LOQ 0 .1 6 0.07 – NI # 20 h -2010 -N I 0.5 6 0.10 – – , LOQ – – 6,10,14-trimethylpent a decan-2-one 502-69-2 2068 2 131 [79] MS, RI K – – 0.55 6 0.16 – – – Beyerene 3 564-54-3 2108 – MS T 0.03 6 0.00 – – – – – methyl hexadecanoate 112-39-0 2118 – MS E – – , LOQ – 0.04 6 0.01 , LOQ methyl 2-aminobenzoate 134-20-3 2130 2 260 [72] MS, RI E – – – – – , LOQ Compounds a CAS RIcal b RIref c Identification d Class e C. sativus f F. culmorum f Non-infected roots g C. sativus -infected roots g F. culmorum -infected roots g C. sativus + F. culmorum infected roots g Isopimaradiene 1 686-66-4 2144 -MS T 0.03 6 0.00 – – – – – Isokaurene 5 947-50-2 2159 -MS T 0.27 6 0.05 – – – – – Chemical classes: Alcohols 0.1 6 0.04 5 3.39 6 4.42 4.049 6 0.92 13.98 6 1.02 38.25 6 3.87 2 8.49 6 1.85 Organic esters 0.01 6 0.00 – 11.94 6 0.63 14.26 6 1.03 3 .87 6 0.46 29.6 6 0.39 Aromatic hydrocarbons 0.03 6 0.02 8.62 6 2.83 5.32 6 0.73 0.58 6 0.09 0.93 6 0.23 0.32 6 0.05 Ketones 0.02 6 0.01 7.64 6 1.02 4.85 6 0.29 3.87 6 0.36 23.6 6 2.76 10.35 6 0.72 Alkanes –3 0 .4 6 22.63 1.45 6 0.36 0.66 6 0.04 0.4 6 0.21 , LOQ Alkenes 0.01 6 0.00 – 0.63 6 0.06 13.75 6 1.94 6 .15 6 1.94 12.84 6 0.74 Furanic compounds – – 20.41 6 3.76 1.64 6 0.80 1.4 6 0.49 , LOQ Suphur compounds – – 1.2 6 0.26 0.75 6 0.43 0.35 6 0.26 0.15 6 0.06 Terpenoids 97.11 6 0.97 – 1.75 6 0.15 49.31 6 5.04 20.42 6 1.14 1 6.81 6 0.73 Others – – 9.47 6 0.70 1.2 6 0.1 2.51 6 0.27 0.99 6 0.34 0.5 6 0.10 – 0.68 6 0.07 , LOQ 1 .59 6 1.18 0.27 6 0.02 aCompounds listed from their order o f elution in a VF-Wax polar capillary column (30 m 6 0.25 mm 6 0.25 m m).1 bLinear retention index calculated o n a VF-Wax capillary column with a homologous series of n-alkanes (C7–C30). cLinear retention index in literature. dIdentification p roposal is indicated by the following: MS, identification b y comparing E I m ass spectrum w ith Wiley275, p al600k a nd NBS75K mass spec tral database; R I, identification b y retention indexes w ith literature data; STD, comparison w ith the retention times and m ass spectra of available standards. eChemical classes: A: alcohol, E : o rganic ester, H: aromatic hydrocarbon, K: ketone, Aa: alkane, Ae: alkene, F: furanic compound, S: sulphur compound , T : terpenoid, O: other, NI: non identified. fMean percentage o f VOCs emitted b y 5 fungal cultures after 7 d ays, for a n initial fungal inoculum of 2,000 conidia. gMean percentage e mitted by 5 samples of 1 g ram of dry b arley roots after 7 d ays culture. hOnly the five major n on-identified molecules (NI) of each treatment (. LOQ) were listed in the table. , LOQ m eans that the mean quantity of the compound is below the limit of quantification (signal/noise ratio , 3 a t the same retention time). Underscored figures are remarkable (see in the text). doi:10.1371/journal.pone. 0066805.t001
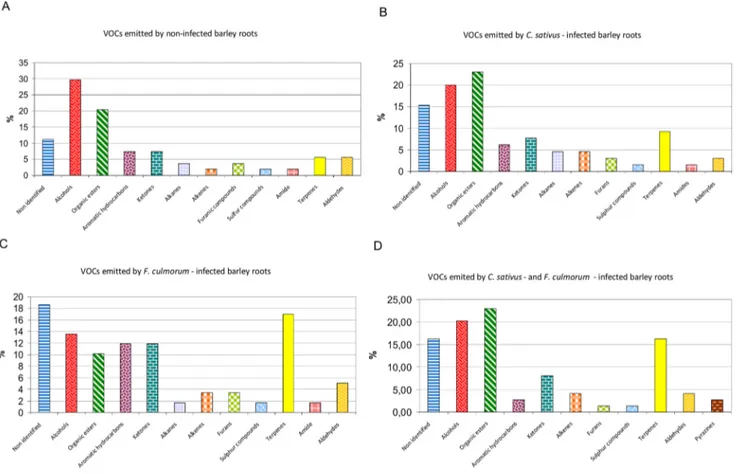
identified and 10 non-identified) were detected in non-infected roots analyses, 64 (52 identified and 12 non-identified) in C. sativus-infected roots, 60 (46 identified and 14 non-identified) in F. culmorum-infected roots, and 73 (59 identified and 15 non-identified) in roots infected by the two fungi (Table 1 and Figure 4). Major differences were observed between the VOCs released by non-infected and infected roots. New volatiles, not detected in fungal or non-infected root analyses, were observed when barley roots were attacked by a fungal pathogen. Twenty-three new VOCs (18 identified and 5 non-identified) were detected when the roots were attacked by F. culmorum (underscored figures
in the column named ‘‘F. culmorum infected root’’ in Table 1), and 21 (16 identified and 5 non-identified) when they were attacked by C. sativus (underscored figures in the column named ‘‘C. sativus infected root’’ in Table 1). For F. culmorum-infected roots the newly released volatiles were terpenes (48%), ketones (17%), alcohols (9%), alkanes (9%), alkenes (9%), aromatic hydrocarbons (4%) and non-identified volatiles (4%). For C. sativus-infected roots new VOCs were organic esters (27%), alcohols (23%), ketones (18%), alkenes (14%), alkanes (9%), terpenes (6%), and aromatic hydrocarbons (6%). Terpenes emitted by non-infected barley roots were 1,8-cineole, a-terpineol and b-terpineol; they
repre-Figure 2. Chemical families of the VOCs emitted byFusarium culmorum(A) andCochliobolus sativus(B).
Figure 3. Time-course of VOC emission byFusarium culmorumandCochliobolus sativus. Time-course of total VOC emissions by F. culmorum (A) and C. sativus (C) and time-course of the emission of each VOC produced by F. culmorum (B) and of the 6 major VOCs produced by C. sativus (C and D) between 2 and 28 days culture. NI #9 means non-identified molecule number 9 (see Table 1). Stars (*) indicate a significant difference between the 5 replicates according to ANOVA (P,0.05).
sented only 1,75% of the total relative VOC quantity. Their production increased dramatically when the roots were attacked by F. culmorum. After 7 days culture, the major newly released terpenes were b-phellandrene, epi-bicyclosesquiphellandrene, pa-ra-cymene, and longifolene (6.43%, 3.55%, 1.99%, and 1.78% of the total relative VOC quantity, respectively). C. sativus-infected roots released rather new organic esters and ketones : methyl propanoate, methyl methanoate and methyl acrylate (3.43%, 3.36%, 1.75% of the total relative VOC quantity, respectively). C. sativus-infected roots also released octan-3-one and octa-1,3-diene in high relative amounts (3.14% and 1.06% of the total relative VOC quantity, respectively). Compared with non-infected roots, all infected roots samples showed remarkable increases in oct-1-en-3-ol and NI #6. Altogether, non-infected roots released higher amounts of VOCs than infected roots but some VOCs showed surprisingly low levels compared with infected roots (e.g. 2-pentylfuran, (E)-non-2-en-1-ol or (2E, 6Z)-2,6-nonadien-1-ol). Moreover, ten volatiles were only emitted by non-infected roots (i.e. ethyl acetate, 1,8-cineole, (E)-pent-2-en-1-ol, 2-(2-pentenyl)-furan, (E)-hex-2-en-1-ol, NI #3, NI #11, (3E, 6Z)-3,6-nonadien-1-ol, NI #19, and 6,10,14-trimethyl-2-pentadecanone) (under-scored figures in the column named ‘‘Non-infected roots’’ in Table 1).
When barley roots were attacked by both F. culmorum and C. sativus, they generally emitted the same VOCs as detected in the trials with fungi alone and with mono-infected barley roots. But five compounds were newly released in trace amounts when barley was infected by both fungi: (E)-hex-2-enal,
2-methyoxy-3-(1-methylethyl)-pyrazine, 2-methyoxy-3-(1-methylpropyl)-pyrazine, pyrrole and methyl 2-aminobenzoate (underscored figures in the column named ‘‘C. sativus+F. culmorum infected roots in Table 1).
In addition to the compounds mentioned in Table 1, one non-identified alcohol representing 0.19% of the total relative VOC quantity was detected in infected barley roots. Six non-identified VOCs, including two terpenoids, were detected in trace amounts in C. sativus-infected barley roots, five non-identified VOCs representing 0.15% of the total relative VOC quantity were detected in F. culmorum-infected barley roots, and seven non-identified VOCs representing 0.18% of the total relative VOC quantity were detected in C. sativus- and-F. culmorum-infected barley roots.
2. In vitro Co-culture of Fungi and Barley
2.1. Effects of the blend of VOCs from non-infected barley roots on pathogenic fungi. The effect of the volatiles released by non-infected barley roots on F. culmorum and C. sativus was assessed by cultivating the two organisms in vitro in a shared atmosphere. In the 3 independent trials, barley developed well and, after 9 days co-culture, aerial parts were between 5 and 20 cm high, whereas roots were between 3 and 15 cm long with a few secondary roots. All the plants reached approximately the 12th Zadoks’ stage [22]. Fungal growth was never totally inhibited. As F. culmorum grew faster than C. sativus on water agar medium, the diameter of F. culmorum was measured only 144 or 168 hai, until the fungus colonized the whole Petri dish. The diameter of C. sativus was measured until 192 hai.
Figure 4. Chemical classes of the VOCs emitted by non-infected or infected barley roots. Classes of VOCs emitted by non-infected barley roots (A), by barley roots infected by C. sativus (B), infected by F. culmorum (C) or infected by the two fungi (D) after 7 days culture in vitro on Hoagland agar medium.
ANOVAs showed that no significant change occurred in fungal growth when the fungi were cultivated in the presence of VOCs from non-infected barley roots (Figure 5).
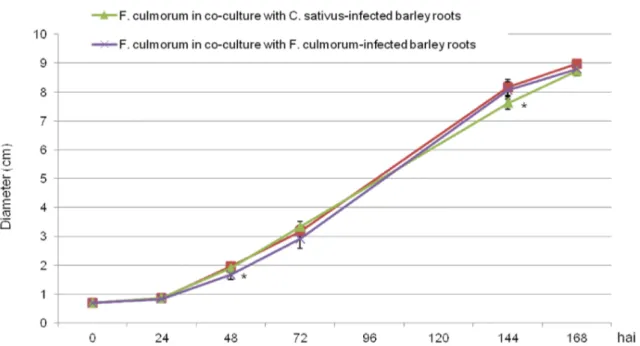
2.2. Effects of the blend of VOCs from infected barley roots on pathogenic fungi. The effects of the volatiles released by infected barley roots on F. culmorum and C. sativus were assessed by cultivating each fungus in vitro in an atmosphere shared with barley roots infected by F. culmorum or C. sativus. Fungal growth was compared with a control where each fungus was grown in a plate where only volatiles were exchanged with non-infected barley roots within the head-space.
The diameter of F. culmorum grown with non-infected barley roots was slightly larger than when it was grown with infected roots (Figure 6). However, significant differences were observed only punctually 48 hrs after infection for F. culmorum-infected barley roots (p = 0.029) and 144 hrs after infection for C. sativus-infected barley roots (p = 0.034) (Figure 6). Therefore, we cannot conclude that the VOCs released by infected barley roots had a long-term effect on F. culmorum growth.
According to Dunnett’s tests, the diameter of C. sativus was significantly smaller when the fungus shared the atmosphere of F. culmorum-infected barley roots from 168 hrs after infection (p = 0.032) and fungal growth was decreased by more than 13% 168 hai and up to 17% 192 hai (Figure 7).
In an atmosphere containing VOCs from C. sativus-infected roots, C. sativus growth was significantly decreased (p = 0.005) by about 13% 192 hrs after infection (Figure 7). Therefore, the blend of VOCs released by infected barley roots significantly decreased C. sativus growth.
2.3. Effects of the blend of VOCs from pathogenic fungi on barley. The effect of fungal VOCs on barley development was studied in similar experimental devices to those previously described. In each Petri dish, two barley seeds were grown in an atmosphere shared with F. culmorum, C. sativus or a control. Thus,
for each treatment, 20 barley plants were measured. Non-germinated barley seeds were not taken into account in the statistical analyses. Throughout the four trials, 69 barley plants were analyzed following ‘F. culmorum’ treatment, 64 were analyzed following ‘C. sativus’ treatment, and 60 were analyzed for the control treatment.
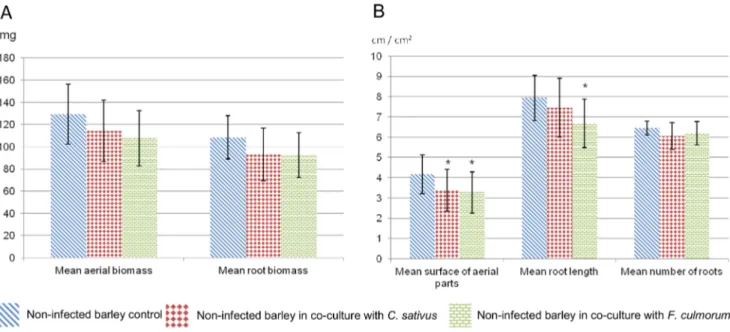
The statistical tests showed no significant difference between treatments and control for the biomass of aerial parts (p = 0.065), of belowground parts (p = 0.069) and for the number of roots (p = 0.12) (Figure 8). On the other hand, ANOVAs and Dunnett’s tests showed that the VOCs emitted by F. culmorum significantly decreased leaf surface by 21.5% (p = 0.027) and mean root length by 15% (p = 0.019). The VOCs emitted by C. sativus decreased leaf surface by 19%. This allows us to conclude that fungi can affect plant growth by emitting VOCs.
Discussion
The aim of this study was to characterize the volatile interactions between non-infected or infected barley roots and two pathogenic fungi, C. sativus and F. culmorum that cause common root rot on cereals. To our knowledge, it is the first paper that deals with below-ground volatile interactions between plants and pathogenic fungi. Our results show that a pathogenic fungal infection on barley roots induces VOC production and that the blend of these VOCs slowed down the growth of our pathogens, especially C. sativus. Therefore those molecules or their induction are promising methods for controlling common root rot on barley crops.
To date, a database of volatiles emitted by microorganisms (DOVE-MO) compiles approximately 300 bacteria and fungi described as VOC producers [23]. C. sativus and F. culmorum are not listed in it, and to our knowledge this is the first time that the
Figure 5. Effect of VOCs from non-infected barley roots on Fusarium culmorum andCochliobolus sativus growth. Time-course of
F. culmorum growth when cultivated alone (red squares) or in the presence of VOCs from non-infected barley roots (blue diamonds) and of C. sativus growth when cultivated alone (purple crosses) or in the presence of VOCs from non-infected barley roots (green triangles).
VOCs from those two pathogenic fungi have been precisely described.
There are four sources of variation of volatile emission: the production of biological material, the sampling with an SPME fibre, the chromatographic separation, the mass spectrometer
response. As explained previously, all the needed precautions were taken and the machines were properly calibrated before each analysis. Statistical tests were carried out to check that the 5 replicates of each treatment that were analyzed at two different dates were comparable. The tests showed that there was no
Figure 6. Effect of VOCs from non-infected or infected barley roots on the growth ofFusarium culmorum. Time-course of F. culmorum
growth when cultivated in the presence of VOCs from non-infected barley roots (red squares), from C. sativus-infected roots (light green triangles) or from F. culmorum-infected roots (purple crosses). Stars (*) indicate a significant difference from the control according to Dunnett’s test (a ,0.05). doi:10.1371/journal.pone.0066805.g006
Figure 7. Effect of VOCs from non-infected or infected barley roots on the growth ofCochliobolus sativus. Time-course of C. sativus
growth when cultivated in the presence of VOCs from non-infected barley roots (blue squares), from C. sativus-infected roots (orange triangles) or from F. culmorum-infected roots (dark green crosses). Stars (*/**) indicate a significant difference from the control according to Dunnett’s test (a ,0.05 or a ,0.01, respectively).
difference between the 5 replicates of each treatment except for fungal analyses at 2 days culture and for the analyses of roots infected by F. culmorum. The fifth replicate analyzed on the 1st February 2012 was different from the four others replicates that were analyzed on the 19 December 2011 (nu1, 2 and 3) and the 1st February 2012 (nu4). This shows that biological variations are more important than the date of the analyses. Moreover, the VOCs that were not detected at the two analysis dates were not considered in the results. Only the molecules with a stable emission in time were taken into account. Thus, the 5 replicates of each treatment can be compared even if they were not analyzed at the same time and the volatile emission by the fungi can be compared with the emissions of volatiles by infected roots.
The analyses of fungal VOCs show that 2 pathogenic fungi can emit very different molecules. Only 5 metabolites were released by both fungi in 27 days. According to several studies, 2-methylpro-pan-1-ol, 3-methylbutan-1-ol and oct-1-en-3-ol are commonly produced by fungi [24–26]. Other volatiles are more specifically emitted. For example, sativene was first isolated from C. sativus and is released in high amounts by that fungus [27]. F. culmorum rather seems to emit VOCs commonly produced by other fungal species. The diversity of detected volatiles depends on the number and the sensitivity of the techniques set up [23]. Moreover, VOC amounts and nature depend on nutrient availability and culture conditions, but the main VOCs generally remain unchanged [28–30]. Our results show a maximal emission of fungal VOCs after 7 days culture in vials. This period corresponds approximately to the time needed for the fungus to colonize the whole agar surface in the vials. Fungal growth rate probably modifies VOC emissions by fungi.
Many papers report analyses of the VOCs emitted by aerial parts or seedlings of cereals, and the induction of new aerial volatiles during a fungal infection of barley roots [31–33]. However, this study investigates for the first time the VOCs of cereal roots and demonstrates that a fungal attack on barley induces below-ground volatiles emission. The observed variations suggest that the interaction between barley roots and pathogenic
fungi modifies the metabolism of both barley and fungi by causing them to switch on/off the emission of certain VOCs. Since different volatiles are induced by C. sativus and F. culmorum, the molecular pathways induced by fungal infections can be expected to differ according to the pathogen. In our experimental conditions, the origin of the newly produced VOCs remains uncertain. They can be released either by barley roots or by fungi. The most surprising change in volatile profile was the increase in terpene production after F. culmorum infection. Several studies report the induction of volatile production, especially of terpenoid volatiles, involved in plant defence systems, before, during or after a biotic or an abiotic stress. Literature suggests that the newly emitted VOCs are released by plant roots rather than by fungi as the most common volatile signals involved in direct and indirect defences of plant aerial parts include metabolites of the lipoxygenase (LOX) pathway, the shikimic acid pathway, and products of the terpenoid pathway (monoterpenes, sesquiterpenes, homoterpenes). Some genes inducing VOC emission have also been recently isolated from plants [34,35]. It is attractive to think that the production of terpenoids released in the soil could depend on the same molecular mechanisms as in aerial parts. Molecular and genetic analyses are needed to trace the origin of those VOCs and to determine the metabolic mechanisms that underlie the variations in volatile emissions, especially the increase in terpene emissions.
Two experimental setups for co-cultivation were designed to match the observation needs. In the device made to study the effects of the VOCs of barley roots on fungi, the fungi were grown on water agar in large Petri dishes to not influence their growth with supplementary nutrients or dish wall. In the device made to study the effects of the fungal VOCs on barley, fungi were grown on PDA in small Petri dishes to favour their growth and the emission of VOCs and to give more space to barley to grow.
In our experiments, volatiles from non-infected barley roots and from F. culmorum-infected roots did not influence the growth of the pathogenic fungi. However, C. sativus growth was significantly affected by the blend of VOC released by C. sativus-infected roots. Figure 8. Effect of fungal VOCs on barley growth. Biomass of aerial parts and roots (A), surface of aerial parts, mean root length and number (B) of barley seedlings grown in the absence of fungal VOCs (blue diagonals) or in the presence of VOCs emitted by C. sativus (red diamonds) or F. culmorum (green bricks). Stars (*) indicate a significant difference from the control according to Dunnett’s test (a ,0.05).
The decreased fungal growth we observed might result from a limitation of enzyme synthesis rather than an inhibition of enzyme activity [36]. The most current examples of volatile induction for plant defence concern herbivore attacks [37]. But our results suggest, like other studies, that the VOCs emitted de novo during a fungal attack play a role in the induced systemic resistance of plants against pathogenic fungi [34]. Plant volatiles can also affect fungal reproduction and cellular development [38]. This study stresses the need for assessing the effects of the VOCs released by infected barley roots on C. sativus and F. culmorum sporulation and cellular morphology. Furthermore, the effects of some major induced volatiles, taken independently, on the growth and cellular development of pathogenic fungi also need to be investigated.
From another point of view, the smaller barley leaf surface resulting from the VOCs emitted by C. sativus and F. culmorum and the shorter mean root length resulting from the volatiles released by F. culmorum suggest that pathogenic fungi interact with plants through volatiles. This phenomenon could be part of the ‘‘pathogenic strategy’’ of fungi. VOCs emitted by pathogenic fungi could weaken plants before any physical contact between the two organisms [17,18]. Some studies show that C. sativus produces sesquiterpenoid toxins that are synthesized from farnesol. We detected cyclosativene and (-)-sativene, precursors of helminthos-porol [39,40]. Helminthoshelminthos-porol, prehelminthosporal and hel-minthosporal are crop-destroying toxins that inhibit the respira-tion of roots and coleoptiles and affect the cellular metabolism of different varieties of barley and wheat [15,41]. However, other studies indicate that helminthosporol and helminthosporic acid activate a-amylase production as gibberellin does and thus promote seedling growth [42]. Concerning F. culmorum, the sesquiterpene-derived toxins trichothecenes (i.e. deoxynivalenol, nivalenol and zearalenone) are potent inhibitors of protein synthesis and are hypothesized to inhibit the activation of defence response genes [18]. Trichodiene, a volatile marker of trichothe-cene biosynthesis, was not detected in our analyses [43,44]. We can therefore suggest that the pathogenicity of our F. culmorum strain toward barley was not due to mycotoxins but to other VOCs emitted by the fungus.
Our study let think that the bitrophic rhizospheric interaction between one plant and one or two pathogenic fungi involves fungal VOCs as pathogenic factors and plant VOCs as defence agents. However, interactions that take place in the rhizosphere
include a much larger number of organisms. The rhizosphere is a very complex and competitive environment that includes detri-mental or beneficial bacteria or fungi, insects, plants and viruses, and is submitted to all the local abiotic parameters. Thus volatile interactions rarely concern only two organisms. Inside the soil, the diffusion of the volatile molecules involved in those interactions depends on the chemical properties of the volatiles themselves and on the physico-chemical properties of the soil. Diffusion, adsorption and biodegradation phenomena determine volatile distribution below-ground [23]. Thus the effects of volatiles observed in vitro are most probably different from those observed in vivo, especially as soils can have their own intrinsic fungistatic properties [45].
In conclusion, the volatiles produced de novo during the interaction between barley and pathogenic fungi represent new opportunities for biological control methods. The effects of those VOCs observed in vitro are promising. Control methods could consist in directly applying synthesized volatiles to cereal fields or in eliciting volatile production to activate the induced defence systems of plants. However, the induction mechanisms at the metabolic and genetic levels and the behaviour of protective volatiles in natural environments remain to be characterized in order to develop an efficient environment-friendly method for cereal protection.
Supporting Information
Table S1 VOCs emitted by the pathogenic fungi Fusarium culmorum and by Cochliobolus sativus after 2, 7, 14, 21, and 27 or 28 days.
(DOC)
Acknowledgments
We thank Morgan Laloux for GC-MS analyses of standard VOCs. Author Contributions
Conceived and designed the experiments: MF GL MLF MHJ. Performed the experiments: MF. Analyzed the data: MF MLF. Contributed reagents/ materials/analysis tools: MF GL MLF. Wrote the paper: MF GL MLF MHJ.
References
1. Dudareva N, Negre F, Dinesh A, Nagegowda DA, Orlova I (2006) Plant volatiles: Recent advances and future perspectives. Critical Reviews in Plant Sciences 25(5): p.417–440.
2. Bernasconi ML, Turlings TCJ; Ambrosetti L, Bassetti P, Dorn S (1998) Herbivore-induced emissions of maize volatiles repel the corn leaf aphid, Rhopalosiphum maidis. Entomologia Experimentalis Et Applicata 87(2): p.133– 142.
3. Reinhard J, Srinivasan MV, Zhang S (2004) Scent-triggered navigation in honeybees. Nature 427(6973): p.411.
4. Turlings TCJ, Tumlinson JH, Lewis WJ (1990) Exploitation of herbivore-induced plant odors by host-seeking parasitic wasps. Science 250(4985): p.1251– 1253.
5. De Moraes CM, Lewist J, Pare PW, Alborn HT, Tumlinson JH (1998) Herbivore-infested plants selectively attract parasitoids. Nature 393(6685): p.570–573.
6. Piesik D, Pan´ka D, Jeske M, Wenda-Piesik A, Delaney KJ, et al. (2012) Volatile induction of infected and neighbouring uninfected plants potentially influence attraction/repellence of a cereal herbivore. Journal of Applied Entomology 137(4): p.296–309.
7. Mumm R, Dicke M (2010) Variation in natural plant products and the attraction of bodyguards involved in indirect plant defense. Canadian Journal of Zoology 88(7): p.628–667.
8. Rasmann S, Turlings TCJ (2008) First insights into specificity of belowground tritrophic interactions. Oikos. 117(3): p.362–369.
9. FAOSTAT website. Available: http://faostat.fao.org/. Accessed 2012 Septem-ber 10.
10. Murray GM, Brennan JP (2010) Estimating disease losses to the Australian barley industry. Australasian Plant Pathology 39(1): p.85–96.
11. Dastur JF (1942) Notes of some fungi isolated from ‘black point’ affected kernels in the central provinces. Indian Journal of Agricultural Sciences 12: p.731–742. 12. Piening LJ, Atkinson TG, Horricks JS, Ledingham RJ, Mills JT, et al. (1976) Barley losses due to common root rot in the prairie provinces of Canada, 1970– 72. Canadian Plant Disease Survey 56: p.41–45.
13. Kumar J, Scha¨fer P, Hu¨ckelhoven R, Langen G, Baltruschat H, et al. (2002) Bipolaris sorokiniana, a cereal pathogen of global concern: cytological and molecular approaches towards better control. Molecular Plant Pathology 3(4): p.185–195.
14. Smiley RW, Gourlie JA, Easley SA, Patterson L-M, Whittaker RG (2005) Crop damage estimates for crown rot of wheat and barley in the Pacific Northwest. Plant Disease 89(6): p.595–604.
15. Wiese MV (1977) Compendium of Wheat Diseases St Paul, Minnesota: APS Press. xii +106.
16. Mathre DE, Johnston RH, Grey WE (2003) Diagnosis of Common Root Rot of Wheat and Barley. Plant Health Progress doi:10.1094/PHP-2003-0819-01-DG. 17. Macı´as-Rubalcava ML, Herna´ndez-Bautista BE, Oropeza F, Duarte G, Gonza´lez MC, et al. (2010) Allelochemical Effects of Volatile Compounds and Organic Extracts from Muscodor yucatanensis, a Tropical Endophytic Fungus from Bursera simaruba. Journal of Chemical Ecology 36(10): p.1122–1131.
18. Wagacha JM, Muthomi JW (2007) Fusarium culmorum: Infection process, mechanisms of mycotoxin production and their role in pathogenesis in wheat. Crop Protection 26(7): p.877–885.
19. Lanoue A, Burlat V, Henkes GJ, Koch I, Schurr U, et al. (2010) De novo biosynthesis of defense root exudates in response to Fusarium attack in barley. New Phytologist 185(2): p.577–588.
20. Vandendool H, Kratz PD (1963) A generalization of the retention index system including linear temperature programmed gas-liquid partition chromatography J Chromatogr 11: p.463–71.
21. Dunnett CW (1964) New Tables for Multiple Comparisons with a Control. Biometrics 20(3): p.482–491.
22. Zadoks JC, Chang TT, Konzak CF (1974) Decimal code for growth stages of cereals. Weed Research 14(6): p.415–421.
23. Effmert U, Kaldera´s J, Warnke R, Piechulla B (2012) Volatile Mediated Interactions Between Bacteria and Fungi in the Soil. Journal of Chemical Ecology 38(6): p.665–703.
24. Schnu¨rer J, Olsson J, Bo¨rjesson T (1999) Fungal volatiles as indicators of food and feeds spoilage. Fungal Genetics and Biology 27(2–3): p.209–217. 25. Matysik S, Herbarth O, Mueller A (2009) Determination of microbial volatile
organic compounds (MVOCs) by passive sampling onto charcoal sorbents. Chemosphere 76(1): p.114–119.
26. Jurjevic Z, Rains GC, Wilson DM, Lewis WJ (2008) Volatile metabolites associated with one aflatoxigenic and one nontoxigenic Aspergillus flavus strain grown on two different substrates. Phytopathologia Mediterranea 47(3): p.266– 271.
27. Karimi S (2001) A formal total synthesis of racemic sesquiterpenoid sativene. Journal of Natural Products 64(4): p.406–410.
28. Rose LJ, Simmons RB, Crow SA, Ahearn DG (2000) Volatile organic compounds associated with microbial growth in automobile air conditioning systems. Current Microbiology 41(3): p.206–209.
29. Claeson AS, Sandstro¨m M, Sunesson AL (2007) Volatile organic compounds (VOCs) emitted from materials collected from buildings affected by microor-ganisms. Journal of Environmental Monitoring 9(3): p.240–245.
30. Blom D, Fabbri C, Connor EC, Schiestl FP, Klauser DR, et al. (2011) Production of plant growth modulating volatiles is widespread among rhizosphere bacteria and strongly depends on culture conditions. Environmental Microbiology 13(11): p.3047–3058.
31. Piesik D, Pan´ka D, Delaney KJ, Skoczek A, Lamparski R, et al. (2011) Cereal crop volatile organic compound induction after mechanical injury, beetle herbivory (Oulema spp.), or fungal infection (Fusarium spp.). Journal of Plant Physiology 168(9): p.878–886.
32. Wenda-Piesik A, Piesik D, Ligor T, Buszewski B (2010) Volatile organic compounds (VOCs) from cereal plants infested with crown rot: their identity and their capacity for inducing production of VOCs in uninfested plants. International Journal of Pest Management 56(4): p.377–383.
33. Mellon JE, West CA (1979) Diterpene Biosynthesis in Maize Seedlings in Response to Fungal Infection. Plant Physiology 64: p.406–410.
34. Schmelz EA, Kaplan F, Huffaker A, Dafoe NJ, Vaughan MM, et al. (2011) Identity, regulation, and activity of inducible diterpenoid phytoalexins in maize. Proceedings of the National Academy of Sciences of the United States of America 108(13): p.5455–5460.
35. Pichersky E, Gershenzon J (2002) The formation and function of plant volatiles: Perfumes for pollinator attraction and defense. Current Opinion in Plant Biology 5(3): p.237–243.
36. Wheatley RE (2002) The consequences of volatile organic compound mediated bacterial and fungal interactions. Antonie van Leeuwenhoek, International Journal of General and Molecular Microbiology 81(1–4): p.357–364. 37. Hiltpold I, Erb M, Robert CA, Turlings TC (2011) Systemic root signalling in a
belowground, volatile-mediated tritrophic interaction. Plant, Cell and Environ-ment 34(5): p.1–9.
38. Semighini CP, Murray N, Harris SD (2008) Inhibition of Fusarium graminearum growth and development by farnesol. FEMS Microbiology Letters 279(2): p.259–264.
39. Piers E, Isenring HP (1976) Total synthesis of ylango sesquiterpenoids: (+)-cis-and (+)-trans-sativenediol, (+)-helminthosporal, (+)-helminthospsrol, prehel-minthosporal, prehelminthosporal diethyl acetal, (+)-victoxinine, (+)-isosativene-diol. Canadian Journal of Chemistry 55: p.1039–144.
40. Lodewyk MW, Gutta P, Tantillo DJ (2008) Computational studies on biosynthetic carbocation rearrangements leading to sativene, cyclosativene, a-ylangene, and b-ylangene. Journal of Organic Chemistry 73(17): p.6570–6579. 41. Barbosa LCA, Nogueira LB, A´ lvares Maltha CR, Teixeira RR, Silva AA (2009) Synthesis and phytogrowth properties of oxabicyclic analogues related to helminthosporin. Molecules 14(1): p.160–173.
42. Okuda M, Kato J, Tamura S (1966) Effects of helminthosporol and helminthosporic acid on activation of a-amylase production in barley endosperm. Planta 72(3): p.289–291.
43. Desjardins AE, Hohn TM, McCormick SP (1993) Trichothecene biosynthesis in Fusarium species: Chemistry, genetics, and significance. Microbiological Reviews 57(3): p.595–604.
44. Jelen´ H, Latus-Zie˛tkiewicz D, Wa˛sowicz E, Kamin´ski E (1997) Trichodiene as a volatile marker for trichothecenes biosynthesis. Journal of Microbiological Methods 31(1–2): p.45–49.
45. Garbeva P, Hol WHG, Termorshuizen AJ, Kowalchuk GA, de Boer W (2011) Fungistasis and general soil biostasis - A new synthesis. Soil Biology and Biochemistry 43(3): p.469–477.
46. Maeztu L, Sanz C, Andueza S, De Pen˜a MP, Bello J, et al. (2001) Characterization of espresso coffee aroma by static headspace GC-MS and sensory flavor profile. Journal of Agricultural and Food Chemistry 49(11): p.5437–5444.
47. Varming C, Petersen MA, Poll L (2004) Comparison of Isolation Methods for the Determination of Important Aroma Compounds in Black Currant (Ribes nigrum L.) Juice, Using Nasal Impact Frequency Profiling. Journal of Agricultural and Food Chemistry 52(6): p.1647–1652.
48. Choi HS (2003) Character impact odorants of Citrus Hallabong [(C. unshiu Marcov x C. sinensis Osbeck) x C. reticulata Blanco] cold-pressed peel oil. Journal of Agricultural and Food Chemistry 51(9): p.2687–2692.
49. Bianchi F, Careri M, Mangia A, Musci M (2007) Retention indices in the analysis of food aroma volatile compounds in temperature-programmed gas chromatography: Database creation and evaluation of precision and robustness. Journal of Separation Science 30(4): p.563–572.
50. Berger RG, Drawert F, Kollmannsberger H (1989) The flavour of cape gooseberry (Physalis peruviana L.). Zeitschrift fu¨r Lebensmittel-Untersuchung und -Forschung 188(2): p.122–126.
51. Rychlik M, Schieberle P, Grosch W (1998) Compilation of odour thresholds, odour qualities and retention indices of key food odorants: Deutsche Forschungsanstalt fu¨r Lebensmittelchemie and Institut fu¨r Lebensmittelchemie der Technischen Universita¨t Mu¨nchen. 63.
52. Sanz C, Ansorena D, Bello J, Cid C (2001) Optimizing headspace temperature and time sampling for identification of volatile compounds in ground roasted Arabica coffee. Journal of Agricultural and Food Chemistry 49(3): p.1364–1369. 53. Umano K, Hagi Y, Shibamoto T (2002) Volatile chemicals identified in extracts from newly hybrid citrus, dekopon (Shiranuhi mandarin Suppl. J.). Journal of Agricultural and Food Chemistry 50(19): p.5355–5359.
54. Pennarun AL, Prost C, Demaimay M (2002) Identification and origin of the character-impact compounds of raw oyster Crassostrea gigas. Journal of the Science of Food and Agriculture 82(14): p.1652–1660.
55. Ferreira V, Aznar M, Lo´pez R, Cacho J (2001) Quantitative gas chromatog-raphy-olfactometry carried out at different dilutions of an extract. Key differences in the odor profiles of four high-quality spanish aged red wines. Journal of Agricultural and Food Chemistry 49(10): p.4818–4824.
56. Fukami K, Ishiyama S, Yaguramaki H, Masuzawa T, Nabeta Y, et al. (2002) Identification of distinctive volatile compounds in fish sauce. Journal of Agricultural and Food Chemistry 50(19): p.5412–5416.
57. Ho¨gnado´ttir A´ , Rouseff RL (2003) Identification of aroma active compounds in orange essence oil using gas chromatography-olfactometry and gas chromatog-raphy-mass spectrometry. Journal of Chromatography A 998(1–2): p.201–211. 58. Chung TY, Eiserich JP, Shibamoto T (1993) Volatile compounds isolated from
edible Korean chamchwi (Aster scaber Thunb). Journal of Agricultural and Food Chemistry 41(10): p.1693–1697.
59. Carrapiso AI, Jurado A, Timo´n ML, Garcı´a C (2002) Odor-active compounds of Iberian hams with different aroma characteristics. Journal of Agricultural and Food Chemistry 50(22): p.6453–6458.
60. Ulrich D, Hoberg E, Rapp A, Kecke S (1997) Analysis of strawberry flavour -Discrimination of aroma types by quantification of volatile compounds. Zeitschrift fur Lebensmittel -Untersuchung und -Forschung 205(3): p.218–223. 61. Umano K, Hagi Y, Nakahara K, Shoji A, Shibamoto T (2000) Volatile chemicals identified in extracts from leaves of Japanese mugwort (Artemisia princeps Pamp.). Journal of Agricultural and Food Chemistry 48(8): p.3463–3469. 62. Jennings W, Shibamoto T (1980) Qualitative Analysis of Flavor and Fragrance Volatiles by Glass Capillary Gas Chromatography: Academic Press, New York, London, Sydney, Toronto, San Francisco 465.
63. Fischer KH, Grosch W (1987) Lebensmittel-Wissenschaft und-Technologie(20): p.233–236.
64. Mahmood U, Kaul VK, Acharya R (2004) Volatile constituents of Capillipe-dium parviflorum. Phytochemistry 65(14): p.2163–2166.
65. Ruther J (2000) Retention index database for identification of general green leaf volatiles in plants by coupled capillary gas chromatography-mass spectrometry. Journal of Chromatography A 890(2): p.313–319.
66. Valim MF, Rouseff RL, Lin J (2003) Gas chromatographic-olfactometric characterization of aroma compounds in two types of cashew apple nectar. Journal of Agricultural and Food Chemistry 51(4): p.1010–1015.
67. Priestap HA, van Baren CM, Di Leo Lira P, Coussio JD, Bandoni AL (2003) Volatile constituents of Aristolochia argentina. Phytochemistry 63(2): p.221–225. 68. Pı´ry J, Pribela A, Durcanska J, Farkas P (1995) Fractionation of volatiles from
blackcurrant (Ribes nigrum L.) by different extractive methods. Food Chemistry 54(1): p.73–77.
69. Wong JM, Bernhard RA (1988) Effect of nitrogen source on pyrazine formation. Journal of Agricultural and Food Chemistry 36(1): p.123–129.
70. Cavalli JF, Tomi F, Bernardini A-F, Casanova J (2003) Composition and chemical variability of the bark oil of Cedrelopsis grevei H. Baillon from Madagascar. Flavour and Fragrance Journal 18(6): p.532–538.
71. Davies NW (1990) Gas chromatographic retention indices of monoterpenes and sesquiterpenes on methyl silicone and Carbowax 20M phases. Journal of Chromatography 503: p.1–24.
72. Cullere´ L, Escudero A, Cacho J, Ferreira V (2004)Gas Chromatography-Olfactometry and Chemical Quantitative Study of the Aroma of Six Premium