READ THESE TERMS AND CONDITIONS CAREFULLY BEFORE USING THIS WEBSITE.
https://nrc-publications.canada.ca/eng/copyright
Vous avez des questions? Nous pouvons vous aider. Pour communiquer directement avec un auteur, consultez la première page de la revue dans laquelle son article a été publié afin de trouver ses coordonnées. Si vous n’arrivez pas à les repérer, communiquez avec nous à [email protected].
Questions? Contact the NRC Publications Archive team at
[email protected]. If you wish to email the authors directly, please see the first page of the publication for their contact information.
Archives des publications du CNRC
This publication could be one of several versions: author’s original, accepted manuscript or the publisher’s version. / La version de cette publication peut être l’une des suivantes : la version prépublication de l’auteur, la version acceptée du manuscrit ou la version de l’éditeur.
Access and use of this website and the material on it are subject to the Terms and Conditions set forth at
Field-performance of daylight-linked lighting controls and window
blinds: a pilot study
Galasiu, A. D.; Atif, M. R.
https://publications-cnrc.canada.ca/fra/droits
L’accès à ce site Web et l’utilisation de son contenu sont assujettis aux conditions présentées dans le site LISEZ CES CONDITIONS ATTENTIVEMENT AVANT D’UTILISER CE SITE WEB.
NRC Publications Record / Notice d'Archives des publications de CNRC:
https://nrc-publications.canada.ca/eng/view/object/?id=1e1d32c7-c600-4a34-a31d-92b6ace00871 https://publications-cnrc.canada.ca/fra/voir/objet/?id=1e1d32c7-c600-4a34-a31d-92b6ace00871Field-performance of daylight-linked lighting controls
and window blinds: a pilot study
Galasiu, A.D.; Atif, M.R.
A version of this document is published in / Une version de ce document se trouve dans :
5th European Conference on Energy-Efficient Lighting - Right Light 5 Proceedings, Nice,
France, May 29-31, 2002, p. 1-14
www.nrc.ca/irc/ircpubs
FIELD-PERFORMANCE OF DAYLIGHT-LINKED LIGHTING
CONTROLS AND WINDOW BLINDS: A PILOT STUDY
Anca D. Galasiu
National Research Council Canada Institute for Research in Construction Indoor Environment Program
M24, 1200 Montreal Road Ottawa, Ontario
Canada, K1A 0R6
Email: [email protected] Morad R. Atif
National Research Council Canada Institute for Research in Construction Indoor Environment Program
M24, 1200 Montreal Road Ottawa, Ontario
Canada, K1A 0R6 Email: [email protected]
KEYWORDS:
daylighting, lighting controls, window blinds, lighting, energy savings, dimming, automatic on/off, office buildings, monitoring, measured performance, daylight-linked control systems, photocontrolled lighting.
ABSTRACT
This paper presents the monitoring results of a field experiment conducted over the course of one year in two side-by-side occupied offices to investigate the impact of various configurations of manually-operated venetian blinds on the performance of a commercial photocontrolled continuous dimming lighting control system. The performance indicators considered were the electric energy consumption and the space illumination as a function of blind slat angle and retraction area. The results showed that under clear sky and with no blinds the lighting control system reduced the lighting consumption on average by 50 to 60% when compared to lights fully on from 6 AM to 6 PM. These savings were however, reduced by 5 to 45% based on the window blinds’ configuration tested. The impact of the blinds on the lighting consumption depended greatly on the variability of daylight levels and the sky condition and did not vary significantly from one season to another.
INTRODUCTION
Literature suggests that daylight-linked lighting control systems installed in office buildings have rarely achieved the savings predicted by previous research, which anticipated savings of over 50% in electrical lighting consumption. In Canada, these systems seemed theoretically capable of generating significant energy savings due to the high sunshine and daylight availability. However, technical and subjective issues prevented these systems to reach optimum performance. The lack of effective calibration taking into consideration the window shading devices and the user acceptance were identified as being among the most conspicuous. As a result, a research project was initiated to address both of these aspects and to identify the limitations and problems associated with the daylighting technology used.
As a first phase of the research, this pilot study addresses the aspect of window shading and its impact on lighting control systems. In office buildings, indoor venetian blinds reduce the daylight
admitted into the space and the amount of light “seen” by the photosensors controlling the lighting systems, which triggers an increase in lighting energy use. In this field experiment, the space illumination and the lighting energy consumption of a common, commercially available, continuous dimming lighting control system was evaluated as a function of blind angle and retraction area. The data collected provides an estimate of the impact that window blinds may have on the performance of photocontrolled lighting systems and represents a first step towards guidelines for proper installation, calibration and operation of this type of systems in real-world applications.
TEST-SITE DESCRIPTION
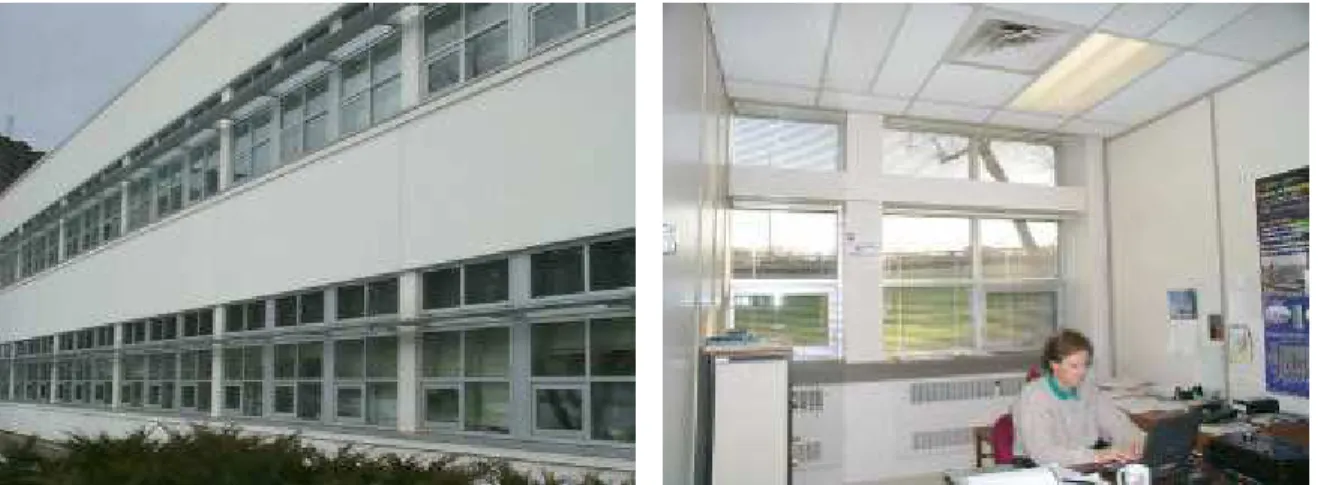
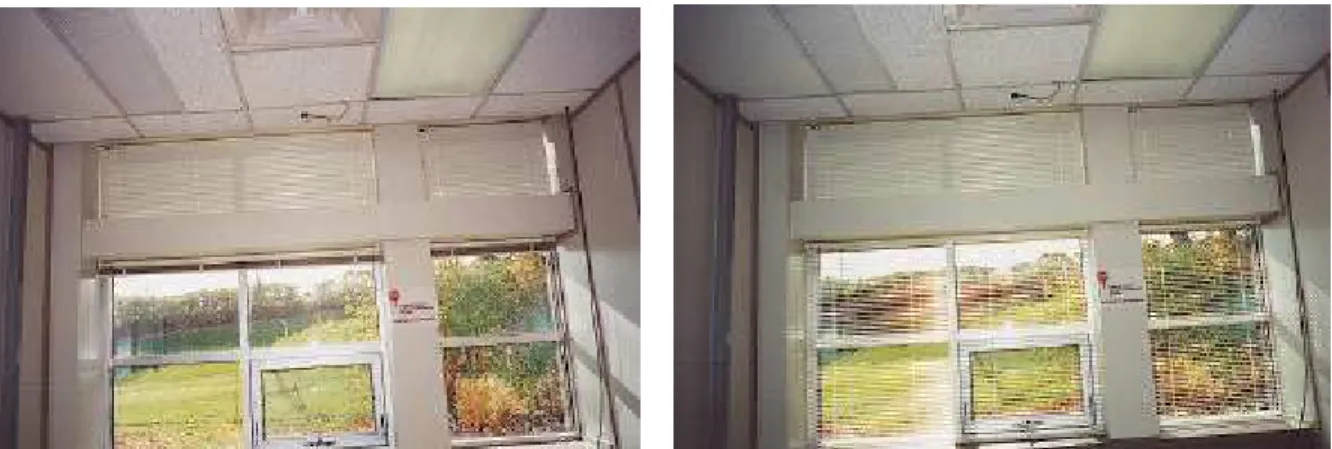
The experimental site consisted of two real side-by-side, south-facing, private offices of a research facility located in Ottawa, Canada. Figures 1 and 2 show an exterior and an interior view of a typical office space. The offices are facing a small hill on the south side, which is covered by green grass for about 8 months a year, and by clean snow during the remaining months. Each office has a floor area
of 14 m2 and a height of 3 m and is occupied during weekdays from 8 AM to 5 PM.
The fenestration system in each office incorporates six double glazed, low-E, “view” window panes and three double glazed, low-E, “clerestory” window panes placed high in the walls to allow for deep daylight penetration. The overall opening of each window pane is 0.9 x 0.6 m. The “view” windows are clear and have a visible transmittance of 75%. The “clerestory” windows are gray-tinted and have a visible transmittance of 36%. On the exterior façade, the “view” windows are separated from the “clerestory” windows by a continuous highly-reflective aluminum light-shelf. The daylight penetration into the offices is also increased by an interior white-colored window mullion, 0.40 m deep, which acts as an interior light-shelf. All windows have aluminum frames and are equipped with white-colored, manually-operated, aluminum venetian blinds.
Ambient lighting is provided in each office by two energy efficient recessed fluorescent lighting fixtures. Each fixture incorporates two, 32-watt, T8 fluorescent lamps. The average lighting power
density in each office is about 9 W/m2 and the average space illuminance measured on the workplane
at night under full electric lighting is 570 lux. The lighting fixtures in each office are controlled from a light photosensor located in the ceiling at a distance of 0.60 m from the upper window pane. The photosensor ensures an open-loop feedback to the lighting controller, which according to the
manufacturer has a dimming range between 100% to 1% illuminance level (100% to 8% power level). The walls and ceilings are painted off-white and have an estimated reflectance of 70%. The floor is covered with a light-brown carpet with an estimated reflectance of 30%. All four offices are furnished with similar brown-colored furniture arranged however slightly differently in the space to
accommodate the occupants’ requirements.
METHODOLOGY
The field monitoring included the calibration and commissioning of the continuos dimming lighting control system in each office, followed by 20 monitoring sessions which addressed the impact of various static configurations of manually-operated blinds on the energy performance of the lighting control system and the space illumination. The monitoring of 10 blinds’ configurations took place over two distinctive periods of the year to account for seasonal variations.
During all tests, one office was used as a base case (reference case) to which the performance of the “modified” office (test case) was compared. Each test identified by how much each blind setting affected the energy consumption of the lighting control system. Each blinds’ configuration was monitored under clear, partly cloudy and overcast sky and had remained in each particular position for as long as needed to cover all these three sky conditions.
System calibration and benchmarking tests were conducted periodically to determine the relative deviation between each pair of rooms (test rooms versus reference rooms) resulting from instrumental error, the room’s relative position to the exterior environment, and the system
components and operation. Monitoring was conducted at night to determine the maximum light levels in the absence of daylight and to verify the similarity between the electrical lighting system of each room. Several system benchmarking tests were also conducted during daytime under clear, partly cloudy and overcast sky to determine the relative deviation between the rooms under these sky conditions. During the benchmarking tests all blinds were fully-retracted, simulating spaces without blinds in which the automatic lighting control system would provide the maximum lighting energy savings.
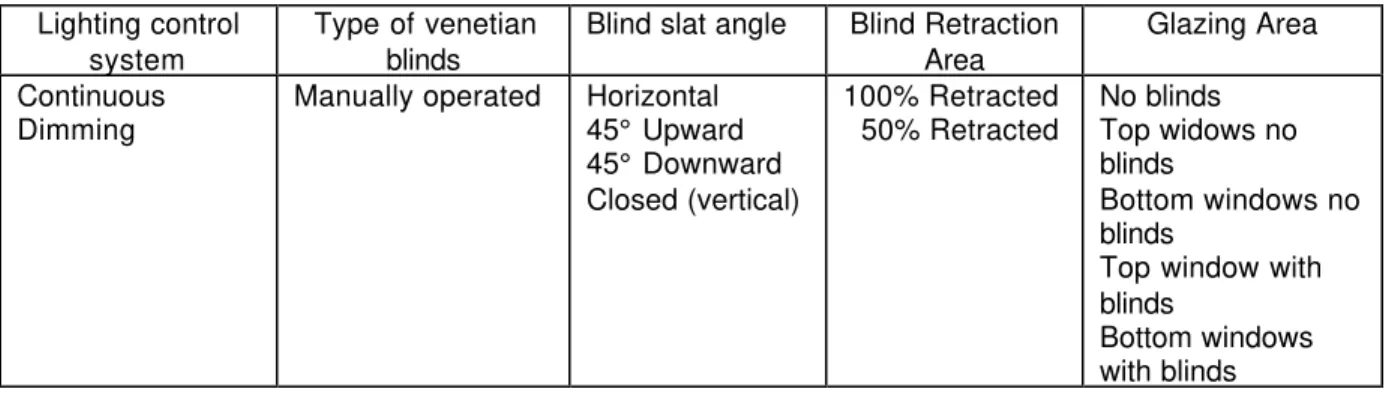
Table 1 presents a general overview of the variables tested.
Table 1 Overview of variables in the test room
Lighting control system
Type of venetian blinds
Blind slat angle Blind Retraction
Area
Glazing Area Continuous
Dimming
Manually operated Horizontal
45° Upward 45° Downward Closed (vertical) 100% Retracted 50% Retracted No blinds Top widows no blinds Bottom windows no blinds
Top window with blinds
Bottom windows with blinds
Notes:
§ Blinds horizontal means slats tilt angle 0°.
§ Blinds at 45° upward: exterior edge of the slats goes upward (means a view of the sky from the
interior).
§ Blinds at 45° downward: exterior edge of the slats goes downward (means a view of the ground
from the interior).
§ Blinds closed means slats squeezed downward to their mechanical limit.
The 10 static blinds’ configuration tested were grouped in three categories as follows:
“All blinds tests” , which had the purpose to identify the effect that various static configurations of all
four blinds in one room have on the lighting energy consumption. In all these cases, the comparison was done against the “no blinds” configuration in the reference room, while the following
configurations were present in the test room:
• all four blinds with slats horizontal;
• all four blinds tilted 45° upward;
• all four blinds tilted 45° downward;
• no top blinds, bottom blinds closed;
• no bottom blinds, top blinds closed.
“Top blinds tests” , which were designed to identify the impact of the top blinds on the performance
of the lighting control system when the bottom blinds are closed. These tests are applicable to situations when the “view” windows are covered by blinds for sunshading and glare control, and only the “clerestory” windows are used for daylight admission. During these tests, the bottom blinds in both the reference and the test rooms were closed, while the top blinds were either horizontal or tilted 45° downward in the test room, and fully retracted in the reference room.
“Bottom blinds tests” , which were designed to identify the impact of the bottom blinds on the
performance of the lighting control system when the top blinds are closed. These tests are applicable to situations without “clerestory” windows, when daylight is admitted only through the “view” windows. During these tests the top blinds in both the reference and the test rooms were closed, while the bottom blinds were either horizontal or tilted 45° downward in the test room, and fully retracted in the reference room.
MEASUREMENTS
The following parameters were measured or recorded in each room:
• horizontal indoor illuminance;
• electric lighting system power profile;
• position of the blind (angular and retraction area) .
Horizontal indoor illuminance was collected in each office at two test-points, one located at the ceiling level just beside the photosensor operating the lighting control systems and the second located on the desktop (0.85 m from the floor, and 2.75 m from the windows). The measured illuminance represents the total illuminance resulting from electric lighting and daylighting. Based on the measured data, the daylight illuminance was calculated in the dimming offices by subtracting from the total measured illuminance, the illuminance from electric lighting, calculated based on the measured dimming percentage and assuming a linear correlation between the lighting power consumption and the resulting illuminance.
The dimming percentage of the electrical lighting system was monitored by a data acquisition system installed at the breaker panel serving the lighting circuits. The power demand profile was monitored independently for each office, and the daily lighting energy consumption was calculated for 12-hour intervals, from 6 AM to 6 PM. The angular position of the blinds (tilt angle) and retraction area were monitored along with the space illuminance and the electrical lighting power consumption. The sky condition was also continuously recorded during the monitoring period and was characterized subjectively by the experimenters as either clear sky with sun (less than 30% cloud cover), partly cloudy sky (between 30-70% cloud cover) and overcast sky (over 70% cloud cover).
RESULTS
Benchmarking of the Test and Reference Rooms
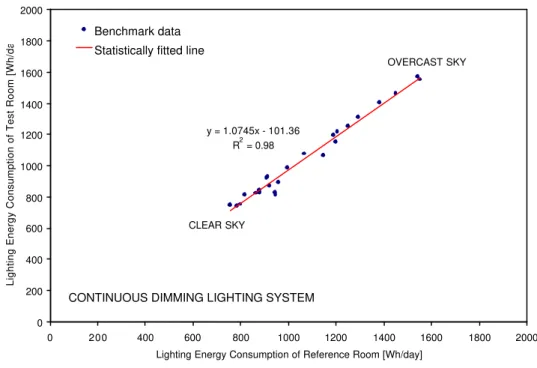
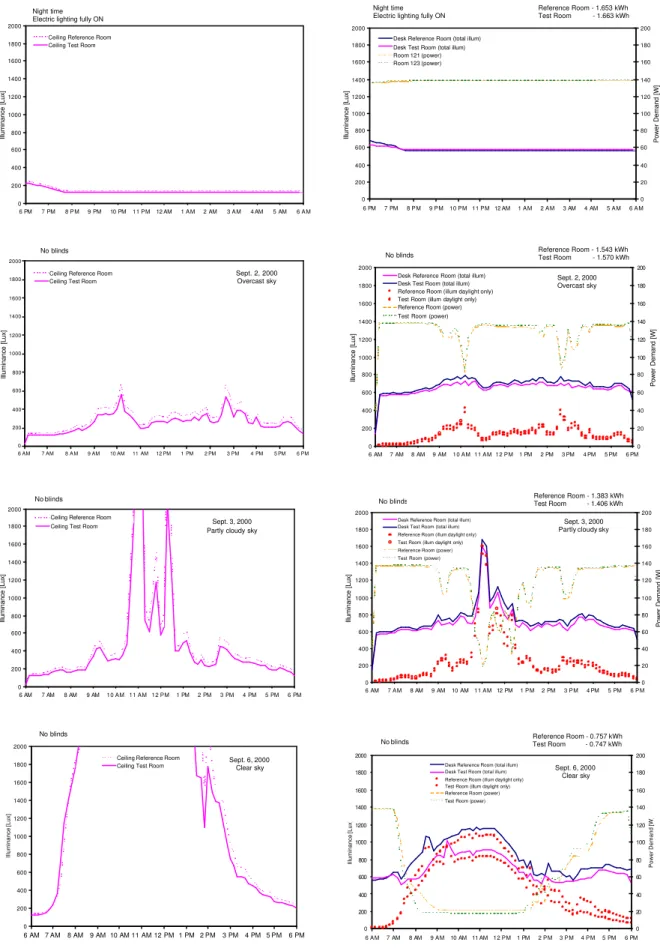
Figure 3 shows the overall benchmarking results of the test room versus the reference room in the “no blinds” configuration. Figure 4 shows examples of the measured power demand profile of the lighting systems installed in these two rooms at night and under various sky conditions during daytime. The measured illuminance distribution at the ceiling and desktop levels, the lighting energy consumption from 6 AM to 6 PM, and the calculated daylight illuminance are also shown.
Results indicate that the offset in daily lighting energy consumption between the two rooms was on average about 4% under clear and partly cloudy sky, and 2% under overcast sky regardless of the season. Since this offset was associated with the rooms relative position to the exterior environment and the system components and operation, it became part of the benchmarking in all the subsequent calculations.
y = 1.0745x - 101.36 R2 = 0.98 0 200 400 600 800 1000 1200 1400 1600 1800 2000 0 200 400 600 800 1000 1200 1400 1600 1800 2000
Lighting Energy Consumption of Reference Room [Wh/day]
Lighting Energy Consumption of Test Room [Wh/day]
Benchmark data Statistically fitted line
CONTINUOUS DIMMING LIGHTING SYSTEM
CLEAR SKY
OVERCAST SKY
Figure 3 Benchmarking of the test room versus the reference room incorporating
continuous dimming lighting (Note: daily lighting energy consumption calculated over a 12-hour time frame, from 6 AM to 6 PM).
0 200 400 600 800 1000 1200 1400 1600 1800 2000 6 PM 7 PM 8 PM 9 PM 10 PM 11 PM12 AM 1 AM 2 AM 3 AM 4 AM 5 AM 6 AM Illuminance [Lux]
Ceiling Reference Room Ceiling Test Room
Night time Electric lighting fully ON
0 200 400 600 800 1000 1200 1400 1600 1800 2000 6 PM 7 PM 8 PM 9 PM 10 PM 11 PM 12 AM 1 AM 2 AM 3 AM 4 AM 5 AM 6 AM Illuminance [Lux] 0 20 40 60 80 100 120 140 160 180 200 Power Demand [W]
Desk Reference Room (total illum) Desk Test Room (total illum) Room 121 (power) Room 123 (power)
Night time Electric lighting fully ON
Reference Room - 1.653 kWh Test Room - 1.663 kWh 0 200 400 600 800 1000 1200 1400 1600 1800 2000 6 AM 7 AM 8 A M 9 AM 10 AM 11 AM 12 PM 1 PM 2 PM 3 PM 4 PM 5 PM 6 PM Illuminance [Lux]
Ceiling Reference Room Ceiling Test Room
Sept. 2, 2000 Overcast sky No blinds 0 200 400 600 800 1000 1200 1400 1600 1800 2000 6 AM 7 AM 8 AM 9 AM 10 AM 11 AM 12 PM 1 PM 2 PM 3 PM 4 PM 5 PM 6 PM Illuminance [Lux] 0 20 40 60 80 100 120 140 160 180 200 Power Demand [W]
Desk Reference Room (total illum) Desk Test Room (total illum) Reference Room (illum daylight only) Test Room (illum daylight only) Reference Room (power) Test Room (power)
Sept. 2, 2000 Overcast sky Reference Room - 1.543 kWh Test Room - 1.570 kWh No blinds 0 200 400 600 800 1000 1200 1400 1600 1800 2000 6 AM 7 AM 8 AM 9 AM 10 AM 11 AM 12 PM 1 PM 2 PM 3 PM 4 PM 5 PM 6 PM Illuminance [Lux]
Ceiling Reference Room Ceiling Test Room
No blinds
Sept. 3, 2000 Partly cloudy sky
0 200 400 600 800 1000 1200 1400 1600 1800 2000 6 AM 7 AM 8 AM 9 AM 10 AM 11 AM 12 PM 1 PM 2 PM 3 PM 4 PM 5 PM 6 PM Illuminance [Lux] 0 20 40 60 80 100 120 140 160 180 200 Power Demand [W]
Desk Reference Room (total illum) Desk Test Room (total illum) Reference Room (illum daylight only) Test Room (illum daylight only) Reference Room (power) Test Room (power)
Reference Room - 1.383 kWh Test Room - 1.406 kWh
Sept. 3, 2000 Partly cloudy sky No blinds 0 200 400 600 800 1000 1200 1400 1600 1800 2000 6 AM 7 AM 8 AM 9 AM 10 AM 11 AM 12 PM 1 PM 2 PM 3 PM 4 PM 5 PM 6 PM Illuminance [Lux]
Ceiling Reference Room Ceiling Test Room
Sept. 6, 2000 Clear sky No blinds 0 200 400 600 800 1000 1200 1400 1600 1800 2000 6 AM 7 AM 8 AM 9 AM 10 AM 11 AM 12 PM 1 PM 2 PM 3 PM 4 PM 5 PM 6 PM Illuminance [Lux] 0 20 40 60 80 100 120 140 160 180 200 Power Demand [W]
Desk Reference Room (total illum) Desk Test Room (total illum) Reference Room (illum daylight only) Test Room (illum daylight only) Reference Room (power) Test Room (power)
Sept. 6, 2000 Clear sky Reference Room - 0.757 kWh Test Room - 0.747 kWh No blinds
Figure 4 Examples of measured power demand profiles of the continuous dimming lighting system and illuminance distribution in the test and reference rooms under various sky conditions.
Performance with Static Venetian Blinds “All blinds” tests
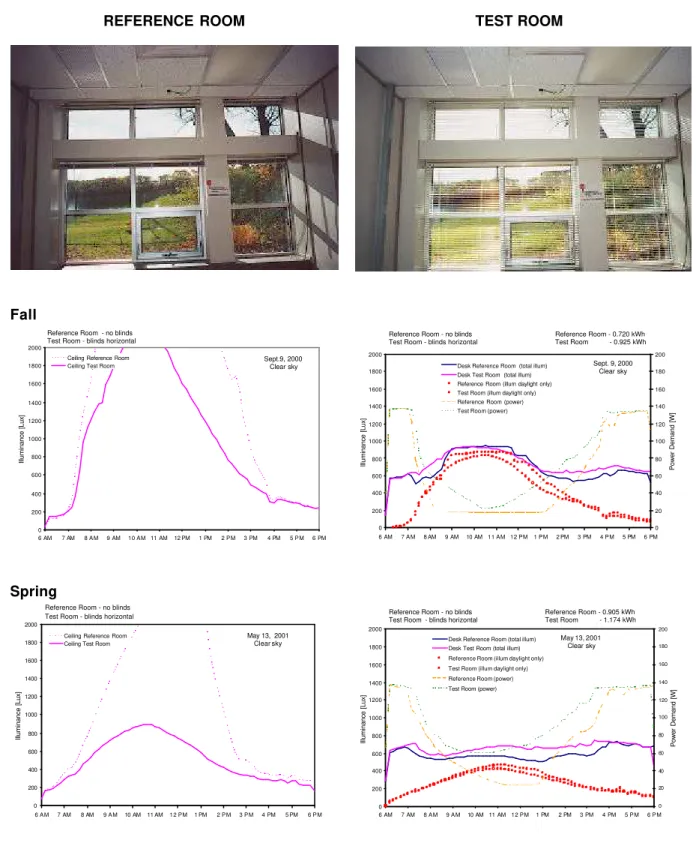
Figures 5 to 8 show examples of the power profiles of the continuous dimming lighting control system and the illuminance distribution at the ceiling and workplane levels for some of the configurations tested.
Figure 5 shows a comparison between the illuminance and the power demand profiles for the “no blinds” and the “blinds horizontal” configurations tested in September 2000 and May 2001. Data shows that during both seasons under clear sky, the blinds positioned with their slats horizontal reduced the illuminance at the ceiling photosensor on average by 30 to 50% for about 8 hours during the time interval considered (6 AM to 6 PM). This in turn increased the lighting consumption of the test room by about 30%. On the desktop, the average difference between the calculated daylight illuminance in the test room versus the reference room was about 10% in both spring and fall. The desktop illuminance from daylighting was in both rooms below 500 lux in the spring, and above 500 lux in the fall for about 5.5 hours a day. Under a clear sky, the daily lighting consumption in both rooms was about 20 to 25% higher in May than in September.
A similar comparison between the “no blinds” and the “blinds at 45° upward” configurations showed that under clear sky, the blinds positioned with the slats at a 45° upward angle (view of the sky from the interior) reduced the total illuminance at the ceiling photosensor on average by 45 to 60% in September 2000 and May 2001 for about 8 to 10 hours a day. The daylight availability on the desktop was reduced by about 30% in the fall, but was not substantially affected in the spring by this particular blind setting (about 10% difference between the test and the reference room). In both rooms, the daylight illuminance was always below 500 lux in the spring. In the fall, the daylight illuminance in the reference room was above 500 lux for about 3 hours longer than in the test room. Due to the presence of the blinds, the daily lighting energy consumption increased in the test room by 35 to 45% compared to the reference rooms. In both rooms the daily lighting consumption under a clear sky was about 30 to 35% lower in September than in May.
The comparison between the “no blinds” and the “blinds at 45° downward” configurations showed that under a clear sky in September 2000 and May 2001, the blinds positioned with the slats at a 45° downward angle (view of the ground from the interior) reduced the total illuminance at the ceiling photosensor on average by 40 to 45% compared to the illuminance measured in the reference room for 7 hours in the spring, and 10 hours in the fall. The daylight availability on the desktop was reduced by about 40% in the fall and by 15% in the spring. In both rooms, the daylight illuminance was mainly below 300 lux in the spring. In the fall, the daylight illuminance in the reference room was above 500 lux for about 4 hours longer than in the test room. Due to the presence of the blinds, the daily lighting energy consumption increased in the test room by 25 to 30%. As mentioned before, in this case too the daily lighting consumption in both rooms was about 20 to 30% higher in May than September under a clear sky.
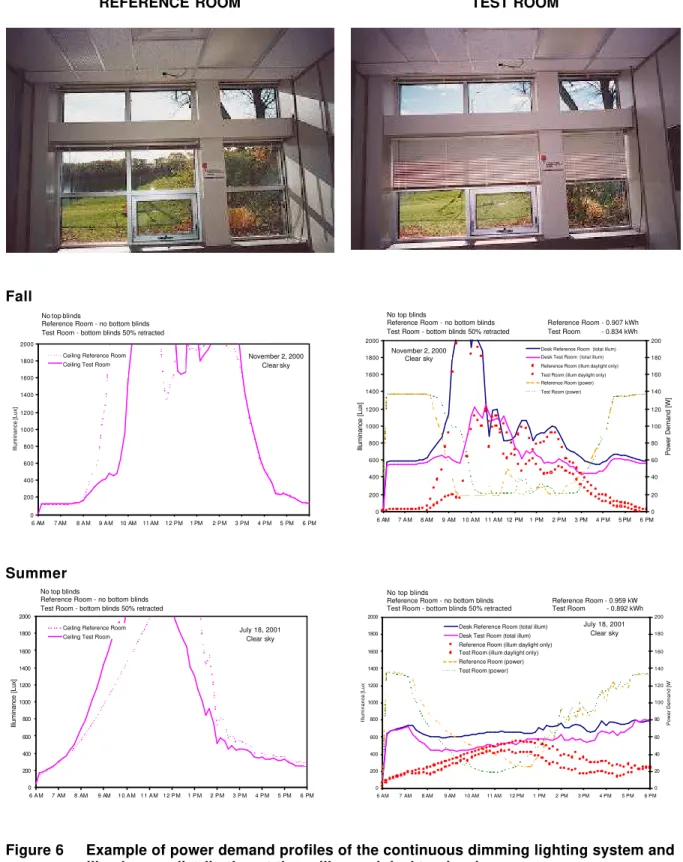
Figure 6 shows a comparison between the “no blinds” versus “bottom blinds half-way closed” configurations under a clear sky in November 2000 and July 2001. The illuminance at the ceiling photosensor was not affected significantly by this blind setting in the fall, when the difference between the instantaneous illuminance levels has been caused only by a short time lag due to the rooms’ relative position towards the exterior and the sun position during morning hours. In the summer, however, the illuminance at the ceiling photosensor was reduced on average by 25%. In the fall, the daylight illuminance on the desktop was above 500 lux for about one hour longer in the reference room than in the test room and the desktop daylight illuminance was reduced by 20%. In both rooms, the daylight illuminance was mostly below 500 lux in the summer. The daily lighting energy
consumption of the test room was not affected substantially by the blinds covering half of the bottom windows, and the difference between the two rooms was lower than 10% during both fall and
summer. In both rooms, the daily lighting consumption under clear sky was about 10% higher in July compared to November.
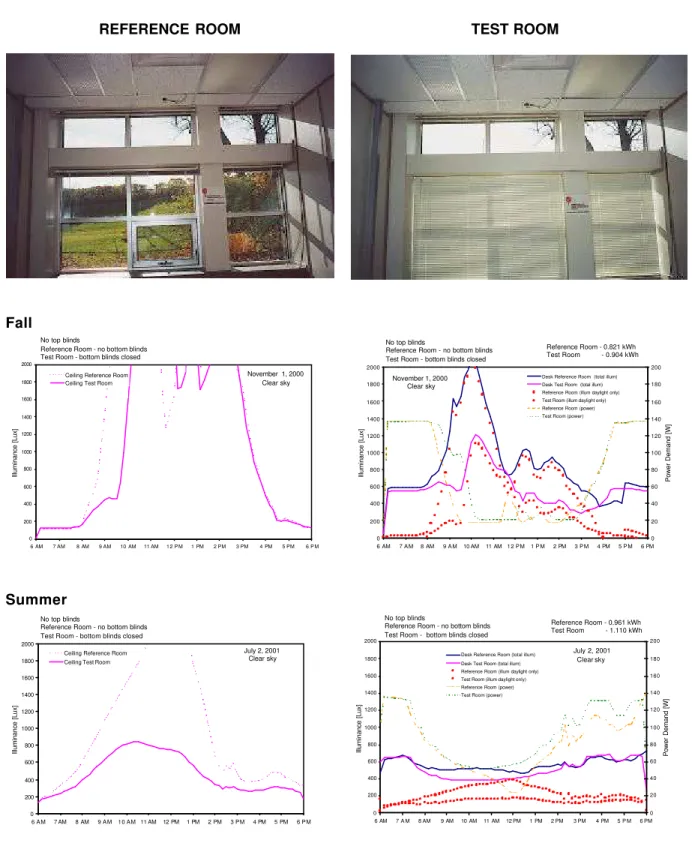
Figure 7 shows a comparison between the “no blinds” versus “bottom blinds closed””
configurations under a clear sky in November 2000 and July 2001. Closing the bottom blinds did not affect the ceiling illuminance in the fall, but it did affect it significantly in the summer, when for about 7.5 hours the illuminance in the test room was reduced to 50% of the illuminance measured in the reference room. This increased the lighting energy consumption by about 15% in the test room compared to the reference room. In the fall, the difference between the two rooms was about 10%. During both seasons, the daylight availability on the desktop in the test room was affected by the bottom windows being totally covered and the daylight illuminance was reduced on average by 30-35% compared to the illuminance measured in the reference room. In the fall, the daylight illuminance was above 500 lux in the reference room for about 4 hours longer than in the test room. In both rooms the daylight illuminance was lower than 500 lux in the spring. In both rooms, the daily lighting consumption under clear sky was about 20% higher in July compared to November.
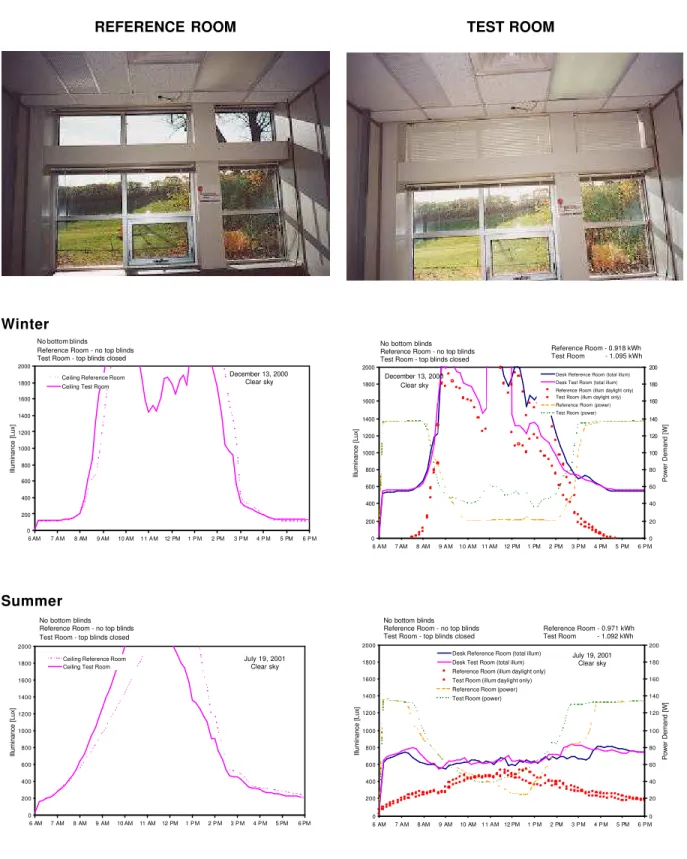
Figure 8 shows a comparison between the “no blinds” versus “top blinds closed” configurations under a clear sky in December 2000 and July 2001. In the winter, closing the top blinds reduced the ceiling illuminance by about 30% for 5 hours a day, which in turn increased the lighting consumption in the test room by about 20%. Daylight availability on the desktop was not significantly affected by the top blinds being closed in the test room, and the illuminance was above 500 lux for 6 hours a day in both rooms. This shows that the lighting system in the test room could not relate effectively to the fact that on the workplane the daylight illuminance was much above the design illuminance. Not being able to dim down to its base level due to the low level of light “seen” by the control photosensor, the lighting consumption increased needlessly. In the summer, the daylight illuminance on the desktop was always below 500 lux and the difference in lighting consumption between the two rooms was about 15%. At both the ceiling photosensor and on the desktop the daylight availability was reduced on average by 20 to 25% by the top blinds being closed. During this test, there was no significant difference in daily lighting consumption of the two rooms under clear sky in December compared to July.
“Top blinds” tests
These tests were conducted in October and December 2000, and June 2001 and showed if there was any considerable effect on the lighting energy consumption from the top blinds being configured in various positions when the bottom windows were completely covered. The tests conducted in November 2000 and July 2001 showed that covering the bottom windows completely and leaving the top windows uncovered under a clear sky increased the daily lighting consumption by about 10 to 15% compared to the reference case with no blinds. Once the bottom blinds were closed in both rooms, if the top windows were completely unobstructed or had horizontal blinds did not make a significant difference and the lighting consumption increased by maximum 5% in the December, and by about 15% June. When the top blinds were positioned at a 45° downward angle there was an increase in lighting energy consumption of about 10% in June, and 20% in October. During all these tests, the daily lighting consumption under a clear sky was between 5 to 25% higher in June
compared to October and December.
“Bottom blinds” tests
These tests were conducted in October 2000 and June 2001 and are the reverse of the tests just presented above. They showed the effect on the lighting energy consumption from setting the bottom blinds in various positions while the top windows were completely covered. For example, Figure 9 shows the power demand profile and illuminance distribution at the ceiling and workplane levels for the configuration “bottom blinds horizontal” versus “no blinds”, when the top blinds are closed in both rooms. Previous tests conducted in December 2000 and July 2001 showed that regardless of season, covering the top windows completely and leaving the bottom windows uncovered under a clear sky increased the lighting consumption by about 15 to 20% compared to the reference case with no blinds. Once the top blinds were closed in both rooms, if the bottom windows had horizontal blinds or the blinds were tilted at 45° downward made a significant difference only in the summer when the lighting consumption increased by about 30%. This effect was not evident in the fall, when the difference in lighting consumption between the two rooms was less then 5%. The daily lighting consumption was not significantly different in the reference room in October compared to June.
However, in the test room, the daily lighting consumption was about 30% higher in June compared to October, when the bottom windows were covered with blinds with slats horizontal or tilted at 45° downward.
Figures 10 and 11 show trendlines of the daily lighting energy consumption from 6 AM to 6 PM for all the blinds’ configurations tested. Overall, data shows that depending on their setting, the presence of window blinds under a clear sky increased the daily lighting consumption in the test room somewhere between 5 to 45% compared to the “no blinds” scenario in the reference room. For the particular location of the lighting control photosensor used in this experiment, the correlation between the lighting consumption and each blinds’ configuration was found to be reasonably independent of season and mostly dependent on the sky condition. Data suggests that regardless of the season, under clear sky there is a potential benefit of about 10% in energy savings resulting from positioning the blind slats either horizontally or at a 45° downward angle compared to positioning the slats at a 45° upward angle. Even with the slats horizontal, the blinds increased the daily lighting consumption on average by 30% compared to the “no blinds” scenario.
Data also shows that especially in the fall and winter, covering the bottom windows with blinds (either half or completely) and leaving the top windows unobstructed had a lower effect on the lighting energy consumption than the reverse configuration (top windows covered and bottom windows uncovered). In the summer, however, both the “bottom blinds closed” and the “top blinds closed” configurations increased the daily lighting consumption in the test room by 15% compared to the “no blinds” reference room. With the top blinds closed, the dimming system did not reach its full savings potential even when the daylight availability on the workplane was high and at levels much above the space design illuminance.
Table 2 presents a summary of the average increase in lighting energy consumption and reduction in daylight availability measured on the workplane and at the ceiling photosensor caused by the various blinds’ configurations tested.
REFERENCE ROOM TEST ROOM Fall 0 200 400 600 800 1000 1200 1400 1600 1800 2000 6 AM 7 AM 8 AM 9 AM 10 AM 11 AM 12 PM 1 PM 2 PM 3 PM 4 PM 5 PM 6 PM Illuminance [Lux]
Ceiling Reference Room Ceiling Test Room
Reference Room - no blinds Test Room - blinds horizontal
Sept.9, 2000 Clear sky 0 200 400 600 800 1000 1200 1400 1600 1800 2000 6 AM 7 AM 8 AM 9 AM 10 AM 11 AM 12 PM 1 PM 2 PM 3 PM 4 PM 5 PM 6 PM Illuminance [Lux] 0 20 40 60 80 100 120 140 160 180 200 Power Demand [W]
Desk Reference Room (total illum) Desk Test Room (total illum) Reference Room (illum daylight only) Test Room (illum daylight only) Reference Room (power) Test Room (power)
Reference Room - 0.720 kWh Test Room - 0.925 kWh
Sept. 9, 2000 Clear sky Reference Room - no blinds
Test Room - blinds horizontal
Spring 0 200 400 600 800 1000 1200 1400 1600 1800 2000 6 AM 7 AM 8 AM 9 AM 10 AM 11 AM 12 PM 1 PM 2 PM 3 PM 4 PM 5 PM 6 PM Illuminance [Lux]
Ceiling Reference Room Ceiling Test Room
May 13, 2001 Clear sky Reference Room - no blinds
Test Room - blinds horizontal
0 200 400 600 800 1000 1200 1400 1600 1800 2000 6 AM 7 AM 8 AM 9 AM 10 AM 11 AM 12 PM 1 PM 2 PM 3 PM 4 PM 5 PM 6 PM Illuminance [Lux] 0 20 40 60 80 100 120 140 160 180 200 Power Demand [W]
Desk Reference Room (total illum) Desk Test Room (total illum) Reference Room (illum daylight only) Test Room (illum daylight only) Reference Room (power) Test Room (power)
May 13, 2001 Clear sky Reference Room - no blinds
Test Room - blinds horizontal
Reference Room - 0.905 kWh Test Room - 1.174 kWh
Figure 5 Example of power demand profiles of the continuous dimming lighting system and illuminance distribution at the ceiling and desktop levels.
REFERENCE ROOM TEST ROOM Fall 0 200 400 600 800 1000 1200 1400 1600 1800 2000 6 AM 7 AM 8 AM 9 AM 10 AM 11 AM 12 PM 1 PM 2 PM 3 PM 4 PM 5 PM 6 PM Illuminance [Lux]
Ceiling Reference Room Ceiling Test Room
November 2, 2000 Clear sky No top blinds
Reference Room - no bottom blinds Test Room - bottom blinds 50% retracted
0 200 400 600 800 1000 1200 1400 1600 1800 2000 6 AM 7 AM 8 AM 9 AM 10 AM 11 AM 12 PM 1 PM 2 PM 3 PM 4 PM 5 PM 6 PM Illuminance [Lux] 0 20 40 60 80 100 120 140 160 180 200 Power Demand [W]
Desk Reference Room (total illum) Desk Test Room (total illum) Reference Room (illum daylight only) Test Room (illum daylight only) Reference Room (power) Test Room (power)
November 2, 2000 Clear sky No top blinds
Reference Room - no bottom blinds Test Room - bottom blinds 50% retracted
Reference Room - 0.907 kWh Test Room - 0.834 kWh Summer 0 200 400 600 800 1000 1200 1400 1600 1800 2000 6 A M 7 AM 8 AM 9 AM 10 AM 11 AM 12 PM 1 P M 2 P M 3 P M 4 P M 5 PM 6 PM Illuminance [Lux]
Ceiling Reference Room Ceiling Test Room
July 18, 2001 Clear sky No top blinds
Reference Room - no bottom blinds Test Room - bottom blinds 50% retracted
0 200 400 600 800 1000 1200 1400 1600 1800 2000 6 AM 7 AM 8 AM 9 AM 10 AM 11 AM 12 PM 1 PM 2 PM 3 PM 4 PM 5 PM 6 PM Illuminance [Lux] 0 20 40 60 80 100 120 140 160 180 200 Power Demand [W]
Desk Reference Room (total illum) Desk Test Room (total illum) Reference Room (illum daylight only) Test Room (illum daylight only) Reference Room (power) Test Room (power)
No top blinds
Reference Room - no bottom blinds Test Room - bottom blinds 50% retracted
Reference Room - 0.959 kW Test Room - 0.892 kWh
July 18, 2001 Clear sky
Figure 6 Example of power demand profiles of the continuous dimming lighting system and illuminance distribution at the ceiling and desktop levels.
CONFIGURATION TESTED: No top blinds.
REFERENCE ROOM TEST ROOM Fall 0 200 400 600 800 1000 1200 1400 1600 1800 2000 6 AM 7 AM 8 AM 9 AM 10 AM 11 AM 1 2 P M 1 PM 2 PM 3 PM 4 PM 5 PM 6 P M Illuminance [Lux]
Ceiling Reference Room Ceiling Test Room
November 1, 2000 Clear sky No top blinds
Reference Room - no bottom blinds Test Room - bottom blinds closed
0 200 400 600 800 1000 1200 1400 1600 1800 2000 6 AM 7 A M 8 AM 9 A M 10 AM 11 AM 12 PM 1 P M 2 PM 3 P M 4 PM 5 P M 6 PM Illuminance [Lux] 0 20 40 60 80 100 120 140 160 180 200 Power Demand [W]
Desk Reference Room (total illum) Desk Test Room (total illum) Reference Room (illum daylight only) Test Room (illum daylight only) Reference Room (power) Test Room (power)
November 1, 2000 Clear sky No top blinds
Reference Room - no bottom blinds Test Room - bottom blinds closed
Reference Room - 0.821 kWh Test Room - 0.904 kWh Summer 0 200 400 600 800 1000 1200 1400 1600 1800 2000 6 AM 7 AM 8 AM 9 AM 10 AM 11 AM 12 PM 1 PM 2 PM 3 PM 4 PM 5 PM 6 PM Illuminance [Lux]
Ceiling Reference Room Ceiling Test Room
No top blinds
Reference Room - no bottom blinds Test Room - bottom blinds closed
July 2, 2001 Clear sky 0 200 400 600 800 1000 1200 1400 1600 1800 2000 6 AM 7 A M 8 AM 9 AM 10 AM 11 AM 12 PM 1 PM 2 PM 3 PM 4 PM 5 P M 6 PM Illuminance [Lux] 0 20 40 60 80 100 120 140 160 180 200 Power Demand [W]
Desk Reference Room (total illum) Desk Test Room (total illum) Reference Room (illum daylight only) Test Room (illum daylight only) Reference Room (power) Test Room (power)
July 2, 2001 Clear sky No top blinds
Reference Room - no bottom blinds Test Room - bottom blinds closed
Reference Room - 0.961 kWh Test Room - 1.110 kWh
Figure 7 Example of power demand profiles of the continuous dimming lighting system and illuminance distribution at the ceiling and desktop levels.
CONFIGURATION TESTED: No top blinds.
REFERENCE ROOM TEST ROOM Winter 0 200 400 600 800 1000 1200 1400 1600 1800 2000 6 AM 7 A M 8 AM 9 AM 10 AM 11 AM 12 PM 1 P M 2 PM 3 P M 4 P M 5 PM 6 P M Illuminance [Lux]
Ceiling Reference Room Ceiling Test Room
December 13, 2000 Clear sky No bottom blinds
Reference Room - no top blinds Test Room - top blinds closed
0 200 400 600 800 1000 1200 1400 1600 1800 2000 6 AM 7 AM 8 AM 9 AM 10 AM 11 AM 12 PM 1 PM 2 PM 3 PM 4 PM 5 PM 6 PM Illuminance [Lux] 0 20 40 60 80 100 120 140 160 180 200 Power Demand [W]
Desk Reference Room (total illum) Desk Test Room (total illum) Reference Room (illum daylight only) Test Room (illum daylight only) Reference Room (power) Test Room (power)
December 13, 2000 Clear sky No bottom blinds Reference Room - no top blinds Test Room - top blinds closed
Reference Room - 0.918 kWh Test Room - 1.095 kWh Summer 0 200 400 600 800 1000 1200 1400 1600 1800 2000 6 AM 7 AM 8 AM 9 AM 10 AM 11 AM 12 PM 1 P M 2 P M 3 P M 4 P M 5 PM 6 PM Illuminance [Lux]
Ceiling Reference Room Ceiling Test Room
July 19, 2001 Clear sky No bottom blinds
Reference Room - no top blinds Test Room - top blinds closed
0 200 400 600 800 1000 1200 1400 1600 1800 2000 6 AM 7 A M 8 AM 9 AM 10 AM 11 AM 12 PM 1 P M 2 PM 3 P M 4 P M 5 PM 6 P M Illuminance [Lux] 0 20 40 60 80 100 120 140 160 180 200 Power Demand [W]
Desk Reference Room (total illum) Desk Test Room (total illum) Reference Room (illum daylight only) Test Room (illum daylight only) Reference Room (power) Test Room (power)
July 19, 2001 Clear sky No bottom blinds
Reference Room - no top blinds Test Room - top blinds closed
Reference Room - 0.971 kWh Test Room - 1.092 kWh
Figure 8 Example of power demand profiles of the continuous dimming lighting system and illuminance distribution at the ceiling and desktop levels.
CONFIGURATION TESTED: No bottom blinds.
REFERENCE ROOM TEST ROOM Fall 0 200 400 600 800 1000 1200 1400 1600 1800 2000 6 AM 7 AM 8 AM 9 AM 10 AM 11 AM 12 PM 1 PM 2 PM 3 PM 4 PM 5 PM 6 PM Illuminance [Lux]
Ceiling Reference Room Ceiling Test Room
October 22, 2000 Clear sky Top blinds closed
Reference Room - no bottom blinds Test Room - bottom blinds horizontal
0 200 400 600 800 1000 1200 1400 1600 1800 2000 6 AM 7 AM 8 AM 9 AM 10 AM 11 AM 12 PM 1 PM 2 PM 3 PM 4 PM 5 PM 6 PM Illuminance [Lux] 0 20 40 60 80 100 120 140 160 180 200 Power Demand [W]
Desk Reference Room (total illum) Desk Test Room (total illum) Reference Room (illum daylight only) Test Room (illum daylight only) Reference Room (power) Test Room (power)
October 22, 2000 Clear sky Top blinds closed
Reference Room - no bottom blinds Test Room - bottom blinds horizontal
Reference Room - 1.145 kWh Test Room - 1.146 kWh Summer 0 200 400 600 800 1000 1200 1400 1600 1800 2000 6 AM 7 AM 8 AM 9 AM 10 AM 11 AM 12 PM 1 PM 2 PM 3 PM 4 PM 5 PM 6 PM Illuminance [Lux]
Ceiling Reference Room Ceiling Test Room
June 25, 2001 Clear sky Top blinds closed
Reference Room - no bottom blinds Test Room - bottom blinds horizontal
0 200 400 600 800 1000 1200 1400 1600 1800 2000 6 A M 7 AM 8 AM 9 A M 10 AM 11 AM 12 PM 1 PM 2 PM 3 PM 4 PM 5 P M 6 PM Illuminance [Lux] 0 20 40 60 80 100 120 140 160 180 200 Power Demand [W]
Desk Reference Room (total illum) Desk Test Room (total illum) Reference Room (illum daylight only) Test Room (illum daylight only) Reference Room (power) Test Room (power)
Top blinds closed
Reference Room - no bottom blinds Test Room - bottom blinds horizontal
Reference Room - 1.196 kWh Test Room - 1.536 kWh
June 25, 2001 Clear sky
Figure 9 Example of power demand profiles of the continuous dimming lighting system and illuminance distribution at the ceiling and desktop levels.
CONFIGURATION TESTED: All top blinds closed.
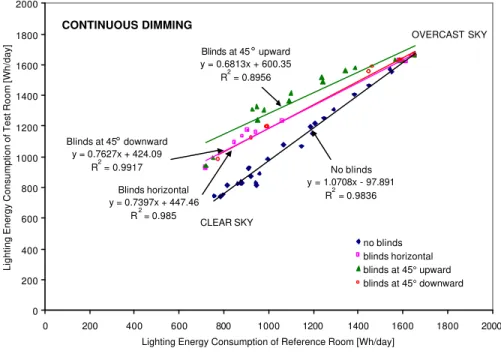
Blinds at 45° downward y = 0.7627x + 424.09 R2 = 0.9917 Blinds horizontal y = 0.7397x + 447.46 R2 = 0.985 Blinds at 45° upward y = 0.6813x + 600.35 R2 = 0.8956 No blinds y = 1.0708x - 97.891 R2 = 0.9836 0 200 400 600 800 1000 1200 1400 1600 1800 2000 0 200 400 600 800 1000 1200 1400 1600 1800 2000 Lighting Energy Consumption of Reference Room [Wh/day]
Lighting Energy Consumption of Test Room [Wh/day]
no blinds blinds horizontal blinds at 45° upward blinds at 45° downward CONTINUOUS DIMMING CLEAR SKY OVERCAST SKY
Top blinds closed y = 0.8497x + 317.25
R2 = 0.927 Bottom blinds closed
y = 0.9026x + 189.03 R2 = 0.9838
Bottom blinds 50% retracted y = 0.96x + 43.334 R2 = 0.9531 No blinds y = 1.0708x - 97.891 R2 = 0.9836 0 200 400 600 800 1000 1200 1400 1600 1800 2000 0 200 400 600 800 1000 1200 1400 1600 1800 2000 Lighting Energy Consumption of Reference Room [Wh/day]
Lighting Energy Consumption of Test Room [Wh/day]
no blinds
bottom blinds 50%retracted bottom blinds closed top blinds closed
CONTINUOUS DIMMING
CLEAR SKY
OVERCAST SKY
Figure 10 Lighting energy consumption of the dimming control system in the test and reference rooms for various sky conditions and blind settings (ALL BLINDS TESTS).
No blinds y = 1.0708x - 97.891
R2 = 0.9836 Bottom blinds closed
No top blinds y = 0.9703x + 48.984
R2 = 0.9807
Bottom blinds closed Top blinds horizontal y = 0.9178x + 171.5
R2 = 0.978 Bottom blinds closed
Top blinds at 45° downward y = 0.799x + 340.87 R2 = 0.9999 0 200 400 600 800 1000 1200 1400 1600 1800 2000 0 200 400 600 800 1000 1200 1400 1600 1800 2000 Lighting Energy Consumption of Reference Room [Wh/day]
Lighting Energy Consumption of Test Romm [Wh/day]
no blinds
bottom blinds closed, no top blinds bottom blinds closed, top blinds horizontal bottom blinds closed, top blinds at 45° downward
CLEAR SKY OVERCAST SKY CONTINUOUS DIMMING No blinds y = 1.0708x - 97.891 R2 = 0.9836 Top blinds closed No bottom blinds y = 0.9939x + 12.244
R2 = 0.9873
Top blinds closed Bottom blinds at 45° downward
y = 0.6382x + 585.63 R2 = 0.509
Top blinds closed Bottom blinds horizontal
y = 0.7125x + 487.97 R2 = 0.6124 0 200 400 600 800 1000 1200 1400 1600 1800 2000 0 200 400 600 800 1000 1200 1400 1600 1800 2000 Lighting Energy Consumption of Reference Room [Wh/day]
Lighting Energy Consumption of Test Room [Wh/day]
no blinds
top blinds closed, no bottom blinds top blinds closed, bottom blinds horizontal top blinds closed, bottom blinds at 45° downward
CONTINUOUS DIMMING
CLEAR SKY
OVERCAST SKY
Figure 11 Lighting energy consumption of the dimming control system in the test and reference rooms for various sky conditions and blind settings (BOTTOM AND TOP BLINDS TESTS).
Table 2
Average increase in lighting energy consumption and reduction in daylight availability on the workplane and at the ceiling photosensor caused by the venetian blinds on clear sky days
Position of Blinds Fall (Sep; Oct; Nov) Winter (Dec; Jan; Feb) Spring (Mar; Apr; May) Summer (Jun, Jul, Aug)
Daylight Daylight Daylight Daylight
Reference case
Test case Energy
Desk Ceiling Energy Desk Ceiling Energy Desk Ceiling Energy Desk Ceiling No blinds Horizontal 30% 10% 30% 30% 10% 50% No blinds 45° Upward 35% 30% 45% 45% 10% 60% No blinds 45° Downward 30% 40% 40% 25% 15% 45%
No blinds Bottom blinds
½ closed
10% 20% 0-5% 10% 20% 25%
No blinds Bottom blinds
closed
10% 30% 0-5% 15% 35% 50%
No blinds Top blinds closed 20% 10% 30% 15% 20% 25%
Bottom blinds closed Top windows no blinds Bottom blinds closed Top blinds horizontal 0-5% 0-5% 10% 15% 0-5% 0-5% Bottom blinds closed Top windows no blinds Bottom blinds closed Top blinds 45° Downward 20% 30% 30% 10% 0-5% 0-5% Bottom windows no blinds Top blinds closed Bottom blinds Horizontal Top blinds closed 0-5% 5% 0-5% 30% 20% 50% Bottom windows no blinds Top blinds closed Bottom blinds 45° Downward Top blinds closed 0-5% 10% 0-5% 30% 20% 50%
CONCLUDING REMARKS
As expected, this pilot study showed that window blinds may affect significantly the lighting energy savings potential of dimming lighting control systems, especially if they are left in certain
configurations for long periods of time. In this experiment, the impact of the blinds on the energy consumption of the lighting system depended mostly on the variability of daylight levels and the sky condition and did not vary significantly from one season to another.
The minimum daily lighting energy consumption was obtained in the “no blinds” configuration under a clear sky in March (620 Wh/day). However, this level of performance was achieved rather rarely, in less than 20% of all the clear sky days available throughout the monitoring period, which covered an entire year. The maximum dimming level achieved by the system was 13% light output (15% power output), which is higher than the 1% light level (8% power level) claimed for this system by the manufacturer. The maximum consumption in the same room under a completely overcast sky was 1560 Wh/day, which is about 7% lower than the energy consumption of the dimming system at night (1660 Wh) with the lamps fully on from 6 PM to 6 AM.
Regardless of season, on completely clear sky days and with no blinds, the dimming system saved between 50 to 60% lighting energy over the 12 hours time frame considered (6 AM to 6 PM) compared to the electric lights being fully on during the same time interval. These savings were reduced by 5 to 45%, based on the window blinds’ configuration present at the time of measurement. The correlation between the lighting consumption and each static blind setting was found to be reasonably independent of season and mostly dependent on the sky condition. Under clear sky, the blinds with slats horizontal or at 45° downward increased the lighting consumption on average by 30% compared to the “no blinds” scenario. The blinds with slats at 45° upward angle increased the lighting consumption by an additional 5 to 10%. Covering the bottom windows with blinds (either half or completely) and leaving the top windows unobstructed had a lower effect on the lighting energy consumption than doing the reverse (i.e. covering the top windows and unobstructing the bottom windows). Especially in the fall and winter, the dimming system could not reach its full savings potential when the top blinds were closed, even when the daylight availability on the workplane was high and at levels much above the space design illuminance.
Throughout the entire monitoring period, the lighting control system managed to maintain reasonably well the space illuminance (daylight + electric light) above 500 lux, the IESNA recommended
illuminance for office lighting. The daylight illuminance on the workplane was mostly below 500 lux in the spring and summer, and over 500 lux in the fall and winter for up to 6 hours a day. Frequently, under clear sky the lighting energy consumption was up to 30% higher in the spring and summer compared to fall and winter, result which is rather surprising considering the common belief that electric lighting usage between 6 AM and 6 PM is generally higher in the winter than in the summer due to the reduced daylight hours.
REFERENCES
Bordass, W., Heasman, T., Leaman, A., Perry, M.J., “Daylight use in open plan offices: the opportunities and the fantasies”. Proceedings of National Lighting Conference and Daylighting Colloquium. Cambridge, UK, Robison College, 1994, pp. 243-256.
Cohen, R., Bunn, R., “Learning from PROBE”, Building Services Journal, Vol. 23, No. 5. May 2001 Engineering Interface Limited. “Feasibility study of potential for electrical energy savings in Canadian office buildings using controls to dim perimeter lights”. Research Report for NRCan/CANMET, Ottawa, Canada, 1994.
Floyd, D.B., Parker, D. S., “Field commissioning of a daylight-dimming lighting system”, Proceedings
of the 3rd European Conference on Energy-Efficient Lighting – Right Light 3, Newcastle, England, pp.
Love, J., “Field performance of daylighting systems with photoelectric controls”, Proceedings of the 3rd European Conference on Energy-Efficient Lighting – Right Light 3, Newcastle, England, pp. 75-82, 1995.
ACKNOWLEDGEMENTS
This work was conducted as part of a project co-partially funded by the Panel on Energy Research and Development, Public Works and Government Services Canada and the National Research Council Canada. The authors would like to acknowledge the contribution of their colleagues Robert A MacDonald and Roger G Marchand who assisted on site with the data collection, and the occupants of the monitored offices for their cooperation and understanding during the course of the project.