Author Role:
Title, Monographic: Subaqueous disposal of reactive mine tailings - Louvicourt Mine Test Cells. Geochemical sampling and analysis final report
Translated Title: Reprint Status: Edition:
Author, Subsidiary: Author Role:
Place of Publication: Québec Publisher Name: INRS-Eau Date of Publication: 2001
Original Publication Date: Février 2001 Volume Identification:
Extent of Work: vii, 47
Packaging Method: pages incluant 2 annexes Series Editor:
Series Editor Role:
Series Title: INRS-Eau, rapport de recherche Series Volume ID: 547
Location/URL:
ISBN: 2-89146-457-5
Notes: Rapport annuel 2000-2001
Abstract:
Call Number: R000547
B. Vigneault P.G.C. Campbell A. Tessier R. De Vitre S. Prémont t
Louvicourt Mine Test Cells
Geochemical Sampling and Analysis
Final Report - February 2001
INRS-Eau
Report No. 547
INRS-Eau C.P.7500 Ste-Foy Québec GIV 4C7Table of contents
Table of contents ii
List of Tables Hi
List of Figures III
Summary ... v
Résumé ...•.•..•. vi
1. INTRODUCTION ... _ ... 8
2. MATERIALS AND METHOnS ... 11
2.1. Site description / Sampling ... 11
2.2. Electrochemical micro-profiles of pH and DO ... 13
2.3. Interstitial water analysis ... 14
2.4. Diffusive fluxes across the tailings - overlying water interface ... ; ... 16
2.5. Solid phase analysis ... 17
2.6. Quality assurance - Quality control (QAlQC) ... 18
2.7. Statistical analysis ... 18
3. RESUL TS ... ____ ... 19
3.1. General observations ... 19
3.2. Electrochemical micro-profiles ofpH and DO ... 19
3.3. Interstitial water analysis (peepers) - pH, anions, Fe, Mn ... 20
3.4. Interstitial water analysis (peepers) - trace metals ...•..•... 22
3.5. Solid phase analysis ...•... ~ ... 22
4. DISCUSSION ... _ ... _._ ... _ ... 23
4.1. DO consumption by the submerged tailings ... .' ... 23
4.2. Alteration of surficial tailings ... 24
t 4.3. Trace metal mobilization ...•...•... 25
5. CONCLUSIONS ... _ .. _ ... 29
6. A CKN 0 WLEDG MENTS ... _ ... _ _ ... __ ... 30
Appendix 1
Summary of findings from October 1996 sampling ... A 1-1 Appendix2
Summary of findings from June 1997 sampling ... A2-1
List of Tables
Table 1. Sequential extraction of metals from surface tailings with (1) MgCh, (2) acetate buffer at pH 5, (3) NH20H'HCI at room temperature, (4) NH20H·HCI at 96 oC, (5) H202 and (6) HF, HN03 and HCI04. Value are mean ± SD, n
=
3 (1996) and n=
4 (1998). The 1998 Cd analyses in fractions 5 and 6 were made by ETAAS (in fraction 5 of cell 1, only 1 out of 4 replicates) ... 3 3Table 2. Calculated diffusive flux of ions across the tailings - overlying water interface in cell 2. Positive fluxes indicate ions which diffuse from the overlying water into the tailings, whereas negative fluxes correspond to diffusion out of the tailings into the overlying water. Value are mean± SD, n
=
3 (1996 and 1997) and n=
4 (1998) ... 35List of Figures
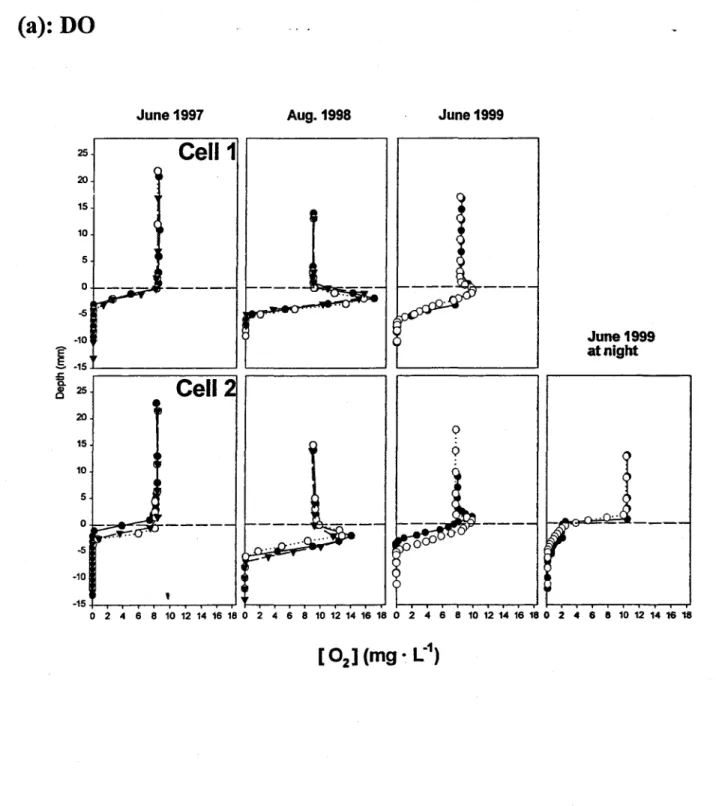
Figure 1. Typical porewater DO concentrations (a) and pH (b) profiles measured with microelectrodes inserted in the tailings (1 mm vertical resolution). The horizontal broken line indicates the tailings - overlying water interface. Each curve is from one insertion of the micro electJ;ode in the tailings using a micromanipulator deployed from a sampling platform at the centre of the experimental cell ... 36
Figure 2. Porewater pH profiles sampled by in situ dialysis (1 cm vertical resolution). The horizontal broken line indicates the tailings - overlying water interface. Each curve is from an individual peeper inserted into the tailings in the experimental cell, n = 3 (1996 and 1997) and n = 4 (1998) ... 38
Figure 3. Porewater concentration profiles for (a)
cr
(b)sol-
and (c)col-
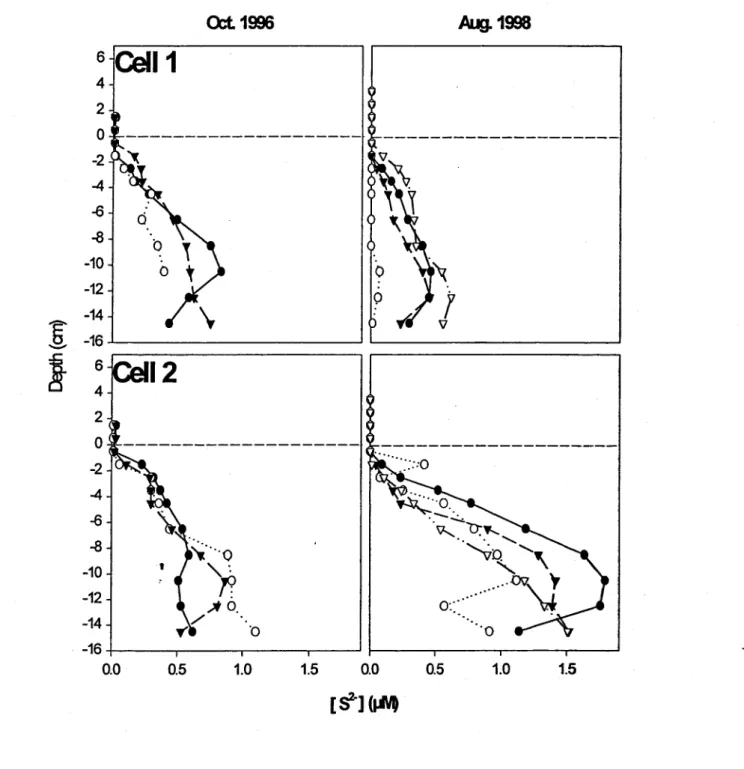
as sampled by in situ dialysis (1 cm vertical resolution). The horizontal broken line indicates the tailings -overlying water interface. Each curve is from an individual peeper inserted into the tailings in the experimental cell, n = 3 (1996 and 1997) and n = 4 (1998) ...•.. 39Figure 4. Porewater H2S concentrations profiles sampled by in situ dialysis (1 cm vertical resolution, detection limit
=
0.004 1lM). The horizontal broken line indicates the tailings -overlying water interface. Each curve is from an individual peeper inserted into the tailings in the experimental cell, n=
3 (1996 and 1997) and n=
4 (1998) ... .42Figure 5. Porewater dissolved iron (a) and dissolved manganese (b) concentrations profiles sampled by in situ dialysis (1 cm vertical resolution, detection limits = 0.21lM and 0.05 IlM
for Fe and Mn respectively). The horizontal broken line indicates the tailings - overlying water interface. Each curve is from an individual peeper inserted into the tailings in the experimental cell, n
=
3 (1996 and 1997) and n=
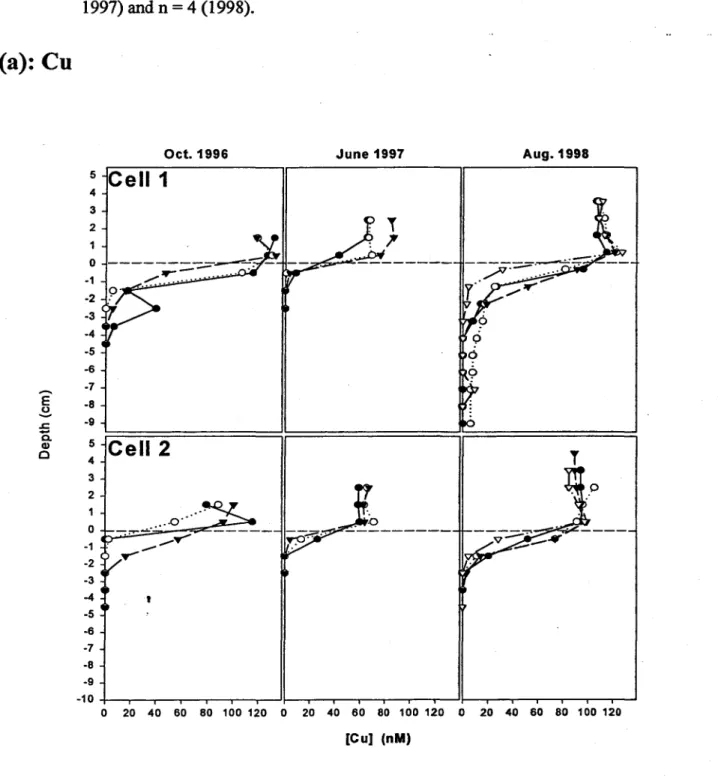
4 (1998). In 1998, one aberrant data point for both Fe and Mn, presumably resulting from contamination, was not inc1uded in their respective profiles ... 43Figure 6. Porewater dissolved copper (a) dissolved cadmium (b) and dissolved zinc (c) concentrations profiles sampled by in situ dialysis (1 cm vertical resolution, detection limits
= 3 nM, 0.1
nM
and 0.08 !lM for Cu, Cd and Zn respectively). The horizontal broken line indicates the tailings - overlying water interface. Each curve is from an individual peeper inserted into the tailings in the experimental cell, n = 3 (1996 and 1997) and n = 4 (1998).45Figure 7. Total metal concentrations (Cd, Cu, Ni, Pb, Zn, Fe) in surface layer oftailings in Cells 1 and 2. Ca) October 1996 sampling; (b) June 1997 sampling. Note heterogeneity for Cd, Cu, Pb and Zn in Celll ... 48
Summary
The objective of this study was to assess the effectiveness of an engineered shallow water coyer in reducing the oxidation of sulfidic mine tailings and thus preventing the development of acid rock drainage. Fresh tailings from the Louvicourt Mine (Louvicourt, Abitibi, QC) VIere submerged under a O.3-m water coyer in experimental field ceUs. From 1996 to 1998" we followed the chemistry of the interstitiaI water near the tailings-overlying water interlàce using
in
situ diaIysis, and determined pH and dissolved oxygen (DO) profiles across the tailing-water interface using micro-electrodes. Penetration of DO into the tailings was limited to < 7 mm, even in the presence of DO produced by benthic periphyton. Anoxia in the tailings was further demonstrated by the appearance of dissolved LH2S, Fe and Mn in pore water at depths -1.5 cm
below the interface. However, there was c1ear evidence of surface oxidation of the mine tailings at the mm scale (Le., DO depletion, coupled with locaIized increases in
[Hi
and [SOlO]).Mobilization of Cd and Zn from this surface layer was indicated by the presence of sub-surface peaks in the concentrations of these two metals in the. tailings interstitial water and by a change in their solid phase partitioning from refractory to more labile fractions. In contrast, there was no evidence for mobilization of Cu from tailings.
Unlike previous reports, which suggested that submerged tailings were effectively inert, our results show sorne aIteration of the superficiaI layer over time. The observed Cd and Zn releases from the submerged tailings are however very smaIl. For a typicaI disposaI operation (a 1 km x 1.5 km impoundment with an average depth of 1 m, an overlying water volume of 1.5 x 10⁹ L,
t
and an average water residence time in the impoundment of 1 year), caIculations indicatethat
these releases would increase the overlying water Zn concentration by 47 nM (3 ppb) and the Cd concentration by 0.31 nM (0.04 ppb). The Cd and Zn fluxes from the tailings to the overlying water would thus have only minor impacts on the overlying water quaIity.
Résumé
Cette étude avait pour objectif d'évaluer l'efficacité de la disposition subaquatique de résidus miniers réactifs' comme moyen à réduire l'oxydation des sulfures présents dans les résidus, et ainsi à prévenir le drainage minier acide. De telles études avaient été réalisées dans le passé dans des lacs relativement profonds ; la présente étude visait plutôt à simuler les conditions susceptibles de se rencontrer dans un réservoir artifiçiel de faible profondeur. Les résidus miniers de la mine Louvicourt (Louvicourt, Abitibi, Québec) ont été submergés directement sous 0.3 m d'eau dans des cellules expérimentales construites à même le site. La chimie de l'eau interstitielle près de l'interface résidus-eau surnageante a été étudiée de 1996 à 1998 au moyen de la dialyse in situ. Des profils de pH et d'oxygène dissous (OD), à travers l'interface résidus~u surnageant, ont également été obtenus à l'aide de micro-électrodes. La pénétration de l'OD était limitée aux premiers 7 mm de profondeur, et ce même en présence d'algues periphytiques produisant de l'GD
à la surface des résidus~ L'absence d'GD à des profondeurs> 7 mm a de plus été confirmée par la présence de sulfures, de Fe(II) et de Mn(II) dissous dans l'eau interstitielle prélevée à 1.5 cm sous l'interface. Néanmoins, malgré cette pénétration limitée de l'oxygène, plusieurs observations indiquent que les sulfures près de l'interface résidus~u surnageante subissaient une oxydation à
l'échelle du mm (i.e., diminution localisée de OD, avec augmentation concomitante de
[W]
et [SOl"]). La mobilisation du Cd et du Zn près de l'interface résidus-eau surnageante s'est révélée par la présence de maximums, juste en dessous de l'interface, pour les concentrations de ces deux métaux dans l'eau interstitielle des résidus, et par un déplacement progressif de ces métaux des phases solides les plus réfractaires vers des phases solides plus labiles au cours de l'étude. Part
ailleurs, aucun des paramètres étudiés ne suggère une mobilisation semblable du Cu.
Contrairement aux études précédentes, qui ont suggéré que les résidus miniers submergés soient totalement inertes, nos résultats montrent une altération graduelle de la couche superficielle des résidus avec le temps. Cependant, la diffusion du Cd et Zn des résidus vers l'eau surnageante est demeurée très faible. Par exemple, pour un parc à résidus de 1 km x 1.5 km ayant
une profondeur moyenne de 1 m, soit un volume d'eau approximatif de 1.5 x 10⁹ L, et en supposant un temps de résidence de la colonne d'eau d'un an, nous estimons que les flux diffusifs de Zn et de Cd provenant des résidus submergés augmenteraient la concentration de Zn dans l'eau surnageante de 47 nM (3 ppb) et la concentration en Cd de 0.31 nM (0.04 ppb). Les flux diffusifs de Cd et de Zn auraient donc un impact mineur sur la qualité de l'eau surnageante.
1. INTRODUCTION
Acid mine drainage is a major environmental concem of the mining industry world-wide. Many
of the ores exploited contain a large proportion of sulfides, present mainly as pyrite (FeSl~ The
pyrite-containing tailings produced can be oxidized when exposed to the atmosphere and ramf.all,
generating large amounts of sulfuric acid. The major oxidants of pyrite are dissolved oxygen
(DO) and, once the oxidation process has been initiated, Fe3+. In this latter prooess, 'the
rate-limiting step of the oxidation process is the oxidation of Fe2+ ~ Fe3+, catalyzed by micro-organisms (Evangelou and Zhang, 1995). The resulting acidic solution can leach metals from the
tailings, constituting a threat for the quality of the receiving environment (Geller et al., 1998).
Several techniques have been developed for the treatment of acid mine drainage, such as
chemica1 neutralization and treatment in wetland systems (Evangelou and Zhang., 1995).
However, the treatment of drainage water is unappealing as a long term solution, given 1he high
cost and open-ended nature of the operation, which could potentially last for hundreds of years
after the mining operation has stopped (Filion et al., 1990). Accordingly, considerable effort bas
been expended to develop techniques for the prevention of acid mine drainage (e.g., the Mine
Environment Neutral Drainage (MEND) program, run by Natural Resources Canada). These
prevention techniques are based on processes such as the inhibition of the activity' of
iron--,
oxidizing bacteria by the addition of anionic surfactants, the precipitation of Fe3+ by t'he addition
of phosphate, or the limitation of DO diffusion into the tailings by physica1 barriers (Evange1ou
and Zhang, 1995). Because of its economic and environmental relevance, the utiliza:tiouof w.ater
Underwater disposaI of reactive tailings attenuates the input of DO to the tailings, ambient DO
concentrations in overlying water and sedimentary interstitial water being much lower than in air.
In addition, the resulting suboxic to anoxic conditions should inhibit the microbial catalysis
associated with the oxidation process (Kleinmann and Crerar, 1979). The underwater disposal of
tailings to prevent oxidation is different from inundation of already-altered tailin~ in which case
the oxidation products already present strongly influence the fate of the tailings after flooding.
Pedersen and co-workers studied the diagenesis of tailings submerged in Buttle Lake, British
Columbia, Canada (Pedersen, 1983; Pedersen and Losher, 1988; Pedersen et al., 1991) and
concluded that no significant oxidation occurred after underwater disposaI of the tailings. No
release of Cd, Cu or Zn from the submerged tailings could be detected. However, Buttle Lake is
affected by acid mine drainage and the overlying water metal concentrations are already elevated.
In 1991, Pedersen et al. sampled additional cores from Buttle Lake; based on comparisons of the
porewater and overlying water metal concentrations, they conc1uded that there was no metal
efflux from the submerged tailings. Pedersen et al. (1993) aIso studied submerged tailings in the
shaIlower Anderson Lake, Manitoba, Canada. This lake is also affected by acid mine drainage
and because of the resulting high metal concentrations in the water column, the submerged
tailings were acting as a sink for metals.
Although underwater disposaI seems beneficiaI in the context of stabilizing reactive sulfides, the
,
use of natural lakes' to pro vide the water coyer . (as was the case in the examples studied byPedersen and co-workers) raises environmental conservation issues. The utilization of man-made
reservoirs is inherently appealing, but there are legitimate concems regarding the long-term
stability of such structures and the need for dike maintenance. For engineering, geotechnical and
shallow water covers (e.g., < 1 m) will potentially be affected by climatic conditions such as
sediment resuspension resulting from wind-induced turbulence and the complete freezing of the
water column in northem areas. Because of the shallower depth of water, the DO concentration
will be maintained at higher levels and the higher amount of light reaching the tailings surface
could allo~ the establishment of a periphyton layer, the photosynthetic activity of which will
constitute a localized source of DO. These potential perturbations of the tailings raise legitimate
questions regarding the effectiveness of a shallow water cover.
The present investigation was thus designed toassess the efficiency of shallow water covers in
man-made reservoirs for the prevention of the oxidation of sulfidic mine tailings. We have
monitored reactive mine tailings submerged in field test cells, with a water cover of about 0.3 m.1
From 1996 to 1998, we followed the chemistry of the interstitial water near the tailings-overlying
water interface using in situ dialysis (porewater peepers), and determined pH and DO profiles
across the tailing-water interface using microelectrodes~ These latter techniques have revealed
diagenetic processes occurring near the interface at the mm scale. Because of their lower vertical
resolution, the conventional geochemical techniques such as in situ dialysis and coring did not
detect these pro cesses. We have also monitored changes in the lability of the metals in the tailings
solid phase over the same period, using sequential extractions to probe metal partitioning in the
superficial layer of tailings, sampled by coring. Previous reports suggested that submerged
t
tailings were effectively inert in water bodies with an active depositional regime and a settling
flux of organic matter. For settled tailings with no significant accumulation of organic matter, our
1 Complementary column studies were performed by CANMET researchers on these same tailings, under controlled
results show slight but measurable alteration of the superficiallayer over time.
To evaluate physical and chemical interactions within the deposited tailings, our measurements
focused primarily on the interstitial water, as it is weIl recognized that the composition of the
aqueous phase is far more sensitive to diagenetic reactions thanis that of the solid phase. The
experimental program emphasized measurements of:
• diffusion of 02 from the water cover into the sediments;
• diffusion of dissolved metals and anions across the tailings-water interface;
• interactions between the aqueous and solid phases (sorption; oxidation; dissolution).
In addition, changes in metal partitioning were monitored in the exposed tailings at the tailings-water interface (Le., the solid phase). The solid-phase, poretailings-water and tailings-water-column geochemical
data were used to interpret controls on the chemical behavior of the submerged tailings.
2. MATERIALS AND METHODS
2.1. Site description / Sampling
Located about 20 km east of Val d'Or, Québec, Canada, the Lmrricourt Mine is a Cu and
Zn
underground mine that has been in operation since 1994. About 18 % of the ore processed produces metal concentrates, 50 % is used as underground back
filLand
the remaining 32 % isdisposed of underw~ter in an artificial reservoir. Grain size measurements indicate that the
tailings are mainly composed of partic1es in the silt and rme sand fr.actions (Li and St-Arnaud,
2000). The tailings consist of silicate, sulfide, carbonate and oxiile milnerals. The dominant sulfide is pyrite, with chalcopyrite, sphalerite and galena present .in tracequantities. Silicate
siderite and ankerite (or ferroan dolomite) were identified as the dominant carbonate minerais (Li
and St-Arnaud, 2000).
In order to evaluate the effectiveness of the current water coyer as weIl as the possible
post-closure options, two field test ceIls (21 m x 21 m) were constructed adjacent to the reservoir. The
cells were filled with about 3 m of mine tailings and covered by 0.3 m of water, pumped from an
adjacent pond, at the end of August 1996. The two experimental cells, designed as replicate
treatments, were filled in parallel over a period of about three weeks by bleeding tailings off the
main tailings pipeline. However, Cell 1 took slightly longer to fill than did Cell 2. During the
additional 48 h needed to fiIl CeIl 1, the mine's flotation plant changed from a Cu and Zn
recovery mode to a Cu-only recovery procedure. The final layer of tailings was thus enriched in
metals (and less homogeneous) in Cell 1 compared to Cell 2. Nevertheless, the geochemicaI
behavior of the tailings in the two cells proved similar.
A floating sampling deck was installed in the center of the cells to facilitate sampling. Water
levels were maintained with V -notched weirs. In the event of insufficient inputs from
precipitation and drainage waters, the cells were topped up periodically by pumpingfrom the
adjacent pond. From the third week of May to the first week of November (Le., the ice-free
season), outflow, water pH, temperature and conductivity were automatically recorded at I-h
1
intervals in 1997 and 2-h intervaIs in 1998; these data were collected by the Louvicourt Mine
personnel. Unfortunately, sporadic failure of the pH electrode limited the usefulness of the pH
data set, but the flow data were considered to be reliable. We sampled the cells on four occasions,
15-16 October 1996, 10-11 June 1997, 25-26 August 1998, and 15-16 June 1999. The tailings
in October 1996; this was the maximum possible period that would still allow for installation and
retrieval of the porewater peepers before the fall freeze-up. The June 1997 campaign was a
reduced effort2 and the interstitial waters were sampled only to a depth of 2.5 cm. Similarly, the
June 1999 campaign was limited to microelectrode measurements.
2.2. Electrochemical micro-profiles of pH and DO
A submersible micro-manipulator, consisting of a hand-operated micrometer attached to a tripod
support inserted into the tailings, was used to displace the 02 and pH electrodes incrementally
across the interface, both downward and upward. The micro-manipulator was equipped with a
flexible illuminated boroscope, with which the position of the microsensor's tip (a white dot was
painted close to the sensor's tip) could be determined relative to the tailings-water interface with a
precision of ±O.5 mm. O2 profiles were measured in situ using Clark-type 02 micro-electrodes with a guard cathode (Diamond General Corporation; type 737-GC; tip size 15-35 1lID;
response time < 1 s). The pH profiles were obtained with glass combination
micro-electrodes from Orion Research Inc. (No. 9803BN), which were also fixed to the end of the
micro-manipulator. The 02 and pH micro-profiles were obtained in June 1997, August 1998 and
June 1999. Micro-profiles were measured from about 9hOO to 15h00 under sunny or
partly-covered sky, except for the profiles that were measured at night. The micro-manipuIator was
deployed at different points adjacent to the sampling deck, allowing us to obtain severa! profiles
,
within each cell.2 The second sampling campaign was designed around the two components of the field program that had not been
carried out in October 1996: (i) sampling of the groundwater and (ii) determination of pH and O2 profiles across
the tailings-water interface. However, in the light of the October 1996 results, specifically the indication of dissimilar geochemical behavior in the two cells, we decided to repeat some of the porewater measurements and determine whether the heterogeneity was still present after the first winter.
2.3. 1 nterstitial water analysis
Water samples were collected with in situ samplers (porewater peepers; 1 cm vertical resolution;
Gelman HT-200 polysulfone membrane, 0.2 Jlm nominal pore size) similar to those described by
Carignan et al. (1985). The Plexiglas components of the peepers were kept under an N2
atmosphere for a minimum of 15 d (Carignan et al., 1994), prior to filling the compartments with
Milli-Q water (> 18 MO). The assembled peepers were then further deoxygenated under a N2
atmosphere for at least 48 h, and were also maintained under N2 during transport to the field site.
At the sampling site, peepers were inserted vertically into the tailings at four sites in each cell
(10-15 m apart), using a small boat. Once in place, the peepers extended 7-9 cm above the
tailings-overlying water interface; the remaining 21-23 cm were within the tailings. They were
allowed to equilibrate for two weeks; no major outflow events occurred during these sampling
periods.
After the equilibration period, the peepers were retrieved, rinsed with the overlying water from
the cell and sampled immediately in the ambient air in the mobile laboratory. The whole process
of sampling each peeper generally took < 15 min. Samples for LH2S determinations were
processed first to minimize losses ofthis unstable analyte. Samples for LH2S analysis (1.5 mL)
were obtained from tpe compartments of one of the vertical rows with N2-Purged syringes. They
were injected through a septum into pre-washed 3 mL amber glass bottles, which had been
purged with N2 and contained 60 JlL ofN,N'-dimethyl-p-phenylenediamine sulfate (2.7 mM in 6 M Hel) and 60 JlL of FeCh (5.55 mM in 6 M HCI). These samples were maintained At 4 OC in
mL was also retrieved from the same row of compartments with a micropipette and injected into
1.5 mL pre-washed polypropylene tubes for
cr
andsol-
analyses. For dissolved inorganic carbon (DIC) determinations, a third set of subsamples was collected using a syringe that hadpreviously been purged with nitrogen; the aqueous sample (l.5 mL) was injected through a
rubber septum into a bottle than had previously been acidified with HCI (1 N; 60J.1L) and purged
with helium. Samples (3 mL) for metals were then collected from the compartments of the
second vertical row by piercing the peeper membrane with a micropipette fitted with an
acid-c1eaned tip: these samples were injected into pre-washed and pre-acidified (40 JlL 10 % HN03
Anachemia ultrapur) vials. The remaining 1 ml was removed with a syringe for immediate pH measurement, using a combination glass micro-e1ectrode and a portable pH meter.
l:H2S was measured within 24 h by a spectrophotometric method (Cline, 1969), using a
segmented-flow colorimetrie analyzer (Autoanalyser II, Technicon Instruments Corporation,
NY). Standard solutions for the calibration curve were prepared in the laboratory ait the time of
each sampling. The samples for DIC analysis were retumed to the centrallàboratory and the C02
trapped in the headspace was analyzed on arrival by gas chromatography (perkin Elmer Sigma
300 HWD chromatograph). Chloride and SO/- concentrations were determined with an ion
chromatography system equipped with a conductivity detector (DX-300 Gradient
Chromatography Systems, Dionex, CA). An AS12A column with an AG 12A pre-colmnn and an
1
injection loop of 100 JlL were used.
Depending on their concentrations, metals were analyzed either by atomic absœption
atomic absorption spectroscopy (ET AAS) on a SIMAA 6000 graphite fumace equipped with an
autosampler (model AS72) (perkin-Elmer Corporation, Norwalk, CT), or by inductively coupled
plasma atomic emission spectroscopy (ICP-AES) on an AtomScan 25 spectrophotometer
(Thermo Jarrell Ash Corporation, Franklin, MA).
-2.4. Diffusive fluxes across the tailings - overlying water interface
Diffusive fluxes of species "i" across the tailings-water interface, Ji, were calculated according to
Fick's law, neglecting porewater advection:
dO
Ji
= -
<1> 'X" D i-dx
where <1> is the porosity of the tailings, 't the tortuosity, Di the molecular diffusion coefficient and
dC/dx is the concentration gradient. The porosity of settled tailings (0.4) and a tortuosity value of
0.2 were obtained from an earlier study by Li and St-Arnaud (2000) on the same tailings.
The O2 concentration gradients were calculated from the slope of the micro-profiles in the
tailings. O2 diffusivity was obtained from Broecker and Peng (1974) and corrected for
temperature according to Zhang and Davison (1995); the mean temperature over the 02
measurement period was used, 23 ± 2 oC.
For
cr
andsol-
fluxes, tracer diffusion coefficients were obtained from Li and Gregory (1974) and corrected for temperature according to Zhang and Davison (1995). The mean temperature1996, the first available 24-h temperature data set was used, as obtained 3 d after the sampling of
the peepers, 8.1 ± 0.8 oC. Mean concentrations at +0.5 cm in the overlying water and at -0.5 cm
in the tailings were used to calculate the concentration gradients.
2.5. SoUd phase analysis
In October 1996 and August 1998, 3 and 4 cores per cell respectively were collected close to the
peeper sampling sites, with Plexiglass coring tubes (9 cm inside diameter). The tubes were
tightly closed and handled with care to minimize any perturbation of the tailings during their
transport to shore. The cores were immediately extruded using a piston extruder. The uppermost
0.5 cm layer was sampled and placed in a 500 mL centrifugation bottle, half-filled with overlying
water from the cells; the resulting suspension was kept frozen until analysis.
Before analysis, the superficial sediment samples were thawed, shaken gently for 30 min and
then centrifuged at 12 000 g for 30 min to remove excess water. Metals in the sediment (Cd, Cu,
Zn and Fe) were partitioned into operationally defmed fractions by extracting the sediment
sample sequentially according to the methods used by Tessier et ai. (1989)~ These extractions
have been developed for naturaI oxic lake sediments and their application to mine tailings is not
straightforward, given the differences in composition between lake sediments and mine tailings.
Nevertheless, this sequential fractionation procedure yields results tbat are roughly indicative of
1
the lability of the metaIs in the superficial tailings.
The October 1996 results indicated considerable heterogeneity at the surface of Cell 1 (see
RESULTS). To confirm these results, we undertook an additional sampling campaign in June
sediments were not subjected to the sequential fractionation procedure, but were simply analyzed
for total metal concentrations.
2.6. Quality assurance - Quality control (QA/QC)
To assess analytical accuracy, certified reference materials (CRMs) were run as blind samples
during each analytical ron. Sources of appropriate CRMs included the National Research Council
of Canada (standard riverine water, NRCC SLRS-3; standard sediment NRCC MESS-2) and the
D.S. National Institute of Standards and Technology (trace elements in water SRM 1643d).
Measured concentrations were verified by standard additions and consistently compared well
with the certified values. Analytical precision was monitored by performing replicate analyses,
either in the field (pH; [02]) or in the central laboratory (major cations; major anions; trace
metals). In addition, combined sampling and analytical performance was evaluated according to
the principle of "geochemical consistency" (e.g., Pedersen et al., 1993), which requires that
variations in concentration profiles of dissolved constituents in closely-spaced aqueous samples
should be smooth.
2. 7. Statistical analysis
Inter-annual comparisons of the calculated fluxes across the interface in Cell 2 were performed
using the t-test for
cr
andsol',
between 1997 and 1998, or one-way ANOVA for Cu, among1
1996, 1997 and 1998 (Jandel Scientific, Sigmastat Version 2.0, San Rafael, CA). Differences
were considered significant at P < 0.05. Parametric assumptions of normality and equal variance
were first checked with the Kolmogorov-Smirnov test (with Lilliefor's correction) and the Levene
3. RESULTS
3.1. General observations
In the present report, for simplicity, we have emphasized results from the second cell, where the
total metal concen1;rations in the tailings were somewhat lower and the surface layer was more
homogenous. However, the results for both Cell 1 and Cell 2 are presented in the tables and
figures.
3.2. Electrochemical micro-profiles of pH and DO
The electrochemical micro-profiles show the disappearance of DO within only a few mm of the
tailings-water interface (Fig. la). The frrst measurements, carried out in June 1997, revealed a
sharp decrease in the DO concentration in the tailings, with anoxic conditions appearing < 5 mm
below the tailings-water interface. In contras!, the midday results for August 1998 and June 1999
showed an DO peak just below the interface. This peak disappeared at night, however, and thus
we attribute its transitory appearance to the photosynthetic production of DO by a periphyton
layer that had established on the surface of the tailings by year 2. This green layer was
observable by visual inspection of the interface. Note that even in the presence of this daytime
DO production layer, anoxic conditions appeared at very shallow depths within the tailings «7
mm).
,
The pH micro-profiles indicate a weak. pH decrease below the tailings-overlying water interface
(Fig. lb). In 1997 this decrease developed immediately beneath. the interface, but the pH
increased sharply below about 5 mm, reaching values close to 8.4 at depths > 10-12 mm. In 1998 and 1999, the pH increased immediately below the interface (0 to 3 mm), and only at greater
depths did the acidic peak become evident. The pH increase just below the interface, coincident
with that of DO, is also attributed to the photosynthetic activity of the periphyton layer at the time
of sampling, since it was absent at night. The DO and pH micro-profiles indicated that the zone
of influence of the established periphyton layer in August 1998 was 3-4 mm. The absence of a
subsurface maximum in 02 and pH at the sampling date in early June 1997 (nine months after the
cells were filled) suggests that the photosynthetic activity of the developing periphyton layer was
not yet sufficient to affect the O2 concentration and pH.
3.3. Interstitial water analysis (peepers) - pH, anions, Fe, Mn
One month after the filling of the experimental cells, pH profiles in the overlying and interstitial
water showed a marked increase of the pH with increasing depth in the tailings (Fig. 2), reflecting
the fact that the tailings had been limed before they were introduced into the ceUs. The pH
decreases observed in 1997 and 1998 with the pH microelectrode also appear in the pH profile
obtained by in situ dialysis, but with a lower resolution. For both 1997 and 1998, the pH values
obtained by dialysis at -0.5 cm are identical and are close to the average pH measured with the
microelectrode over the first cm, 7.74 compared to 7.84 respectively. The constant pH at depths
> 6 cm is reduced from 9.5 in 1996 to 8.5 in 1998.
In both ceUs and in all peepers, dissolved inorganic carbon concentrations decreased with depth.
1
In October 1996 concentrations in the overlying water ranged from 0.9 to l.I mM, but at depths
as shallow as 3 cm concentrations had decreased to about 0.2 mM and remained at this level all
the way down to 15 cm; in 1998 the concentrations in the overlying water were somewhat higher
(2-2.7 mM, consistent with the slightly higher pH values in 1998), but again they decreased with
carbonate-po or (and/or that there is a sink for carbonate at depth), and that the tailings are acting
as a sink for carbonates in the overlying water. In contrast, the initial concentrations of both
cr
andsol-
were much higher in the tailings than in the overlying water (Fig. 3), resulting ina.
diffusion of both anions from the tailings to the overlying water. Comparison of the results for
the two full dialysis campaigns reveals that the absolute concentrations of both anions and the'ilr
concentration gradients were lower in 1998 than in 1996, especially for
cr,
which has a specifie tracer diffusion coefficient about twO times higher than S042- (Li and Gregory, 1973). In 199~ the profiles forcr
showed no abrupt change of slope around the interface area, which is consistent with the absence of diagenetic reactions involvingcr.
In contrast, an increase insol-concentrations appeared in the 1998 profiles, just below the interface.
The in situ dialysis results also indicate the development of reducing conditions at depths of 1.5
cm and deeper. Anoxic conditions in the tailings were contirmed by the presence in the
interstitial water of H2S at depths ~ -1.5 cm in both 1996 and 1998 (Fig. 4). Peaks for reduced
Fe(II) in 1997 and 1998 and Mn (II) in 1998 also appeared at this depth (Fig. 5), likely
corresponding to the dissolution of Fe- and Mn-containing carbonates, such as Mg-ankerite,
which are present in the tailings material. Reduction of traces of Fe,Mn-oxides or oxyhydroxides
might also contribute to these peaks. In 1996, results for Fe and Mn indicate that clearly defined
interstitial concentration profiles had not yet developed after the one-month period following the
,
underwater disposal. The apparent peak of Fe and Mn in the overlying water is likely an artifact,reflecting the difficulty inherent in precisely locating the tailings-water interface. Altematively,
Early in the experiment (1996 and 1997 profiles), trace metal concentrations (Cd, Cu, Zn) in the
interstitial water close to the interface tended to be lower than in the overlying water (Fig. 6).
This trend persisted for Cu in the 1998 profiles, with the exception of sorne where there Wti
a.
small Cu peakjust above the interface. By 1998, however, most of the Cd and Zn peaks appeared
-just below the interface at -0.5 cm, indicating sorne mobilization of these metals and theirdiffusion toward the overlying water.
3.5. Solid phase analysis
The apparent increase in dissolved metal concentrations just below the tailings-water interface is
also associated with modifications in their partitioning in the solid phase of the surficial tailings
(Table 1). Results for Cell 1 and Cell 2 are very similar, but as evidenced by the higher standard
deviation of the Cell 1 results, the surface layer of this cell is much more heterogeneous than the
Cell 2, as previously mentioned. Comparison of the total metal levels in the surface sediments
(Figure 7) also reveals this greater heterogeneity in Cell 1. Cell 2 is thus more useful for
understanding the evolution of the tailings solid phase from 1996 to 1998, and only the results
from Cell 2 tailings are presented below.
The total concentrations of Cu and Cd remained unchanged from 1996 to 1998, but the lDtall t
concentration of Zn in the surface layer declined slightly over the same period (t-test, TIl = 3
(1996) and n
=
4 (1998), P=
0.041). Copper was extracted mainly with the H202 oxidatioD. andHF, HN03 and HCI04 digestion treatments, 89 % in 1996 and 93 % in 1998. These are the Iwo
least labile fractions and represent the metal associated with organic matter, unreactive sulfides
buffer (fraction 2) decreased from 1996 to 1998. Over the two-year interval, the proportion of
Cd in fractions 5 and 6 decreased, passing from 66 % in 1996 to 25 % in 1998., while Cd
concentrations in the other more labile fractions increased - in 1998, 75 % of the Cd was either
non-specificaUy adsorbed or associated with Fe- and Mn-oxyhydroxides (fractions 2, 3 and 4)
and 10 % was found in the exchangeable fraction, this being the highest proportion observed for
any metal in fraction 1. Zinc also shifted to more labile fractions over the two-year study period
but to a lesser extent, passing from 52 % in fractions 5 and 6 in 1996 to 33 % in 1998.
4. DISCUSSION
4.1. DO consumption hy the suhmerged tailings
The shallow water cover (0.3 m) in the experimental ceUs appears to act effectively to limit the
oxidation process. The depth-integrated DO consumption of the tailings calculated from the
micro-profiles obtained in June 1997 is (0.324 ± 0.005) x 10-2 nmo!·cm-2-s·1• This DO
consumption is about 2000 times lower than the observed DO consumption ofLouvicourt tailings
in humidity test cells, 6.5 nmol·cm-2·s-1 (Li and St-Arnaud, 2000).
Despite this markedly reduced DO consumption, the DO micro-profiles always showed the
complete disappearance of DO in the tailings interstitial water within 5-7 mm of the
tailings-water interface (see ltigure lb). In this respect, the tailings are behaving like normal fine-grained
lake sediments, where the oxic surface layer is normally <1 cm in thickness (Rasmussen and
Jorgensen, 1992; Berg et al. 1998). Clearly tailings lying more than 2 cm below the tailings-water
4.2. Alteration of sur:ficial tailings
Contrary to earlier indications in the literature (Pedersen et al., 1991), submerged sulfidic tailings
do not appear do be completely inert and weathering does occur close to the overlying
water-tailings interface. Oxidation of the water-tailings is demonstrated by the weak acidic peak observed in
the pH micro-profiles just below the tailings surface, by the shoulder in the
sol-
porewater profiles observed at the same depth, as well as by the mobilization of Cd and Zn (see Section4.3).
The increase in size of the acidic peak observed between 1996 and 1999, whether in the
electrochemical micro-profiles or in the profiles obtained by in situ dialysis, is a strong indication
of the oxidation process of pyritic material. As indicated by the pH micro-profile in 1999, fluxes
of
W
across the interface will depend on the photosynthetic activity of the periphyton layer: during daytime, tailings will act as a sink forIr,
whereas at night they will act as a source of H+. The pH of the water measured at the outflow from the cells remained constant throughout theice-free period at a value of about 8 from June 1997 through June 99 (data not shown). Globally
tailings effects on the overlying water pH are negligible compared to the buffering capacity of the
overlying water and the dilution from input water.
The
sol-
porewater profiles are also indicative of the oxidation process near the surface of the•
tailings. We attribut~. the weak
sol-
peak below the interface in 1998 to the production ofsol-by oxidation of the tailings3• Diagenetic S042• production is also suggested by the calculated
3 Gypsum dissolution might also be contributing to the subsurface maximum in sulfate concentrations. If the rate of production of sulfate through this route were higher than the consumption of sulfate through
sol'
reduction, a subsurface sulfate maximum would result (T.F, Pedersen, University of British Columbia, personal communication, September 2000).sol-
flux across the interface (Table 2). While thecr
flux (mol·cm2·s-t) decreased from (- 1.1 ±0.2) x 10-13 in 1997 to (- 4.0 ± 0.5) x 10-14 in 1998 (t-test, n = 3, P = 0.003), the
sol-
flux (mol'cm2's-1) remained unchanged, (-7 ± 2) x 10-13 in 1997 and (-8 ± 3) x 10-13 (t-test,n
=
3, P =0.543).
4.3. Trace metal mobilization
Ion Activity Products (IAP) were compared with the solubility products of various Fe and Mn
solid phases to identify possible processes that could explain the disappearance of these metals
from interstitiaI waters at depths > 2.5 cm in the tailings. Ion activities were calculated with the
computer code HYDRAQL (papelis et al., 1988) from the 1998 measured concentrations. The
concentrations of Ca and Mg were presumed to be depth-independent and the concentrations at
-0.5 cm were used at subsequent depths for the purpose of these calculations. The original
HYDRAQL thermodynamic database was updated as in Huerta-Diaz et al. (1998) and the
program was modified to replace S-2 by HS-. At -3.5 cm and -4.5 cm, the IAP calculations suggest
that Fe was precipitating as the sulfide greigite, which is also the case for severa! naturallake
sediments (Emerson et al., 1983; Huerta-Diaz et ai., 1998). However, pore water appears strongly
under-saturated with respect to Mn sulfide or carbonate. As suggested by Huerta-Diaz et al. (1998) for two Canadian Shield lakes, the adsorption of Mn to FeS(s) and the co-precipitation of
Mn with FeS(s) could be responsible for the observed trapping of dissolved Mn below 2_5 cm in 1
the tailings, rather than the precipitation of distinct Mn sulfide or carbonate solid phases_
Similar IAP calculations for Cu, Cd and Zn demonstrated that the interstitial waters at -1.5 cm.
were over-saturated with respect to the relevant sulfide solid phases (covellite for Cu, amorphous
interstitial waters were not in equilibrium with solid sulfide phases at this depth and/or that these
metals were complexed in solution by ligands not considered in the thermodynamic calculation,
such as polysulfides, organic thiols or other dissolved organic molecules.
In 1998, the Cd and Zn concentration profiles clearly indicate a mobilization ofthese metal from
-the tailings to -the overlying water. However -the interpretation of -the dissolved metal profilesis
difficult because of the 1 cm resolution of the peepers and their possible vertical displacement
during deployment. The electrochemical micro-profiles demonstrate clearly that diagenetic
reactions at the tailings-water interface are occurring at the mm scale, i.e. weIl below the scale
sampled by the porewater peepers. Therefore the values obtained with the peepers are means
over 1 cm intervals; sharp dissolved metal peaks and steep metal concentration gradients would
be undetectable because of this dilution effect However, despite these resolution limitations, the
Cd and Zn fluxes in 1998 were undoubtedly from the tailings to the overlying water.
Concomitant with this mobilization of Cd and Zn to the overlying water, there was a change in.
solid phase distribution of both these metals, from refractory fractions to more labile fractions.
In contrast, Cu appears to diffuse from the overlying water into the tailings and the magnitude of
the Cu flux was unchanged from 1996 to 1998 (one-way ANOV A, n = 3 (1996 and 1997) and n =
4 (1998), P = 0.69). We considered the possibility that oxidation kinetics for Cu sulfides might
•
differ from those for Cd and Zn sulfides, but could not find convincing evidence in the literature
to support this explanation for the apparent differences in porewater metal profiles. For example,
Simpson et al. (1998) found no significant differences in the oxidation kinetics of Cd, Zn and Cm
sulfides during short-term sediment resuspension events. Given the poor resolution of the in sim
from the uppennost tailings layer). However, it appears unlikely that the near-interface cells in
1he peepers would have consistently missed the subsurface maximum in Cu concentration in
~very peeper deployment, and thus we conclude that there is no evidence for copper mobilization.
Pedersen et al. (1993) concluded that Cu and Zn in Anderson Lake and Cd, Cu and Zn in Buttle
-Lake (pedersen, 1983 ; Pedersen et al., 1991) were not diffusing out of the submerged tailings.
Their conclusions contrast with our 1998 results, which indicate fluxes of Cd and Zn from the
~ailings. The discrepancy might reflect problems with their flux calculations, since their
~oncentrations in the overlying water were not detennined at the same time as their porewater
measurements. Note too, that metal concentrations in the lake water columns were higher than in
tlhe experimental cells. Both their lakes were affected by acid mine drainage so that the overlying
water metal concentrations were higherthan in the present study; for Buttle Lake, Pedersen ~1983) reported bottom water concentrations of 2.6 IlM for Zn, 9.9 nM for Cd and 173 nM for ~u, and up to 6.6 IlM for Zn and 690 nM for Cu in the case of Anderson Lake (Pedersen et al.
~993).
Il should be pointed out that the observed Cd and Zn releases from the submerged tailings are
very small and that the shallow water coyer effectively reduced metal releases from the reactive
tailings. To calculate the impact of the Cd and Zn releases on a hypothetical disposai operation,
t
We assume that the impoundment has a dimension of 1 km x 1.5 km with an average depth of 1 m, giving an overlying water volume of 1.5 x 10⁹ L. We aIso assume that the average water
residence time in the main impoundment will be 1 year and that the fluxes of Zn and Cd to the
Qverlying water are the highest observed, 1.5 x 10⁻⁷ nmol'cm-2's-1 for Zn and 1 x 10⁻⁹
71 moles of Zn per year and 0.47 mole of Cd per year. Using the average residence time of 1 year
and the impoundment water volume, these releases would increase the ovedying water Zn
concentration by 47 nM (3 ppb) and the Cd concentration by 0.31 nM (0.04 ppb). Therefore, Cd and Zn fluxes from the tailings to the overlying water will have only minor impacts on the
5. CONCLUSIONS
• A shallow water coyer (0.3 m) proved effective in reducing the rate of mine tailings
oxidation. DO penetration into the tailings was very shallow
«
7 mm) and 00 consmnption was about 2000 .times lower than in tailings samples exposed to air in humidity test cells.• Progressive oxidation of tailings does occur, however, beneath the interface with the
overlying water. Evidence for this oxidation cornes from the increase in interstitial water
acidity and from indications of
sol-
production just below the interface.• Tailings are a source of
cr
andsoi-
to the overlying water, and concentrations of these anions decreased at depth in the tailings over the two-year study.• The electrochemical micro-profiles have shown that the oxidation occurs ai the mm scale
beneath the tailings-overlying water interface. Two years after tailings disposal under water.,
there was clear evidence for Cd and Zn mobilization from the tailings to the overlying water
with concomitant changes in the solid-phase partitioning of these two metals (refractory -4
more labile fractions). There was no evidence of Cu mobilization from tailings to the
overlying water.
• Finally, the 1996-1998 geochemical evolution of CeUs 1 and 2 is simiiar, except :that the surface tailings layer of CeU 1 has a higher metal content (particularly Zn) BIld
is
more6. ACKNOWLEDGMENTS.
This project was carried out under the auspices of the Canadian "Mine Environment Neutral
Drainage" (MEND) pro gram, managed by Natural Resources Canada (Gilles Tremblay). We thank Stéphane Prémont from INRS-Eau and personnel from Aur Louvicourt Inc. for their
contributions to this field study. Marcia Blanchette and John Kwong from CANMET offered
helpful comments on draft versions of this report, as did Prof essor Thomas Pedersen of the
University of British Columbia (Earth and Ocean Sciences). We also acknowledge the technical
assistance of Michèle Bordeleau, Pauline Fournier, René Rodrigue, Sylvie St-Pierre and Bernard
Veilleux, all from INRS-Eau.
7. REFERENCES
Berg P., Risgaard-Petersen N. and Rysgaard S. (1998) Interpretation of measured concentration profiles in sediment pore water. Limnol. Oceanogr. 43, 1500-1510.
Broecker W.S. and Peng T.H. (1974) Gas exchange rates between air and sea. Tel/us 26, 21-34.
Carignan R., Rapin F. and Tessier A. (1985) Sediment porewater sampling for metal analysis.
Geochim. Cosmochim. Acta 49,2493-2497.
Carignan R., St-Pierre S. and Gachter R (1994) Use of diffusion samplers in oligotrophic lake
t
sediments: Effects offree oxygen in sampler material. Limnol. Oceanogr. 39,468-474.
Cline, J.D. (1969) Spectrophotometric determination of hydrogen sulfide in natural waters. Limnol. Oceanogr. 14, 454-458.
Emerson S., Jacobs L. and Tebo B. (1983) The behavior of trace metals in marine anoxic waters: Solubilities at the oxygen-hydrogen sulfide interface. In Trace Metals in Sea Water,
Wong C.S., Boyle E., Bruland K. W., Burton J.D. and Goldberg E.D. (Eds), Plenum Press, New York, NY, pp. 579-608.
Evangelou V.P. and Zhang Y.L. (1995) A review: Pyrite oxidation mechanisms and acid mine drainage prevention. Crit. Rev. Environ. Sei. Technol. 25, 141-199.
Filion M.P., Sirois L.L. and Ferguson K. (1990) Acid mine drainage research in Canada. CIM
Bull. 83 (944), 33-40.
Geller W., Kapper H. and Salomons W. (1998) Acidic Mine Lakes: Acid Mine Drainage, Limnology and Reclamation, 418 pp., Springer-Verlag. New York, NY.
Huerta-Diaz M.A., Tessier A. and Carignan R. (1998) Geochemistry of trace metals associated with reduced sulfur in freshwater sediments. Appl. Geochem. 13,213-233.
Kleinrnann R.L.P., and Crerar D.A. (1979) Thiobacïllus fè"oxidans and the formation of acidity in simulated coal mine environrnents. Geomicrobiol. J. 1,373-388.
Li M., and St-Arnaud L. (2000) Reactivity assessment and subaqueous oxidation rate modelling for Louvicourt tailings - Final Report. MEND Report No. 2.12.l.d, Natural Resources Canada. CANMET. Mine Environrnent Neutral Drainage Program. Ottawa, ON, Canada.
Li Y.-H. and Gregory S. (1974) Diffusion of ions in sea water and in deep-sea sediments. Geochim. Cosmochim. Acta 38, 703-714.
Papelis C., Hayes K.F. and Leckie J.O. (1988) HYDRAQL: A program for the computation of chemical equilibrium composition of aqueous batch systems including surface complexation modeling of ion adsorption at oxide/solution interface. Tech. Rep., Dept. Civil Eng., Stkford University, Stanford, CA.
Pedersen T.F. (1983) Dissolved heavy metals in a lacustrine mine tailings deposit - Buttle Lake, British Columbia. Mar. Pollut. Bull. 14, 249-254.
Pedersen T.F. and Losher A.J. (1988) Diagenetic Processes in Aquatic Mine tailings deposits in British Columbia. In: Salomons W. and Forstner U., Eds. Chemistry and Biology ofSolid Waste - Dredged Material and Mine Tailings. New-York: Springer-Verlag. pp. 238-258.
Pedersen T.F., Mueller B., McNee 1.J. and Pelletier C.A. (1993) The early diagenesis of submerged sulfide-rich mine tailings in Anderson lake, Manitoba. Can.
J.
Earth Sei. 3~1099-1109.
Pedersen T.F., Mueller B., Pelletier C.A. (1991) On the reactivity of submerged mine UùTmgs:in fjord and lake in British Columbia. In: Gadsby J.W. and Malick J.A., Eds. Acid Mine Drainage: Designing for Closure. Vancouver: Bi Tech Publishers. pp. 281-293.
Rasmussen, H. and Jorgensen, B.B. (1992) Microelectrode studies of seasonal oxygen uptake in a coastal sediment: role of molecular diffusion. Mar. Eco!' Prog. Ser. 81, 289-303.
Simpson S.L., Apte, S.C. and Batley, G.E. (1998) Effect of short-tenn resuspension events on trace metal speGiation in polluted anoxic sediments. Environ. Sei. Technol. 32, 620-625.
Tessier A., Carignan R., Dubreuil B. and Rapin F. (1989) Partitioning of zinc between thewater
column and the oxic sediments in lakes. Geochim. Cosmochim Acta 53, 1511-1.522.
Zhang H. and Davison W. (1995) Perfonnance characteristics of diffusion gradients in thln films for the in situ measurement of trace metals in solution. Anal. Chem. 67,3391-3400.
Table 1. Sequential extraction of metals from surface tailings with (1) MgCh, (2) acetate buffer
at pH 5, (3) NH20H·HCI at room temperature, (4) NH20H·HCI at 96 oC, (5) H202
and (6) HF, HN03 and HCI04• Value are mean ±
sn,
n=
3 (1996) and n=
4 (1998).The 1998 Cd analyses in fractions 5 and 6 were made by ET AAS (in fraction 5 of Cell l,only 1 out of 4 replicates).
-Celll: Solid-phase concentrations ofmetal (mg' kg-I)
Cu Cd Zn Fraction 1996 1998 1996 1998 1996 1998 1 0.8± 0.1 5 ± 1 0.6 ± 0.3 3 ±2 8 ± 4 88 ± 55
(%)
(0.05) (0.3) (2) (12) (0.1) (1) 2 175 ±34 21 ± 4 2 ± 1 6 ±3 670 ± 317 1859 ±857(%)
(11) (1) (7) (23) (9) (28) 3 0.6± 0.3 86 ± 75 0.16 ± 0.09 1.4 ± 0.3 1073 ± 460 374 ± 99(%)
(0.04) (5) (0.5) (5) (14) (6) 4 < 0.08 8 ± 5 2 ± 1 2.8 ± 0.9 585 ± 294 1037 ±419(%)
(0.5) (5) (11) (8) (16) 5 1055 ±194 1353 ±31O 16 ±14 11 ±12 3794 ±3456 2872 ±2854(%)
(66) (85) (45) (45) (50) (43) 6 377 ±2)n 50 ± 7 14 ±16 0.9 ± 0.7 1432 ±1078 411 ±200(%)
(23) (10) (41) (3) (19) (6) Total 1609 ±482 1586 ±274 34 ±32 25 ± 17 7562 ±5295 6640 ±4360Table 1. (cont.) Sequential extraction ofmetals from surface tailings with (1) MgCh, (2) acetate buffer at pH 5, (3) NH20H·HCI at room temperature, (4) NH20H·HCl at 96 oC, (5)
H20 2· and (6) HF, HN03 and HCI04. Value are mean ± SD, n
=
3 (1996) and n=
4 (1998). The 1998 Cd analyses in fractions 5 and 6 were made by ETAAS (in fraction5 of Cel~ 1, only 1 out of 4 replicates).
CelI 2: Solid-phase concentrations ofmetal (mg· kg-Il _. -- -_. -
.-Cu Cd Zn Fraction 1996 1998 1996 1998 1996 1998 1 0.7± 0.1 4 ± 2 0.36± 0.08 0.7 ± 0.1 3.5± 0.7 11± 6
(%)
(0.06) (0.4) (4.6) (10) (0.1) (0.5) 2 118 ±15 12 ± 3 1.3 ± 0.2 2.4 ± 0.7 398 ± 58 658 ±184(%)
(11) (1) (17) (33) (14) (30) 3 0.5± 0.2 54 ± 40 0.09± 0.01 0.7 ± 0.2 655 ± 85 174± 69(%)
(0.05) (5) (1) (IO) (22) (8) 4 <0.08 8 ± 2 0.9 ± 0.1 1.6 ± 0.4 370 ± 45 611 ±173(%)
(0.7) (11) (22) (13) (28) 5 798 ±98 905 ± 17 4.5 ± 0.9 1.6 ± 0.3 1073 ± 199 372 ± 38(%)
(71) (83) (57) (22) (37) (17) 6 204 ±33 111 ± 32 0.7 ± 0.2 0.25 ± 0.07 432 ± 66 359 ± 45•
(%)
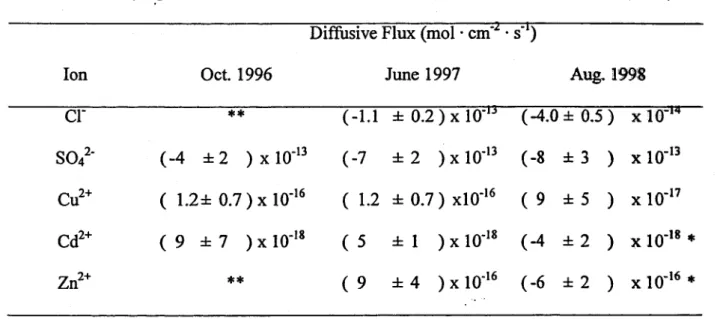
(18) . (1'0) (9) (3) (15) (16) Total 1112 ±81 1094 ± 42 8 ± 1 7 ± 1 2932 ± 384 2185 ±339 .Table 2. CaIculated diffusive flux of ions across the tailings - overlying water interface in Cell
*
**
2. Positive fluxes indicate ions, which diffuse from the overlying water into the
tailings, whereas negative fluxes correspond to diffusion out of the tailings into the
overlying water. VaIue are mean ± SD, n
=
3 (1996 and 1997) and n=
4 (1998). Diffusive Flux (mol' cm-2 • S-l)Ion Oct. 1996 June 1997 Aug.1998
cr
**
( -1.1 ± 0.2 ) x 10-13 (-4.0 ± 0.5) x 10-14sol-
(-4 ±2 ) x 10-13 (-7 ±2 ) x 10-13 ( -8 ±3 ) x 10-13 Cu2+ ( 1.2± 0.7) x 10-16 ( 1.2 ± 0.7) XIO-16 ( 9 ±5 ) x 10-17 Cd2+ ( 9 ±7 ) x 10-18 ( 5 ± 1 ) x 10-18 (-4 ±2 )x 10-
18*
Zn2+**
( 9 ±4 ) x 10-16 ( -6 ±2 ) x 10-16*
One of 4 replicate omitted in the caIculation, the maximum concentrationbeing in the overlying water instead of in the tailings, suggesting displacement of the
peepersduriIm
the equilibration period or an error in fixing the position of the tailings - water interface.
Diffusive fluxes were not caIculated when the concentration gradient was not clearly defmed.
Figure 1. Typical porewater DO concentrations (a) and pH (b) profiles measured with microelectrodes inserted in the tailings (1 mm vertical resolution). The horizontal broken line indicates the tailings - overlying water interface. Each curve is from one insertion of the micro electrode in the tailings using a micromanipulator deployed from a sampling platform at the center of the experimental œIL
(a):
DO
25 20 15 10 5 o -5 -10 June 1997 Aug.1998Cell1
June 1999 June 1999 atnightI
-151
25~====::::;C;:e::::;I;:1
:::;:
;::========~ ~========:::::
.---,
20 15 10 5 o -5 -10 .."...-=.;:or---oo
-15 -!-r-.---.--....--.-.---.--...-r' l--r-'---.--r--T-'---.--..---.-' I-r--.--.--r-T--.--.-,.-,' r-r-r--.--,--,--.--.--...--r' o 2 4 6 8 10 12 14 16 18 0 2 4 6 8 10 12 14 16 18 0 2 4 6 8 10 12 14 16 18 0 2 4 6 8 10 12 14 16 18Figure 1 (continued)
(b): pH
June 1997 Aug.1998 June 1999
25 0 20 15 10 5 0 --6 -10 -15 -20 -25 June 1999 .3) atnight:
l
-35!
25Cel
1
20 15 10 5 0 -6 -10 -15 -20 0'0 -25 .3) -35 7.5 8.0 8.5 9.0 9.5 7.5 8.0 8.5 9.0 9.5 7.5 8.0 8.5 9.D 9.5 7.5 8.0 8.5 9.D aspH
horizontal broken line indicates the tailings - overlying water interface. Each curve is from an individual peeper inserted into the tailings in the experimental ceIl, n = 3 (1996 and 1997) and n
=
4 (1998). 4Cell1
2 o -2 -4 -6 -8 -10 -12 -14 Ê -16 .8. J:.-
c.. CD CI 4Cell 2
2 o -2 -4 -6 -8 -10 -12 -14 -16 Oct. 1996 7.5 8.0 B.5 9.0 9.5 June 1997 Aug.199B~---
-~---7.5 B.O 8.5 9.0 9.5 7.5 8.0 8.5 9.0 9.5 pHFigure 3. Porewater concentration profiles for (a)
cr
(b) SO/- and (c)col-
as sampled by in situ dialysis (1 cm vertical resolution). The horizontal broken line indicates thetailings - overlying water interface. Each curve is from an individual peeper inserted into the .tailings in the experimental ceIl, n
=
3 (1996 and 1997) and n=
4 (1998).(a):
CI
Ê
Oct. 1996 June 1997 Aug.1998
6,---_,r---.r---_.
4Cell1
2 o -2 -4 -6 -8 -10 -12 -14 ~ -16L-______________ ~L _ _ _ _ _ _ _ _ _ _ _ _ _ _ _ _ ~L _ _ _ _ _ _ _ _ _ _ _ _ _ _ ~ ~ 6~---_,r---.r---_.g.
ell 2
Cl 4 2o
-2 -4 -6 -8 -10 -12 -14 -16+---.--,---.--,_~t--_.--_r--._--._~r--,_--.__,.-_.~o
200 400 600 800 0 200 400 600 800 0 200 400 600 800 [Cr] (pM)Figure 3 (continued)
(b):
S04
Oct. 1996 June 1997 Aug.1998
6 4
Cell1
2 0 -2 \:---4 -6 -8 -10 -12-
-14 E 0 -16 ---.r:. 6-
a.Cell2
Q) Cl 4 2 0 -2~---
-~~---4 -6 -8 -10 -12 -14 -16 - ' - r - - - - , - - . . . - - - - . - - l L , - - - . - - - - , - - . . - - - - I L,---r---,--...---J 1000 2000 3000 4000 1000 2000 3000 4000 1000 2000 3000 4000(c):
C0
3 E 0 .r:.-
0-Q) Cl Oct. 1996 Aug. 1998 6 ~~~~---,~---~ell 1
4 2o
-2 -4 -6 -8 -10 -12 -14 -16 6 4 2 0 -2 -4 -6 -8 -10 -12 -14 -16::0---1
/
.,r
!
l' ..
0· v/~
.. 6· Q 0 bCell 2
0.5 1.0 1.5 2.0 2.5 3.0 0.5 1.0 1.5 2.0 2.5 3.0 [C0321 (mM)Figure 4. Porewater H2S concentrations profiles sampled by in situ dialysis (1 cm vertical
resolution, detection limit
=
0.004 flM). The horizontal broken Hne indicates the tailings - overlying water interface. Each curve is from an individual peeper inserted into the .tailings in the experimental cell, n = 3 (1996 and 1997) and n = 4 (1998).6
Cel
1 1
4 2 0 -2 -4 .Q.a
-10 -12'6
-16 -14...
~
6 4 2 0 -2 -4 -6 -8 -10 1 -12 -14 -16 0.0 0.5 Q:t1996
1.0 1.5Aug.1998
-". 0.0 0.5 1.0 1.5 [g2-](aA1sampled by in situ dialysis (1 cm vertical resolution, detection limits = 0.2 IlM and 0.05 JlM for Fe and Mn respectively). The horizontal broken line indicates the tailings - overlying water interface. Each curve is from an individual peeper inserted into the tailings in the experimental cell, n = 3 (1996 and 1997) and n = 4 (1998). In 1998, one aberrant data point for both Fe and Mn, presumably resulting from contamination, was not included in their respective profiles.
(a): Fe
Oct. 1996 June 1997 Aug.1998
6 4 2 0 -2 -4 -6 -8
--
E -10.e
-12 ..c:-
a. 6 QI 4 C 2 0 -2 -4 -6 -8 -10 -12 0.00 5.00 10.00 0.00 5.00 10.00 0.00 5.00 10.00 [Fe] (pM)(b): Mn
6 4 2o
-2 -4 -6 -8 -1011
---:Q;:"~---
fr~ 'f)E
-12~==========~
;::============: '---'
~
: 0!I12
2 -2 -4 -6 -8 -10 ~2~--~----~--~ r----~--~--~r----~--~---'.,
0.00 5.00 10.00 0.00 5.00 10.00 0.00 5.00 1GœFigure 6. Porewater dissolved copper (a) dissolved cadmium (b) and dissolved zinc (c) concentrations profiles sampled by in situ dialysis (1 cm vertical resolution, detection limits
=
3 nM, 0.1 nM and 0.08 !lM for Cu, Cd and Zn respectively). The horizontal broken line indicates the tailings - overlying water interface. Each curve is from an individual peeper inserted into the tailings in the experimental cel~ n=
3 (1996 and 1997) and n = 4 (1998).(a): Cu
Oct. 1996 June 1997 Aug.1998
5
Cell1
4 3 2 -1 -2 -3 -4 -5 -6 --. -7 E -8.e
.s::. -9 ë. 5Cell 2
Q) 0 4T
3 2 0 ---1 -2 -3 -4 -5 -6 -7 -B -9 -10 0 20 40 60 80 100 120 0 20 40 60 80 100 120 0 20 40 60 80 100 120 [Cu] (nM)(b): Cd
Oct. 1996 June 1997 Aug..1998
5
Cell1
4 3 2 0 -1 -2 -3 -4 -5-
-6 E.e
0 5 10 15 20 25 300 5 10 15 20 25 300 5 10 15 20 25 30 .r:.-
0- [Cd] (nM) CI) C 5ell 2
4T
3 2 0 -1 -2 -3 -4 -5 "1 -6 0.0 0.5 1.0 0.0 0.5 1.0 1l5) 1.0 1.5 [Cd] (nM)(c): Zn
Oct. 1996 June 1997 Aug.1998
4