Reprogramming of orientation columns in
visual cortex: a domino effect
Lyes Bachatene1,2, Vishal Bharmauria1,2, Sarah Cattan1,2, Jean Rouat1,2& Ste´phane Molotchnikoff1,2 1De´partement de Sciences Biologiques, Universite´ de Montre´al, Montre´al, QC, Canada, H3C 3J7,2Neurosciences Computationnelles et Traitement Intelligent des Signaux (NECOTIS, De´partement de Ge´nie E´lectrique et Ge´nie Informatique, Universite´ de Sherbrooke, Sherbrooke, Que´bec, Canada, J1K 2R1).
Cortical organization rests upon the fundamental principle that neurons sharing similar properties are co-located. In the visual cortex, neurons are organized into orientation columns. In a column, most neurons respond optimally to the same axis of an oriented edge, that is, the preferred orientation. This orientation selectivity is believed to be absolute in adulthood. However, in a fully mature brain, it has been established that neurons change their selectivity following sensory experience or visual adaptation. Here, we show that after applying an adapter away from the tested cells, neurons whose receptive fields were located remotely from the adapted site also exhibit a novel selectivity in spite of the fact that they were not adapted. These results indicate a robust reconfiguration and remapping of the orientation domains with respect to each other thus removing the possibility of an orientation hole in the new hypercolumn. These data suggest that orientation columns transcend anatomy, and are almost strictly functionally dynamic.
S
ince the seminal investigations of Hubel and Wiesel in 19621, it has been extensively established that thevisual cortex is organized for orientation selectivity in a columnar fashion from pial membrane to the white matter. That is, most neurons assembled in a vertical column are selective to the same axis of orientation in response to an edge presented within their respective receptive field (RF). Indeed, if an electrode penetrates the cortex in an oblique direction, the preferred neuronal orientation rotates in a methodical fashion by about 16.5u for every traveling step of 0.09 mm of the recording tip, as it crosses from one orientation column to the next. Such systematic progression implies that, once a few reference preferred orientations of neurons are determined, it is conceivable to predict the orientation sequence. This organization rests on the notion that columnar organization is an outcome of segregated architecture of inter-neuronal connections leading to a relatively inflexible layout of striate organization. For instance, LGN neurons aligned along an axis connect to a single cortical cell2,3giving rise to the orientation selectivity.
Yet, a few observations4–6have reported that these columnar organizations are highly variable, even in the same
species.
Interestingly, recent experiments showed that following the continuous or frequent application of non-optimal stimuli, orientation in our case (called adapter to which neurons initially responded poorly), neurons change their stimulus selectivity7–14. For orientation, depending on the duration of adaptation, neurons in area 17 shift the peak
of their orientation tuning curve either in the direction of the adapter (attractive shift) or away from the adapter (repulsive shift). Whatever the direction of the shift, the newly acquired optimal orientation presents a two-fold problem. The new selectivity following adaptation may be represented twice inside the hypercolumn, and alternatively, the emergence of a novel preferred orientation creates an orientation hole since the original axis is now deleted.
A basic question then arises: do cells in neighboring columns also shift their optimal orientation even if they were not exposed to the adapting stimulus, in order to restore the uniquely fashioned regularity of orientation processing? Heuristically, this invites another question: does the entire orientation hypercolumn exhibit an altered organization? In other words, are Hubel and Wiesel columns modifiable depending on the stimulation history or, in contrast, do orientation columns retain their original orientation selectivity in spite of the fact that the neighboring column changes its orientation-preference?
Our results allow us to argue that columnar organization is a processing unit rather than an anatomically based structure. The direct implication of our described investigations is that the orientation column organization classically supported by structural connections between neurons in V1 must be reassessed. We demonstrate that original preferred orientations of neurons are changed following local adaptation executed at some distance from tested cells.
OPEN
SUBJECT AREAS: STRIATE CORTEX CORTEX Received 21 October 2014 Accepted 2 March 2015 Published 24 March 2015 Correspondence and requests for materials should be addressed to S.M. (stephane. molotchnikoff@ umontreal.ca)Although shifts in orientation tuning of the adapted cells were described in previous reports9–11, we were particularly interested in
exploring what occurred in the non-adapted cells, i.e., if one group of cells changes its preferred orientation following adaptation, do the cells belonging to other and non-adapted orientation columns change their preferred orientation concurrently as well?
Results
Orientation preference and goodness of fits.In total, 266 cells were recorded in area 17 of anesthetized cats. Neurons were classified into two groups of cells on the basis of their orientation selectivity which was determined by the orientation selectivity index (OSI, see methods). In line with the previous reports8,15–17, neurons having
an OSI superior or equal to 0.4 are classified as sharply tuned cells. This classification led to 218 orientation-selective neurons while 48 cells were broadly tuned. In the present investigation, tuned neurons had an OSI of 0.5 6 0.02 and 0.4 6 0.02 for adapted and non-adapted sites respectively, whereas broadly tuned neurons exhibited an OSI of 0.08 6 0.004 and 0.07 6 0.005 for adapted and non-adapted sites, respectively (Fig. 1a). In addition, we computed the Gaussian fits from the raw tuning curves to precisely compute the preferred orientation (pre- and post-adaptation) thus allowing the calcula-tion of shift of the peak of the orientacalcula-tion tuning curve. For both sites, i.e., adapted and non-adapted, significant differences were observed between tuned (mean R250.73 6 0.1 for adapted sites,
mean R250.76 6 0.1 for non-adapted sites, Fig. 1b) and untuned
neurons (mean R250.23 6 0.1 for adapted sites, mean R250.26 6
0.1 for non-adapted sites, Fig. 1b). Due to their poor orientation selectivity, all untuned cells were excluded from further analyses.
Comparison of the orientation selectivity index for all neurons from adapted and non-adapted sites before and after adaptation was performed. The values were respectively: OSIpre-adaptation 5
0.44 6 0.01 and OSIpost-adaptation50.49 6 0.01 (n 5 218). The
R-squared derived from the Gaussian fits were also computed for both conditions; the R2
pre-adaptation50.7 6 0.008, the R2post-adaptation50.7
60.01 (n 5 218).
Typical results.As expected from previous investigations, peaks of orientation tuning curves shift following visual adaptation in anesthetized cats that were conventionally prepared for recording neurons’ electrical activity. Recorded unit activity was filtered, amplified and displayed on oscilloscope and computer screens. Figure 2 shows the typical results. Three receptive fields (RF) are displayed on the top left. In this example, the center to center distance was 4u between RF’s A and B and 5u between RF’s A and
C. Only RF A was locally adapted (see methods for details), and all three fields were stimulated one-by-one with an identical drifting sine-wave grating patch positioned at the center of each excitatory field (stimuli properties were constant). RF’s B and C are positioned on opposite sides relative to the adapted area. In the first stage, multi-unit orientation tuning curves were determined from recorded cumulative activities (multiunit responses) from all three areas. Each RF was stimulated in isolation, that is, gratings were applied alternatively in each field, and it is important to emphasize that we never stimulated excitatory fields simultaneously, in order to exclude direct cross talk between groups of cells. Additionally, the spon-taneous activity of unstimulated cells remained unchanged when the companion field was excited (see example in Fig. 3c).
In the second phase, the adapting grating was placed within RF A at an orientation 45u off the optimal axis, as determined in the first phase, of this particular field. Other parameters of the sine-wave patch remained unchanged. The adaptation phase lasted 12 minutes without interruption and no stimulation was applied to companion RF’s that remained dark. Single units were isolated from the multi-unit activity and Gaussian tuning curves were computed. The sorted waveforms at each site are displayed in the upper left part of the figure. The adaptation of RF A induced the classical shifts of the peak of the orientation tuning curves of cells belonging to this particular field. Trial-by-trial Pearson correlations of spike-counts (TC) between simultaneously recorded cells were computed in order to ascertain that cells are well isolated (Supplementary Fig. S1).
Figure 2 shows the classical attractive shifts in the adapted field for all three recorded units. This adaptation (adapting orientation indi-cated by downward red arrow head, in all figures; light colors in raw curves indicate error bars in all figures; Gaussian R-squared and OSI’s are shown above each tuning curve) induced a roughly equal attractive displacement of the peak of the orientation tuning curves: 60.49u, 71.04u, and 96.22u for blue, green, and pink cells, respectively (first row, horizontal colored arrows in Fig. 2). However, and quite unexpectedly, neurons belonging to the non-adapted site B (located 4u away) also shifted their respective optimal orientation tuning curves. The orientation tuning curve of the orange neuron shifted in the repulsive direction (68.9u), while red and purple units dis-placed their respective optimal peaks towards the adapter (49.3u and 86.1u for red and purple neurons, respectively, middle row). Cells belonging to the third non-adapted site C (bottom row) also shifted their respective orientation tuning curves (22.1u for sky neu-ron, 38.3u for green neuneu-ron, and 27.4u for gray neuron) in the attract-ive direction, that is, the novel orientation approached the adapter. It is worthwhile to emphasize that, at this site the amplitude of the shift is smaller perhaps due to the larger distance separating both receptive fields (A and C, see Fig. 2 insert). Thus, in spite of the fact that cells excited within RF’s B and C were not adapted, they reacted by show-ing new preferred orientations. Furthermore, the response mag-nitude of the novel optimal orientation was about equal to the strength of the original preferred orientation. Other examples are shown in a supplementary figure (Fig. S2).
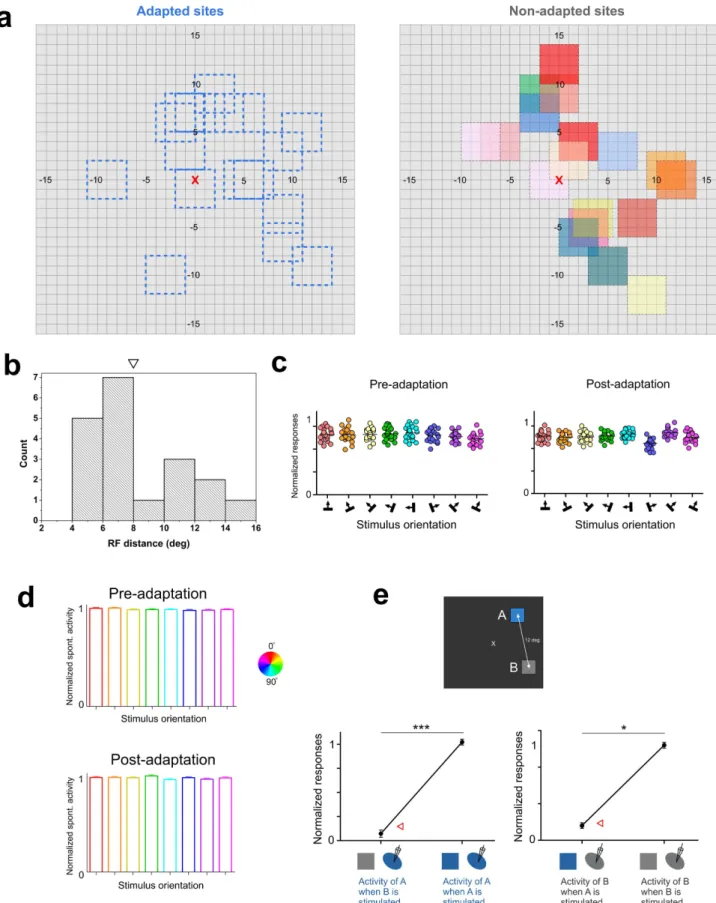
Receptive-fields separation.The excitatory receptive field dimen-sions of the multi-unit activity extended from 2.5u to 4u (average 5 3.8 6 0.4u). All RF’s were centrally located within a 15u radius from fovea (Fig. 3a). The adapting stimulus had equal dimensions and covered the excitatory receptive area. Measurements of receptive field size in area 17 as a function of eccentricity indicate that within a radius of 15u of fovea, RF dimensions rarely extend 5u18,19.
The average distance separating the adapted and non-adapted fields was 8.0 6 3.0u (histogram distribution shown in Fig. 3b, the downward triangle indicates the mean value). Most significantly, the absence of cross-influences between units excited through distant receptive fields was tested by measurement of spontaneous activity because the latter is weak and it readily fluctuates if a stimulus
Figure 1|Orientation selectivity and goodness of fits. (a) Histograms showing the mean values of orientation selectivity indices (OSI’s) for both sites. Significant differences lead to the classification of cells into broadly tuned cells and orientation-selective neurons. (b) Differences of the Gaussian R-squared between tuned and untuned cells in both sites (adapted sites in blue, non-adapted sites in gray).
encroaches on the periphery of the companion receptive field. An example is displayed in Fig. 3c, indicating the levels of spontaneous firing while at the same time when the distant companion RF is stimulated with the selected range of orientations. In this example the distance separating both receptive fields was 6u. The spontaneous firing remained unchanged for all applied orientations (X-axis) and for every trial (a single dot stands for one trial presentation of the sine-wave grating applied for 4.1 s; one-way ANOVA: p . 0.05, Shapiro-Wilk normality test: w 5 0.9, Bartlett’s test for variances: p 5 0.8). The average firing at spontaneous activity in control conditions was 15.8 Hz and in adaptation 15.76 Hz (t-test: p . 0.05, Shapiro-Wilk normality test: w 5 0.9, F 5 1.2). It must also be emphasized that RF’s were never stimulated concurrently (see methods). Thus, RF’s were sufficiently far apart in order to avoid overlapping surrounds. In addition, we observed non-significant differences of spontaneous activity across all the presented orientations within all RF’s when stimulating the adjacent RF’s pre- and post-adaptation (one-way ANOVA: p . 0.05,
Shapiro-Wilk normality test: w 5 0.8, Bartlett’s test for variances: p 5 0.8, Fig. 3d). Another example is illustrated in Fig. 3e. It shows the spiking activity of neurons from one RF (RF A, blue, i.e., non-stimulated) during the stimulation of the adjacent RF (RF B, gray), and during the stimulation of the RF itself (RF A). Conversely, the activity was computed in a similar fashion for RF B when RF A was stimulated, and when RF B was stimulated.
We observed a significant difference between these two conditions for both RF’s (unpaired t-test, p , 0.05, Shapiro-Wilk normality test: w 5 0.9, F 5 1.7, Fig. 3e). Furthermore, stimulating one RF did not modify the firing at spontaneous activity (red arrow, Fig. 3e). This is highly incompatible, had we encroached the boundaries of the com-panion RF.
Preferred orientation stability.It is important to confirm that opti-mal orientations do not fluctuate spontaneously. Many investiga-tions have shown that for any given cell, although response magnitude varies, the preferred orientation remains remarkably
Figure 2|Typical examples of shifts of orientation tuning curve peaks. Tuning shifts are underlined by horizontal colored arrows. The downward red arrow heads indicate the adapting orientation in this and all figures. Upper left insert shows the respective positions of three receptive fields. Only receptive field A was adapted. Waveforms of respective sorted out action potentials are shown below the insert. Tuning curves pre- and post-adaptation are illustrated for each stimulated site (Upper right row: site A, lower left row: site B, lower right row: site C). The curves represent raw data and Gaussian fits. Light colors indicate error bars. Orientations of gratings are depicted on X-axis. OSI’s and R-squared are indicated for each tuning curve.
Figure 3|Location of receptive fields and spontaneous activity. (a) Distribution of adapted (left) and non-adapted (right) receptive fields. Color codes of non-adapted sites correspond to colors of Figure 4a. The receptive field (RF) locations are relative to the fixation point which is underlined by the red cross. (b) Histogram distribution of RF-distances between adapted and non-adapted sites. The downward triangle represents the mean value of RF distance. (c) Absence of spontaneous activity (SA) modulations of one unit when the companion cell is stimulated within its RF at tested orientations. Distance between receptive fields: 6u. The total lack of modulation of SA suggests an absence of overlap between both RF’s. (d) Global results of spontaneous activity of one site while stimulating the adjacent one in both pre- and post-adaptation conditions. (e) Example of multi-unit activity of one RF during the stimulation of the companion RF and during the stimulation of the RF itself. Statistical differences were observed between these conditions. Red triangles indicate the level of spontaneous activity of the RF of interest.
constant for several days3,20,21. Nevertheless, we proceeded with an
additional control by measuring orientation tuning curves of three cells during a four hour period (about 90 min separated each recording session, Fig. 4). Raw responses are shown in Fig. 4a and Gaussian fits for each cell are illustrated in Fig. 4b. While the evoked firing rates vary in amplitude, the optimal response (normalized) is elicited by the same orientation in all three recorded neurons. Following these retests, adaptation (12 minutes) was carried out that resulted in a shift of the peak of the tuning curve (see example in Fig. 4, right, the green cell shifted by 45u in the attractive direction). Shifts in non-adapted sites.Figure 5a illustrates the range of orien-tation shifts on a cell to cell basis (the short horizontal line indicates
the average shifts for a particular cluster of cells). Clusters, i.e., cells recorded from the same site, are identified on the X-axis and the Y-axis indicates shift-range of every unit belonging to non-adapted neurons. In total, 108 units were analyzed. Notice that the first two groups of neurons (labeled ‘‘LS1-135’’ and ‘‘Second attempt’’) are same units tested twice in order to ascertain the consistency of shifts in cells at the non-adapted locus. In this example, the mean magnitudes of shifts were 19.7u (first attempt) and 15.6u (second attempt). Therefore, it can be deduced that orientation shifts at non-adapted sites are the consequence of adaptation executed at some distance from the tested location. Although the average shift-magnitudes were about equal, it should be emphasized that within a single cluster (cells likely to be physically close to each other) some
Figure 4|Tuning stability. (a) Raw tuning curves of three neurons at different time-windows (90 min between control 1, control 2, and control 3). As an additional example, the green cell (right) shows the post-adaptation tuning curve (dashed tuning curve, red arrow head corresponds to the adapting orientation) demonstrating the classical observed tuning shift (horizontal green arrow); Y-axis is the normalized amplitude of the cell’s firing. (b) Gaussian fits derived from raw data. Spike-waveforms for every neuron are shown above the Gaussian curves.
units significantly shifted their preferred orientation, whereas other neighboring cells failed to change their preferred orientation, hence suggesting that orientation changes are specific characteristics belonging to some neurons (cluster LU3 for instance). This last re-sult indicates that changes of orientation may not be attributed to a general surge of excitation (see below). These results corroborate recent reports showing that within a large population of neurons in sensory cortices, there are embedded sub-networks of units whose selectivity is modifiable depending on a particular stimulus protocol22. Such a manifold potential for modification depending on
groups of particular cells leads to the conclusion that within a pool of neurons, a class of cells maintains its initial property (original orientation); while another group of intermingled units has a po-tential to change its optimal stimulating feature to a newly acquired orientation. This heterogeneous organization echoed by dissimilar shifts following adaptation could allow the preservation of an overall stable network yet allowing adaptation to novel conditions of the visual environment.
In Fig. 5b, absolute orientation shifts’ magnitudes are plotted in increasing order for every tested cell (cells are not paired, adapted site 5110; non-adapted site 5 108). The very similar profiles of cumu-lative-type curves of shifts in adapted and non-adapted sites are
indicative that in both sites the peaks of the orientation tuning curves are displaced with equal magnitude. Although the change of orienta-tion in individual cells may vary, the overall mean shift-amplitude is about equal in adapted and non-adapted cells: 42.9u and 37.7u, respectively (Fig. 5c, t-test: p . 0.05, Shapiro-Wilk normality test: w 5 0.9, F 5 1). These data suggest that when a group of neurons modifies its orientation selectivity, some other cells follow the change in an equivalent magnitude. Analogously, it is like the domino effect: once the first block falls the other blocks tilt and fall accordingly. That is, a full set of orientation axes is represented with no orientation-hole. Alternatively, if such collective shifts were deficient, one ori-entation (shifted) would be represented twice since it would closely match an already present axis. Such double presentation of one axis of orientation appears incompatible with the notion that a single hypercolumn contains full range of orientations.
The above results along with data reported in the literature suggest that, following adaptation, the original equilibrium between multiple synaptic drives is ruptured. Consequently a novel optimal orienta-tion arises9,23. In addition, we observed significant changes of another
parameter: the tuning bandwidth. Indeed, the overall bandwidth at half magnitude is significantly narrower after adaptation for both sites (Control: 32.1 6 1.7u; post-adaptation: 26.9 6 1.4u, unpaired
Figure 5|General survey. (a) Shift-magnitude of every neuron in every cluster; Y-axis: shift amplitude, horizontal line: mean-shift for the corresponding cluster. Notice that the recording ‘‘LS1 135’’ is repeated (second attempt). X-axis: cluster code. For sake of clarity, cells recorded from closely positioned electrodes are grouped within one cluster. (b) Cumulative plots of orientation shifts, magnitudes in increasing order; the close parallelism between both curves suggests that in adapted (blue) and non-adapted (gray) cells, the shifts are comparable. (c) The equal average magnitude shifts confirm that there is no difference between adapted and non-adapted sites.
t-test: p , 0.05, Shapiro-Wilk normality test: w 5 0.8, F 5 1.3). This narrowing of the bandwidth following adaptation is coherent with the slight augmentation of the OSI after adaptation as described above.
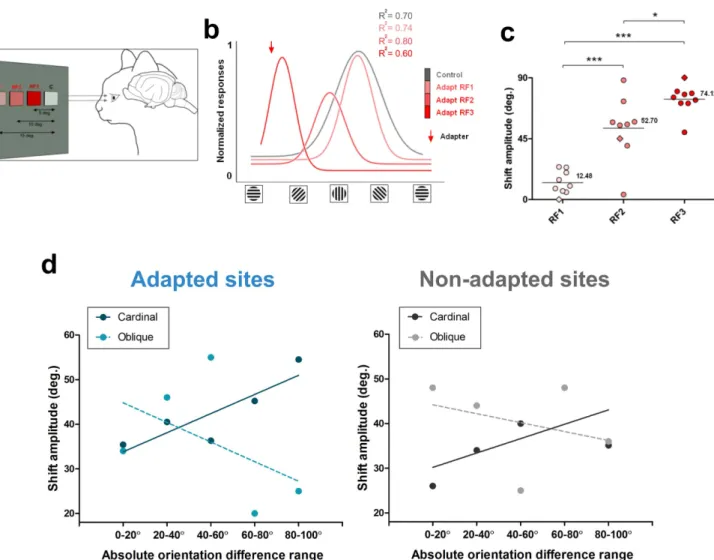
Relationships between magnitude of shifts and inter-RF distance and orientation differences.We then examined the spatial exten-sion of adaptation. We measured the amplitude of shifts in relation to the distance separating the two stimulated loci measured from center to center (Fig. 6a–c). The adapting grating was applied in steps at three distances: 5u, 10u, and 15u from the tested site (Fig. 6a, tested site identified by letter C). When both RF’s were separated by 15u, the tuning curves of neurons were not modified in strong fashion, although the shifts were significant (average shift 5 12.48u). Then, as the adapted field approached the tested field to 10u (RF2), the neurons shifted their optimal orientation with increased amplitude in the attractive direction (average shift 5 52.70u). At the third adapted site (RF3) located 5u off the tested field (RF C), neurons showed an even larger shift, (average shift 5 74.12u) (Fig. 6b, c). Figure 6c shows the distribution of shift amplitudes over a neuro-nal population (n 5 9). It demonstrates the relationships between the
distance separating both RF’s and the shift amplitude (Shapiro-Wilk normality test: w 5 0.8, t-test RF1-RF2, p , 0.05; t-test RF2-RF3, p , 0.05; t-test RF1-RF3, p , 0.05). Thus changes of orientation selectivity spread over a distance of up to 15u.
Previously9it has been reported that in adapted receptive fields
cells tuned to cardinal orientations have larger shift-amplitudes when the orientation difference between the adapter and the original orientation increased. Conversely, cells tuned to oblique orientations exhibited larger shift amplitudes when the orientation difference was small, and shifts decreased as this gap increased. Figure 6d illustrates the shifts magnitudes between adapted and non-adapted sites when cells were grouped in relation to their initial optimal orientation. Thus cells with original cardinal orientations: 90u 6 22u and 0u 6 22u (solid line) were dissociated from cells with initial oblique ori-entation, 45u 6 22u (broken line). Furthermore, for these analyses, neurons were grouped into five 20u orientation classes (Fig. 6d). Interestingly, the same relationships were observed in both adapted and non-adapted sites. These data could signify that in order to maintain constancy of orientation organization following the shifts in the adapted and non-adapted sites, the cortical network rectifies its original orientation layout to maintain its orientation selectivity
dis-Figure 6|Inter-receptive-field distances. (a) Experimental set up of stimulation and visual adaptation in relation to inter-RF distances. (b) Typical example of tuning curves of one neuron, responses normalized. The adapting site was approached in steps of 5u from 15u (RF1) — the largest distance separating both fields to the closest gap: 5u (RF3). The example shows that as the adapting field gets closer to the control receptive field, the stimulated neurons elicited larger shifts of the orientation tuning curve towards the adapter (downward red arrow). (c) Global distribution of the averaged shift-magnitudes in relation to inter-RF distances (same cells in all conditions). (d) Shift-amplitudes in adapted and non-adapted sites in relation to the original preferred orientation prior to adaptation, the broken line represents cells whose initial preferred orientation was oblique, while the solid line stands for units whose initial preferred orientations were cardinal (vertical or horizontal, see text for details). X-axis: absolute orientation differences between preferred orientation and the adapting orientation.
tribution. In other words, a group of neurons in area 17 displaces the peaks of its orientation tuning curve in relation to the orientation of the neighboring neurons as reference axis.
Discussion
The results demonstrate that preferred orientation of neurons in the visual cortex changes following a relatively short period (12 min) of localized adaptation taking place remotely from the tested (non-adapted) receptive field. Data from our experiments have the follow-ing implications: (1) selectivity of orientation organization in area 17 is not attributed to a determined anatomically based and/or onto-genetic layout of a neuronal network. Rather, orientation column design appears to be a labile formation changing its selectivity depending on the history and more generally stimuli conditions exciting neighboring neurons; in other words, local persistent stimu-lus leads to unmapping and remapping of cortical orientation domains (Fig. 7). Thus, a cross-mutual influence may redraw what has been thought to be an immutable organization of the orientation layout. (2) It appears that orientation columns are a functional con-struction rather than strictly anatomical, one based on parallel segregation of input fibers emanating from the retina, and then from the lateral geniculate nucleus (LGN). These results may appear astonishing since orientation columns in the visual system are thought to be rather stable after the critical period that follows birth because coding visual trigger features necessitates highly discrim-inatory neuronal properties24.
Methodological considerations. It may be argued that shifts in orientation are the consequences of spontaneous fluctuations of levels of firing rates. Although such a hypothesis may not be rejected, nonetheless, numerous experimental results argue against this eventuality. Recently, it has been shown that orientation select-ivity in identified units remains stable over several days20. In
addi-tion, it is unlikely that response-changes may be ascribed to random fluctuations of cellular excitability. Several authors have demon-strated that orientation selectivity is invariant3, as the jitter of the
optimal orientation is small (,5u). Finally, the response modulations of cells in the adapted and non-adapted sites are constrained roughly to the adapter and the initial preferred orientations. For instance, evoked responses close to the adapter are augmented while, in para-llel, responses to the original preferred orientation are weakened9;
such dual modulations in opposite directions cannot be reconciled with global fluctuations of excitability. Collectively, all of these arguments indicate that it is very unlikely that the described speci-fic discharge modulations are due to spontaneous surges of excit-ability. Moreover, anesthesia eliminates the impact of attention. Imposing an orientation to a particular neuron for twelve minutes while the animal is paralyzed and anaesthetized is a situation that clearly does not replicate natural conditions. This is a compromise needed to induce neurons to change their preferred orientation. In
many reports, it has been shown that imposing a sensory or appropriately timed electrical stimulus induces neuronal property changes within minutes25–29, which is a time scale congruent with
adaptation duration of the described experiments. Although the change in preferred orientation may last for many minutes30 and
may be ten times longer than adaptation duration7, data suggest
that the brain’s network is dynamic as it is attuned to the environmental conditions. This may imply that functional column changes are transient yet lasting for many minutes.
Twelve minutes of continuous adaptation may raise the question of the duration of recovery. Literature reports that even after two hours following adaptation; only half of the neurons recover their original selectivity7,27,30. Indeed, while capturing the activity of both
sites (adapted and non-adapted) post-adaptation; we started first with the adapted site by presenting it the grating corresponding to the original optimal orientation, thereafter, showing the grating cor-responding to the original optimal of non-adapted site. In a system-atic fashion, after the presentation of these gratings corresponding to the original optimal controls in both sites, we presented the adapter-grating alternatively to both sites (adapted then non-adapted). As evident from our data that most of the neurons exhibited shifts of the tuning curves superior to 10 degrees (both sites) post-adaptation (90% from the adapted sites, 80% from the non-adapted sites, Fig. 5a), thus indicating that they are indeed the result of the adapta-tion process.
Another methodological aspect may be clarified. In order to avoid surround cross-influence between the receptive fields, neurons sti-mulated by each site were never excited simultaneously (see Fig. 8). In this study, the average distance separating the adapted and non-adapted fields was 8.0 6 3.0u. It has been shown that far-surround radius in V1 averaged 5.5 6 2.64u31. This reduces the probability of
extensive overlapping of both RF’s. To our knowledge, no study has demonstrated that stimulating the surround of RF affects the ori-entation selectivity of neurons. Rather, the stimulation of the peri-phery results in the modulation of the firing rate (see Fig. 6b). Furthermore, as mentioned above, the spontaneous activity of each RF was never affected by the stimulation of the companion RF. Mechanisms.Our results are supported by several recent reports. In mouse it has been demonstrated that a single dendritic branch exhi-bits, over a short distance, synaptic inputs with a large spectrum of orientation channels allowing mutual influences32. Whole-cell
recording in rodent V1 shows large sub-threshold depolarization evoked by non-preferred orientations33–35. After adaptation, the
impact of an applied orientation takes over the cell’s excitability causing the emergence of a novel optimal orientation due to a specific excitatory drive, wherein one input dominates over other inputs, thus, driving the synaptic strength above threshold that provides the cell its orientation selectivity. Recently in human, it was demonstrated that when the neuronal processing is disturbed,
Figure 7|Schematic model illustrating cortical reorganization following visual adaptation. ‘‘Ice cube’’ model exhibiting orientation columns. After adaptation, a tilt of orientation axis is displayed. Notice an absence of orientation hole.
another cortical area takes over the task to maintain subject perfor-mance36. These investigations, although at different levels, suggest
that single cells or cortical areas may modify their destined commit-ment to specific functions or tasks following changing conditions, and thus shift the responses to new stimulating environments37. The
above assumptions are supported by recent reports describing ‘‘classes of neurons that accumulate information from an entire cortical column and broadcasts outputs to distant targets’’22.
Neurons in the primary visual cortex receive polysynaptic inputs not only from neighboring cells, but also from a network of distal cortical sites. Indeed, feed-forward and feedback connections are extensive. Thus, area 17 neurons’ preferred orientations are not exclusively resulting from feed-forward inputs originating from aligned lateral geniculate nucleus cells2, since elicited responses are
also influenced by long-range connections38,39. In particular, the cat’s
secondary visual cortex (area 18) exhibits strong reciprocal relations with area 1740, which relays parvocellular inputs to area 18. Monier et
al.25demonstrated by recording membrane potentials intracellularly
that a single cortical cell is receiving inputs from a large variety of synaptic inputs. They came to the conclusion that the diversity of input combinations may be reflected in homogeneities of intra-cor-tical patterns of connectivity leading to changeable properties. It is to be expected that once the adaptation modifies the balance between inputs and specifically the gradient between excitatory and inhibitory synaptic weights, the neurons become susceptible to exhibit a novel optimal orientation. Because of the extensive intra-cortical network a particular neuron that modifies its selectivity influences other cells with which it is directly or indirectly connected, thus contributing to modifications of the orientation selectivity of an entire network (Fig. 7). Such neuronal dynamics have been described in the auditory cortex41.
In conclusion, our results strongly suggest that orientation select-ivity is a rapidly modifiable characteristic that is adjusted by specific neurons depending on the behavior of cells surrounding the tested neurons. Thus, orientation columns transcend anatomy, and are functionally dynamic entities.
Methods
Ethical approval.Animal surgery and electrophysiological procedures followed the guidelines of the Canadian Council on Animal Care and were approved by the Institutional Animal Care and Use Committee of the University of Montreal. Animals were supplied by the Division of Animal Resources of the University of Montreal.
Animal preparation.Electrophysiological recordings were performed using multielectrodes within area 17 of adult domestic cats. Adult cats (2.5–3.5 kg, age 12– 24 months) of either sex, sedated with acepromazine maleate (Atravet, Wyeth-Ayerst, Guelph, ON, Canada; 1 mg kg21, intramuscular) and atropine sulfate (ATRO-SA,
Rafter, Calgary, AB, Canada; 0.04 mg kg21, intramuscular), were anaesthetized with
ketamine hydrochloride (Rogarsetic, Pfizer, Kirkland, QC, Canada; 25 mg kg21,
intramuscular) maintained with 0.3% isoflurane (AErrane, Baxter, Toronto, ON, Canada). Lidocaine hydrochloride (Xylocaine, AstraZeneca, Missis-sauga, ON, Canada; 2%) was injected subcutaneously as a local anaesthetic during surgery. A tracheotomy was performed for artificial ventilation, and one forelimb vein was cannulated to administer a nutritive solution containing a paralyzing agent. Animals were then placed in a stereotaxic apparatus. Xylocaine gel (Astra Pharma, Mississauga, ON, Canada; 5%) was applied on the pressure points. For the remaining preparations and recording, paralysis was induced with 40 mg and maintained with 10 mg kg21h21gallaminetriethiodide (Flaxedil, Sigma Chemical, St. Louis, MO, USA;
intravenous) administered in 5% dextrose lactated Ringer’s nutritive solution. General anaesthesia was maintained by artificial ventilation with a mixture of N2O/ O2(70530) supplemented with 0.5% isoflurane (AErrane, Baxter, Toronto, ON, Canada) for the duration of the experiment. Proper depth of anaesthesia was ensured throughout the experiment by monitoring the EEG, the electrocardiogram and expired CO2. In addition the heart rate remained unmodified after skin stimulation. The end-tidal CO2partial pressure was kept constant between 25 and 30 mmHg. A heating pad was used to maintain a body temperature of 37.5uC. Tribrissen (Schering-Plough, Pointe-Claire, QC, Canada; 30 mg kg21per day, subcutaneous) and
Duplocillin (Intervet, Withby, ON, Canada; 0.1 ml kg21, intramuscular) were
administered to the animals to prevent bacterial infection. The pupils were dilated with atropine sulfate (Isopto-Atropine, Alcon, Mississauga, ON, Canada; 1%) and the nictitating membranes were retracted with phenylephrine hydrochloride (Mydfrin, Alcon, Mississauga, ON, Canada; 2.5%). The loci of the area centrales were inferred from the positions of the blind spots, which were ophthalmoscopically focused and back projected onto a translucent screen. Plano contact lenses with artificial pupils (5 mm diameter) were placed on the cat’s eyes to prevent the cornea from drying (University of Montre´al, PQ, Canada).
At the end of each experiment, euthanasia was achieved with a lethal dose of pentobarbital sodium (Somnotol, MTC Pharmaceuticals, Cambridge, ON, Canada; 100 mg kg21) by intravenous injection.
Electrophysiology and visual stimulation.Neurons from several recording sites in layers 2/3 were simultaneously recorded. Electrodes were lowered either tangentially (with a 20–30u angle, tetrode arrangements) or vertically (four electrodes, inter-electrode separation: 400 mm, Frederick Haer & Co, Bowdoinham, ME, USA; 2– 10 MV at 1 kHz). The signal from the microelectrodes was amplified, band-pass filtered (300 Hz–3 kHz), digitized, and recorded with a 0.05 ms temporal resolution (Spike2, CED, Cambridge, England). In all cases at least two excitatory receptive fields were outlined. We paid particular consideration that surrounds of receptive fields were not overlapping.
Firstly, in order to minimize direct cross-influence between both sites, respective cells were never stimulated at the same time (Fig. 8). Secondly, the spontaneous spiking activity of each neuronal population belonging to one RF was recorded during the stimulation of the adjacent RF (see results). Finally, the surround influence in
Figure 8|Visual stimulation and adaptation protocols. Upper part: initial stimulation (control). Lower part: adaptation process and post-adaptation recordings.
responses evoked from excitatory area could modulate the magnitude of responses but the neuronal selectivity remained unaffected (see Fig. 6b).
Each site was stimulated with drifting sine-wave grating patches covering the excitatory fields (Spatial Frequency 5 0.24 cycle/u, Temporal frequency 5 1.0– 2.0 Hz, Contrast 5 80%). Cells were sequentially stimulated in pseudorandom pre-sentation of gratings. The grating was placed in the center of the aggregate RF of the sampled units. We measured tuning with eight equally spaced orientations (22.5u interval) of the drifting sinusoidal grating. It is to be underlined that the gratings were presented only for one direction. Stimuli were presented in each receptive field in isolation, thus each group of cells was stimulated alternatively in order to eliminate direct cross influence between neurons (Fig. 8). Adapting and stimulating gratings were identical in size and characteristics. Prior to adaptation, respective tuning curves were obtained revealing the preferred orientation in each site that elicited the max-imal firing rates. In the following step, only one site was adapted by applying a non-preferred orientation up to 90u off the initial non-preferred orientation of the neurons (usually evoking a weak response) continuously for twelve minutes. While the adaptation happened over one site, the second site was unstimulated. After adapta-tion, orientation tuning curves were re-investigated in the same manner as before adaptation.
Cell isolation.Given that the multi-unit activity was recorded concurrently from the same tips using multi-electrodes, it was essential to ascertain that cells were well isolated, because the same unit may exhibit sufficiently different waveforms (for instance, magnitude in relation to distance between recording tip), and thus belong to different clusters in principal component analysis.
Cell-separation was based on spike-waveforms, cluster-isolation using first prin-cipal components analyses, autocorrelograms, and trial-count correlation (TC). No more than 5 cells were recorded from the same electrode tip. TC denotes the trial by trial Pearson correlation-coefficient between simultaneously recorded firing of two neurons in response to the presentation of an identical stimulus. In response to the presentation of the same stimulus, the same unit fires identically, regardless of spike amplitude. In order to eliminate such occurrences we correlated neural activities of every cell-pair for every applied trial (25 trials, same stimulus, duration 4.1 s). Since optimal orientations eliciting maximal firing rates were chosen for this computation, and considering a relatively long time-window of analyses (4.1 s), we should expect a high value for correlation if it were the same unit, because such time windows of analyses are sufficiently large to capture the full strength of correlation. Indeed, correlations are underestimated if the counting window is too short. In all analyzed cells the TC was extremely weak (TC , 0.3). Such extremely feeble TC establishes that both spike trains do not originate from the same neuron (see Supplementary Fig. S1). Autocorrelograms preclude contamination by spikes of other units. Anesthesia and paralysis of animals reduced the possibility of similar modulations of firing patterns in cells of the same clusters due to rapid eye motion or attention.
Data analysis.Once single cells were sorted out off-line from multi-unit spike trains accumulated during data acquisition, Gaussian tuning curves were constructed from raw data. We fitted our raw data with the Gaussian function to determine with precision the preferred orientation of neurons and then measured shifts in orientation preference. We used the following Gaussian function:
y~y0z A wpffiffiffiffiffiffiffiffip=2 ! :e{2x{xc w ð Þ2 ðEquation1Þ where y0 is the offset, Xc is the center, w is the width, and A represents the area under the Gaussian fit.
The shifts of peaks of tuning curves between pre- and post-adaptation conditions were calculated from the Gaussian fits using the following formula:
Shift~ Xc post{Xc prej j ðEquation2Þ where Xc is the central value derived from the Gaussian fit.
Orientation selectivity index (OSI) was calculated from data as the difference between firing rate (FR) at preferred and orthogonal orientations as follows:
OSI~FR pref {FR ortho
FR pref zFR ortho ðEquation3Þ The closer the OSI is to one, the stronger the orientation selectivity (see results).
It has been shown previously that averaged shifts inferior to 5u were not signifi-cant9, however we consider all the shifts in the present investigation.
One-way ANOVA (95% confidence limit) statistical tests were used to compare the spontaneous firing activity between all presented stimuli. Statistical comparisons were performed using unpaired sample two-tailed t-test (95% confidence limit) for unpaired data. Shapiro-Wilk normality test (significance threshold 5 0.05) was used for the normal distribution of data, and Fisher test to compare variances for all student tests.
Bartlett’s test was performed to compare variances for ANOVA tests.
1. Hubel, D. H. & Wiesel, T. N. Receptive fields, binocular interaction and functional architecture in the cat’s visual cortex. J Physiol. 160, 106–154 (1962).
2. Jin, J., Wang, Y., Swadlow, H. A. & Alonso, J. M. Population receptive fields of ON and OFF thalamic inputs to an orientation column in visual cortex. Nat Neurosci. 14, 232–238 (2011).
3. Henry, G. H., Bishop, P. O., Tupper, R. M. & Dreher, B. Orientation specificity and response variability of cells in the striate cortex. Vision Res. 13, 1771–1779 (1973). 4. Horton, J. C. & Adams, D. L. The cortical column: a structure without a function.
Philos Trans R Soc Lond B Biol Sci. 360, 837–862 (2005).
5. Kaas, J. H., Krubitzer, L. A. & Johanson, K. L. Cortical connections of areas 17 (V-I) and 18 (V-I(V-I) of squirrels. J Comp Neurol. 281, 426–446 (1989).
6. Swindale, N. V., Shoham, D., Grinvald, A., Bonhoeffer, T. & Hubener, M. Visual cortex maps are optimized for uniform coverage. Nat Neurosci. 3, 822–826 (2000). 7. Dragoi, V., Sharma, J. & Sur, M. Adaptation-induced plasticity of orientation
tuning in adult visual cortex. Neuron 28, 287–298 (2000).
8. Dragoi, V., Rivadulla, C. & Sur, M. Foci of orientation plasticity in visual cortex. Nature 411, 80–86 (2001).
9. Ghisovan, N., Nemri, A., Shumikhina, S. & Molotchnikoff, S. Long adaptation reveals mostly attractive shifts of orientation tuning in cat primary visual cortex. Neuroscience 164, 1274–1283 (2009).
10. Ghisovan, N., Nemri, A., Shumikhina, S. & Molotchnikoff, S. Visual cells remember earlier applied target: plasticity of orientation selectivity. PloS one 3, e3689 (2008).
11. Kohn, A. Visual adaptation: physiology, mechanisms, and functional benefits. J Neurophysiol. 97, 3155–3164 (2007).
12. Kohn, A. & Movshon, J. A. Adaptation changes the direction tuning of macaque MT neurons. Nat Neurosci. 7, 764–772 (2004).
13. Krekelberg, B., van Wezel, R. J. & Albright, T. D. Adaptation in macaque MT reduces perceived speed and improves speed discrimination. J Neurophysiol. 95, 255–270 (2006).
14. Hietanen, M. A., Crowder, N. A., Price, N. S. & Ibbotson, M. R. Influence of adapting speed on speed and contrast coding in the primary visual cortex of the cat. J Physiol. 584, 451–462 (2007).
15. Atallah, B. V., Bruns, W., Carandini, M. & Scanziani, M. Parvalbumin-expressing interneurons linearly transform cortical responses to visual stimuli. Neuron 73, 159–170 (2012).
16. Ringach, D. L., Shapley, R. M. & Hawken, M. J. Orientation selectivity in macaque V1: diversity and laminar dependence. J Neurosci. 22, 5639–5651 (2002). 17. Denman, D. J. & Contreras, D. The structure of pairwise correlation in mouse
primary visual cortex reveals functional organization in the absence of an orientation map. Cereb Cortex. 24, 2707–2720 (2014).
18. Freeman, J. & Simoncelli, E. P. Metamers of the ventral stream. Nat Neurosci. 14, 1195–1201 (2011).
19. Orban, G. A., Kennedy, H. & Bullier, J. Velocity sensitivity and direction selectivity of neurons in areas V1 and V2 of the monkey: influence of eccentricity. J Neurophysiol. 56, 462–480 (1986).
20. Lutcke, H., Margolis, D. J. & Helmchen, F. Steady or changing? Long-term monitoring of neuronal population activity. Trends Neurosci. 36, 375–384 (2013). 21. Frenkel, M. Y. et al. Instructive effect of visual experience in mouse visual cortex.
Neuron 51, 339–349 (2006).
22. Harris, K. D. & Mrsic-Flogel, T. D. Cortical connectivity and sensory coding. Nature 503, 51–58 (2013).
23. Bachatene, L., Bharmauria, V., Cattan, S. & Molotchnikoff, S. Fluoxetine and serotonin facilitate attractive-adaptation-induced orientation plasticity in adult cat visual cortex. Eur J Neurosci. 38, 2065–2077 (2013).
24. Shtoyerman, E., Arieli, A., Slovin, H., Vanzetta, I. & Grinvald, A. Long-term optical imaging and spectroscopy reveal mechanisms underlying the intrinsic signal and stability of cortical maps in V1 of behaving monkeys. J Neurosci. 20, 8111–8121 (2000).
25. Monier, C., Chavane, F., Baudot, P., Graham, L. J. & Fregnac, Y. Orientation and direction selectivity of synaptic inputs in visual cortical neurons: a diversity of combinations produces spike tuning. Neuron 37, 663–680 (2003).
26. Fregnac, Y. et al. A Re-Examination of Hebbian-Covariance Rules and Spike Timing-Dependent Plasticity in Cat Visual Cortex in vivo. Front Synaptic Neurosci. 2, 147 (2010).
27. Godde, B., Leonhardt, R., Cords, S. M. & Dinse, H. R. Plasticity of orientation preference maps in the visual cortex of adult cats. Proc Natl Acad Sci U S A. 99, 6352–6357 (2002).
28. Schuett, S., Bonhoeffer, T. & Hubener, M. Pairing-induced changes of orientation maps in cat visual cortex. Neuron 32, 325–337 (2001).
29. Yao, H., Shi, L., Han, F., Gao, H. & Dan, Y. Rapid learning in cortical coding of visual scenes. Nat Neurosci. 10, 772–778 (2007).
30. Nemri, A., Ghisovan, N., Shumikhina, S. & Molotchnikoff, S. Adaptive behavior of neighboring neurons during adaptation-induced plasticity of orientation tuning in VI. BMC Neurosci. 10, 147 (2009).
31. Shushruth, S., Ichida, J. M., Levitt, J. B. & Angelucci, A. Comparison of spatial summation properties of neurons in macaque V1 and V2. J Neurophysiol. 102, 2069–2083 (2009).
32. Jia, H., Rochefort, N. L., Chen, X. & Konnerth, A. Dendritic organization of sensory input to cortical neurons in vivo. Nature 464, 1307–1312 (2010). 33. Lien, A. D. & Scanziani, M. Tuned thalamic excitation is amplified by visual
34. Li, Y. T., Ibrahim, L. A., Liu, B. H., Zhang, L. I. & Tao, H. W. Linear transformation of thalamocortical input by intracortical excitation. Nat Neurosci. 16, 1324–1330 (2013).
35. Van Hooser, S. D., Heimel, J. A., Chung, S. & Nelson, S. B. Lack of patchy horizontal connectivity in primary visual cortex of a mammal without orientation maps. J Neurosci. 26, 7680–7692 (2006).
36. Zanto, T. P., Chadick, J. Z., Satris, G. & Gazzaley, A. Rapid functional reorganization in human cortex following neural perturbation. J Neurosci. 33, 16268–16274 (2013).
37. Reid, R. C. From functional architecture to functional connectomics. Neuron 75, 209–217 (2012).
38. Ringach, D. L. Haphazard wiring of simple receptive fields and orientation columns in visual cortex. J Neurophysiol. 92, 468–476 (2004).
39. Gilbert, C. D. & Wiesel, T. N. Columnar specificity of intrinsic horizontal and corticocortical connections in cat visual cortex. J Neurosci. 9, 2432–2442 (1989). 40. Bullier, J., McCourt, M. E. & Henry, G. H. Physiological studies on the feedback connection to the striate cortex from cortical areas 18 and 19 of the cat. Exp Brain Res. 70, 90–98 (1988).
41. Froemke, R. C., Merzenich, M. M. & Schreiner, C. E. A synaptic memory trace for cortical receptive field plasticity. Nature 450, 425–429 (2007).
Acknowledgments
This study was supported by grants to S.M. (NSERC, FQRNT).
Author contributions
L.B., V.B. and S.C. contributed equally to this work. S.M. designed the study, contributed to data analyses and wrote the manuscript. J.R. contributed to data analyses.
Additional information
Supplementary informationaccompanies this paper at http://www.nature.com/ scientificreports
Competing financial interests:The authors declare no competing financial interests. How to cite this article:Bachatene, L., Bharmauria, V., Cattan, S., Rouat, J. & Molotchnikoff, S. Reprogramming of orientation columns in visual cortex: a domino effect. Sci. Rep. 5, 9436; DOI:10.1038/srep09436 (2015).
This work is licensed under a Creative Commons Attribution 4.0 International License. The images or other third party material in this article are included in the article’s Creative Commons license, unless indicated otherwise in the credit line; if the material is not included under the Creative Commons license, users will need to obtain permission from the license holder in order to reproduce the material. To view a copy of this license, visit http://creativecommons.org/licenses/by/4.0/