UNIVERSITÉ DE SHERBROOKE Faculté de génie
Département de génie chimique et de génie biotechnologique
Quiescent and flow-induced crystallization of
poly(lactic acid)
La cristallisation statique et induite par écoulement
du poly(acide lactique)
Thèse de doctorat
Spécialité : génie chimique et de génie biotechnologique
Amirjalal Jalali
Jury: Prof. Michel Huneault (directeur) Prof. Saïd Elkoun (codirecteur) Prof. Mathieu Robert
Dr. Pascal Vuillaume Prof. Jocelyn Veilleux
i
RÉSUMÉ
Le poly(acide lactique), PLA, est un polymère biocompatible et biodégradable, qui peut être produit à partir de ressources renouvelables. En conséquence, il a soulevé une attention toute particulière en tant que remplacement éventuel des polymères à base de pétrole. C’est un polyester aliphatique ayant des propriétés telles que module élevé, haute résistance, biocompatibilité et est donc un matériau prometteur pour diverses applications telles que les implants, l’encapsulation de médicaments et l'emballage. A cause de sa faible température de transition vitreuse, le PLA a une faible résistance thermique et les applications sont donc limitées à celles qui ne sont pas associées à des températures élevées. En outre, ce polymère souffre d'un faible degré de cristallinité. L'augmentation du taux de cristallinité dans de nombreuses techniques de mise en forme, telles que le moulage par injection, est nécessaire. Il y a plusieurs façons d'augmenter le niveau de cristallinité du PLA. Ces procédés comprennent l'utilisation d'agents nucléants, de plastifiants, ou de combinaisons d'agents plastifiants et de nucléation. La cristallisation du PLA à l'état fondu se présente sous deux formes cristallines légèrement différentes connues sous les noms α et α'. Cette étude compare la capacité d'auto-nucléation de ces deux formes cristallines par auto-nucléation. Ceci est réalisé en comparant les températures de cristallisation lors du refroidissement des échantillons préalablement cristallisés à diverses températures, puis de nouveau chauffé à une température dans la plage de fusion partielle du PLA. Dans la deuxième étape, l'effet des paramètres cinétiques et le poids moléculaire du PLA sur l'efficacité de nucléation des PLA phases cristallines a été étudié. Cette partie de l’étude ouvre une nouvelle voie pour comprendre le rôle des modifications cristallines du PLA qui mènent aux conditions optimales pour la cristallisation du PLA. La mise en forme des polymères implique des contraintes de cisaillement et d’élongation, ce qui implique une cristallisation induite par l’écoulement et la solidification qui s’en suit. Les propriétés mécaniques des produits finals dépendent du degré de cristallisation et de la nature des cristaux formés. Par conséquent, l'optimisation du procédé nécessite une bonne compréhension de la façon dont l’écoulement influence la cristallisation. Le type d'écoulement peut jouer un rôle important sur la cristallisation. Par exemple, l'écoulement élongationnel provoque l’orientation et l’étirement des molécules dans le sens de l'extension, comme dans le cas de la mise en forme de fibres et le soufflage de film, en aidant le processus de cristallisation induite par l'écoulement. Une littérature abondante existe sur la
ii
d'attention a été accordée à l'effet de l'écoulement de cisaillement et d'allongement sur la cristallisation du PLA. Comme étudié dans la dernière partie de ce document, l'effet du poids moléculaire sur la cristallisation induite par cisaillement du PLA est rapporté. Pour cela, trois différents PLA à faible, moyen et haut poids moléculaire ont été préparés par réaction d'hydrolyse. Ensuite, en utilisant un rhéomètre oscillatoire, l’effet du cisaillement sur la cinétique de cristallisation du PLA a été examiné.
Mots -clés: Poly(acide lactique), la cristallisation, l'auto-nucléation, la cristallisation induite
iii
SUMMARY
Poly(lactic acid), PLA, is a biocompatible and biodegradable polymer that can be produced from renewable resources. As a result, it has raised particular attention as a potential replacement for petroleum-based polymers. It is an aliphatic polyester with properties such as high modulus, high strength, and biocompatibility and is thus a promising material for various applications such as implants, drug encapsulation, and packaging. In the wake of low glass transition temperature, PLA has a low heat resistance and its application is limited to those not associated with high temperatures. In addition, this polymer suffers from a low degree of crystalinity. Increasing the crystallization rate in many processing operations, such as injection molding, is required.
So far, many routes have been found to improve the crystallinity of PLA. These methods include using nucleating agents, plasticizers, and combination of nucleating agents and plasticizers together. PLA crystallization in the melt state results in two slightly different crystalline forms known as α and α’forms. This thesis compares the self-nucleation ability of these two crystal forms by self-nucleation. This is achieved by comparing crystallization temperatures upon cooling for samples previously crystallized at various temperatures and then re-heated to a temperature in the partial melting range for PLA. In the second step, we study the effect of molecular weight of PLA on the nucleation efficiency of PLA crystalline phases. This part of the investigation opens a new pathway to understand the role of PLA crystalline phases on the optimal condition for its crystallization kinetics.
Polymer processing operations involve mixed shear and elongational flows and cause polymer molecules to experience flow-induced crystallization during flow and subsequent solidification. The mechanical properties of the final products are significantly dependent upon the degree of crystallization and types of formed crystals. Therefore, optimization of any polymer process requires a good understanding of how flow influences crystallization. The type of flow can play a significant role in affecting crystallization. For example, elongational flow causes molecules to orient and stretch in the direction of extension, as in the case of fiber spinning and film blowing, helping the process of flow-induced crystallization. An extensive body of literature exists on flow-induced crystallization of conventional thermoplastics. Having said that, less attention has been paid to the effect of shear and elongational flow on the PLA crystallization kinetics. As investigated in the final part of this thesis, the effect of
iv
medium and high molecular-weight PLAs were prepared from a high molecular weight one by a hydrolysis reaction. Next, by means of a simple rotational rheometry, effect of the shear flow was examined on the crystallization kinetics of these three PLAs.
Key words: Poly(lactic acid), crystallization, self-nucleation, flow-induced crystallization.
v
ACKNOWLEDGEMENT
Firstly, I would like to express my sincere gratitude to my advisor Prof. Michel Huneault for the continuous support of my Ph.D. study and related research, for his patience, motivation, and immense knowledge. I am also thankful to him for encouraging the use of correct grammar and consistent notation in my writings and for carefully reading and commenting on countless revisions of this thesis. I could not have imagined having a better advisor and mentor for my Ph.D. study.
My gratitude is to my co-advisor, Prof. Saïd Elkoun. I have been fortunate to have a co- advisor who gave me the freedom to question thoughts and express ideas. His patience and support helped me overcome many crises and finish this dissertation.
Dr. Shant Shahbikian is one of the best friends that I have had in my life. He sets high standards for his work and he encourages and guides all his colleagues to meet those standards. He introduced me to rheometry and his teachings inspired me to work on rheology profoundly. I am indebted to him for his continuous encouragement and guidance.
I am grateful to Florent Gauvin, Christian Lubombo and Thomas Mazerolles for their encouragement and practical advice for the French abstracts of my thesis. I am also thankful to them for reading my abstracts; commenting on my views and helping me understand and enrich my French.
I thank my fellow labmates for the stimulating discussions, for working together and for all the fun that we have had in the last four years.
Most importantly, none of this would have been possible without the love and patience of my family. My immediate family, to whom this dissertation is dedicated to, has been a constant source of love, concern, support and strength all these years. I warmly appreciate the generosity and understanding of my family.
vi
TABLE OF CONTENTS
RÉSUMÉ ... i SUMMARY ... iii ACKNOWLEDGEMENT ... v LIST OF FIGURES ... xi LIST OF TABLES ... xvLIST OF SYMBOLS ... xvi
LIST OF ACRONYMS ... xix
CHAPTER 1 INTRODUCTION ... 1
1.1 Research questions and objectives ... 2
1.2 Thesis organization ... 3
1.3 Original contribution ... 3
CHAPTER 2 LITERATURE SURVEY ... 5
2.1 Preface ... 5
2.2 Lactic acid and lactide ... 5
2.3 Polymer crystallization ... 6
2.4 PLA crystalline phases ... 8
2.5 PLA multiple melting behavior ... 12
2.6 Stereocomplex PLA ... 14
2.6.1 Blending ratio ... 15
2.6.2 Molecular weight ... 16
2.6.3 Optical purity ... 16
2.7 Enhancing PLLA crystallization by nucleating agents... 17
2.7.1 Talc ... 17
2.7.2 Clay ... 19
2.7.3 Bio-based nucleating agents ... 20
2.7.4 Organic nucleants ... 23
2.7.5 Other nucleants ... 25
2.8 Enhancing PLLA crystallization by plasticizers ... 28
2.9 Enhancing PLA crystallization by combination of a nucleating agent and a plasticizer 30 2.10 Self-nucleation ... 32
TABLE OF CONTENTS
2.11 Shear-induced crystallization of PLA ... 35
CHAPTER 3 Effect of Thermal History on Nucleation and Crystallization of PLA ... 41
3.1 Abstract ... 43 3.2 Introduction ... 44 3.3 Experimental ... 46 3.3.1 Materials ... 46 3.3.2 Sample preparation ... 46 3.3.3 Characterization ... 46
(i) Thermal behavior: Differential scanning calorimetry ... 46
(ii) Microstructure analysis: Wide-Angle X-ray Diffraction Analysis (WAXD) ... 47
(iii) Isothermal crystallization: Hot-stage and Optical Microscopy ... 47
3.4 Results and discussion ... 47
3.4.1 PLA self-nucleation: cooling rate and thermal protocol effect ... 47
3.4.2 Isothermal crystallization at 80 °C... 49
3.5 Effect of crystalline phase on self-nucleation ... 52
3.5.1 Crystalline structure ... 52
3.5.2 Self-nucleation of (α’+ α) and α phases ... 53
3.6 Effect of Tic on the nuclei density... 55
3.7 Microstructure analysis by WAXD ... 60
3.8 DSC heating curves ... 61
3.9 Conclusions ... 62
CHAPTER 4 Effect of molecular weight on the nucleation efficiency of poly(lactic acid) crystalline phases ... 65 4.1 Abstract ... 67 4.2 Introduction ... 68 4.3 Experimental ... 69 4.3.1 Materials ... 69 4.3.2 Characterization ... 70
(1) Differential Scanning Calorimetry (DSC) ... 70
(2) Self-nucleation thermal protocol ... 70
viii
(4) Hot-Stage and Optical Microscopy ... 72
4.4 Results and discussion ... 72
4.4.1 Effect of molecular weight on the microstructure and crystallization kinetics ... 72
4.4.2 Effect of molecular weight on the self-nucleation of PLA ... 76
4.4.3 Double crystallization peak... 80
4.4.4 Morphology of the self-nucleated ... 82
4.4.5 Final heating curves ... 83
4.4.6 Quantification of the α and α’ phase fractions ... 86
4.4.7 Effect of holding time at the partial melting range ... 86
4.5 Conclusions ... 87
CHAPTER 5 Effect of molecular weight on the shear-induced crystallization of poly(lactic acid) 89 5.1 Abstract ... 91 5.2 Introduction ... 92 5.3 Experimental ... 94 5.3.1 Materials ... 94 5.3.2 Characterization ... 95
(1) Differential Scanning Calorimetry (DSC) ... 95
(2) Wide-angle X-ray diffraction analysis (WAXD) ... 95
(3) Optical microscopy ... 95
(4) Rheological characterization and flow-induced crystallization... 96
5.4 Results and discussion ... 96
5.4.1 Shear rheology of samples ... 96
5.4.2 Rheological analysis ... 103
5.4.3 Microscopy observation ... 105
5.4.4 X-ray diffraction measurements ... 106
5.4.5 Shear-induced crystallization at intensive shear flow ... 108
5.4.6 Thermal analysis of sheared samples ... 110
5.5 Conclusions ... 113
5.6 Acknowledgment ... 114
TABLE OF CONTENTS
6.1 Francais ... 115
6.2 English ... 116
6.3 Recommendations ... 118
x
LIST OF FIGURES
Figure 1. Stereoforms of lactide [2]. ... 5
Figure 2. A spherulite of iPP as observed in the optical microscope [9]... 7
Figure 3. The Lauritzen–Hoffman PLA with different molecular weights [11]. ... 7
Figure 4. Crystallization half-time vs TC for PLA [20]. ... 9
Figure 5. Spherulite radius growth rate of PLA as a function of TC [18]. ... 10
Figure 6. IR spectra of amorphous and crystalline PLLA crystallized at TC =80-140 °C [26]. ... 11
Figure 7. DSC curves of samples melt-crystalized at a cooling rate of 1 °C/min, being heated. The heating rates are indicated [40]. ... 13
Figure 8. DSC thermograms of blend polymers from PLLA and PDLA. The ratios on the curves denote the blend ratios of PLLA to PDLA [46]. ... 15
Figure 9. Degree of crystallization of PLLA vs. time for different crystallization temperatures [1]. ... 18
Figure 10. Crystallization enthalpy as a function of cooling rate for difference formulation [1]. ... 31
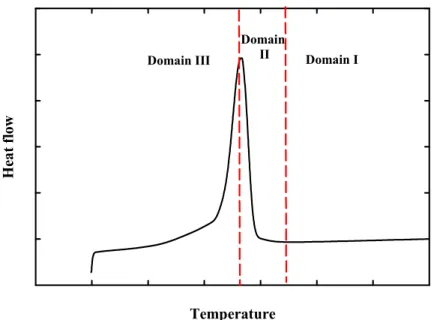
Figure 11. Partial or complete melting domains of a semi crystalline polymer. ... 34
Figure 12. Schematic of shish-kebab structure [161]. ... 36
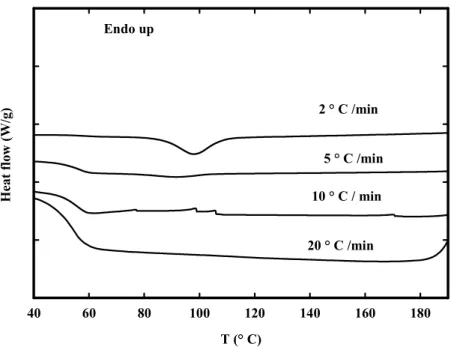
Figure 13 . DSC curves for PLA at different cooling rates after holding at 200 °C for 5 minutes. ... 48
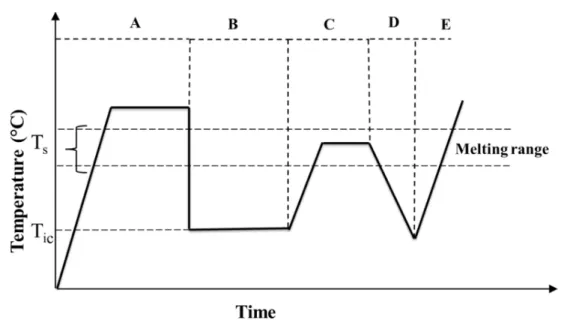
Figure 14. Schematic representation of temperature protocol for the self-nucleation of PLA. 49 Figure 15 . DSC cooling scans at 2 °C/min for sample previously crystallized at TiC=80 °C then self-nucleated for 5 minutes at the indicated self-nucleation temperature, Ts. (Segment D in Figure 14). ... 50
Figure 16. DSC enlarged cooling scans at 2 °C/min for sample previously crystallized at TiC=80 °C then self-nucleated for 5 minutes at the indicated self-nucleation temperature, Ts. (Segment D in Figure 14). ... 51
Figure 17. DSC heating scans at 2 °C/min after the cooling shown in Figure 14. Ts values are indicated above each curve. (Segment E in Figure 14). ... 52
LIST OF FIGURES
Figure 19. Heating scans obtained from various isothermal crystallization temperatures
ranging from 80-140 °C to Ts = 170°C at 2 °C/min. (Segment C in Figure 14). ... 54
Figure 20. Maximum nonisothermal crystallization temperature, TC max, obtained after self-nucleation at Ts=170 °C as a function of the crystallization temperatures, TiC. ... 55
Figure 21. Plot of ln[−ln(1−X)] versus ln t under crystallization at 130 °C for PLA that was
first crystallized at the indicated Tic , next self-nucleated at Ts= 172 °C, and finally cooled back to 130. ... 58
Figure 22. Variation of the Nuclei density ( black circle ) and the average spherulite size (
black triangle ) of self-nucleated samples at Ts= 172 °C versus Tic. ... 59
Figure 23. DSC cooling scans (Segment D in thermal protocol (c.f. Figure 13) after
self-nucleation at the indicated temperatures, Ts, for the samples were previously isothermally crystallized at 115 °C in the isothermal crystallization step. ... 59
Figure 24. XRD patterns of samples self-nucleated at indicated Ts , cooled at 2 °C/min and then quenched: a) after the first crystallization peak b) after the second crystallization peak . Note that the arrows indicates five characteristic peaks of the α phase. ... 61
Figure 25. DSC heating scans at 2°C/min in Segment E of the thermal protocol (c.f. Figure
13) after cooling from the indicated self-nucleated temperatures, Ts. ... 62
Figure 26. Schematic representation of temperature protocol for the self-nucleation of PLA. 71 Figure 27. XRD patterns of a) L-PLA b) H-PLA. ... 73 Figure 28. a) cooling and b) second heating DSC scans at 10 °C/min for L-PLA and H-PLA.
... 74
Figure 29. Crystallization half-time vs isothermal crystallization temperature for L-PLA and
H-PLA. ... 75
Figure 30. Spherulite growth rate, G, as a function of isothermal crystallization temperature
for L-PLA and H-PLA. ... 76
Figure 31. DSC heating curves of a) L-PLA b) H-PLA to 200 °C after isothermal
crystallization (segment C in thermal protocol of Figure 1) at the indicated different isothermal crystallization temperatures. Dashed line represents the Ts. ... 78
Figure 32. Variation of Tcmax as a function of isothermal crystallization temperature for L-PLA (triangle) and H-L-PLA (circle). ... 80
xii
Figure 33. DSC cooling scans after self-nucleation at different Ts for samples previously isothermally crystallized at 115 °C a) H-PLA at 1(dashed line) and 2 °C/min (solid line) for b) L-PLA at 2 °C/min. (Segment D in Figure 26). ... 82
Figure 34. Optical micrograph of H-PLA showing : a) spherulite morphology at cooling rate
of 2°C/min after holding for 5 minutes at Ts =173 °C b) spherulite morphology at cooling rate of 2°C/min after holding for 5 minutes at Ts =173.8 °C. ... 83
Figure 35. Final DSC heating scans at 2 °C/min after cooling from different TS: a) HPLA between 40 and 100 °C b) HPLA between 140 and 180 °C and c) L-PLA. ... 85
Figure 36. DSC cooling curves at 2 ° C/min for the self-nucleated H-PLA samples at 173 °C
at different holding times. ... 87
Figure 37. Rheological master curves for H-PLA, M-PLA and L-PLA at Tref = 130 ° C. ... 98
Figure 38. The ln aT , vs (1/T) for all molecular weights at T0 = 130 °C. ... 99
Figure 39. Normalized stress growth coefficient as a function of time at the indicated shear
rates for different molecular weight PLAs at T=130 °C. ... 101
Figure 40. Transient stress growth coefficient as a function of strain at the indicated shear
rates for different molecular weight PLAs at T=130 °C. ... 102
Figure 41. Normalized weighted relaxation spectra for different molecular weights at 130 °C.
... 105
Figure 42. Optical microscopy micrographs for PLA samples: the first row at quiescent
condition at 130 °C: the scale bar is 50 micrometer. The second row: sheared at 0.1 s-1 at 130 °C: the scale bar is 200 micrometer. ... 106
Figure 43. WAXD patterns of the sheared H-PLA in the constant viscosity region, the dash
line curve, and after viscosity overshoot, the solid line curve, at 130°C. ... 107
Figure 44. WAXD patterns of the L-PLA at 95 °C in quiescent condition, dash line curve, and
after shearing at 0.01 s-1 for 7 minutes, the solid line curve. ... 108
Figure 45. Development of the normalized storage modulus for different molecular weight
PLA samples pre-sheared during 10 seconds at shear rates equal to a) 5 s-1 b) 10 s-1 at 130 °C. ... 109
Figure 46. DSC heating micrographs for non-sheared( dashed line curve) and pre-sheared
(solid line) at 10 s-1 for H-PLA. ... 111
LIST OF FIGURES
Figure 48. DSC cooling micrographs for different molecular weight PLA samples that were
xiv
LIST OF TABLES
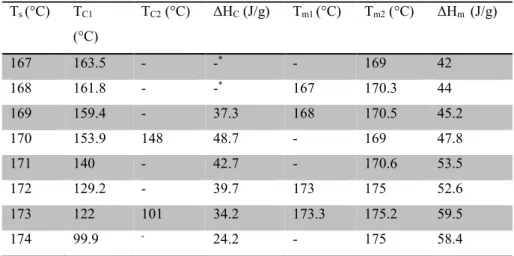
Table 1. Properties of different PLA crystal forms... 8 Table 2. Crystallization temperature, enthalpies of crystallization and melting as a function of
self-nucleation temperatures. ... 50
Table 3. Effect of isothermal crystallization temperatures, Tic, on crystallization half-time,t1/ 2 , Avrami values, n and k, Nuclei density N, and average spherulite diameter D. ... 57
Table 4. Number-average molecular weight (Mn), weight-average molecular weight (Mw) and polydispersity index (PDI) of the low and high molecular weight PLA samples. ... 70
Table 5. Characteristics of the low and high- molecular weight PLAs. ... 75 Table 6. Crystallization and melting enthalpies as well as the proportion of α’ phase according
to the indicated Ts. ... 86
Table 7. Number-average molecular weight (Mn), weight-average molecular weight (Mw) and polydispersity index (PDI) of the PLA samples. ... 95
Table 8. Shift factor, aT, zero-shear viscosity, η0, at 130 and 180 °C for PLA samples. ... 99
Table 9. , and critical shear rates for regime transition for PLA samples at 130 °C. ... 105
LIST OF SYMBOLS
LIST OF SYMBOLS
Symbol Definition t time X(t) Degree of crystallinity t1/2 Crystallization half-time Tm Melting temperatureTg Glass transition temperature
Ts Partial melting temperature
TCC Cold crystallization temperature
TC Crystallization temperature
Tic Isothermal crystallization temperature
TCmin Minimum crystallization temperature
TCmax Maximum crystallization temperature
∆Ht Enthalpy generated at time t
∆H∞ Enthalpy generated at infinite time
∆Hm Melting enthalpy
∆HCC Cold crystallization enthalpy
∆Hm0 Melting enthalpy of 100% crystalline PLA
n Avrami exponent
K Avrami constant
N Nuclei density
G Spherulite growth rate
D Average spherulite size
U* Activation energy
Mn Number-average molecular weight
Mw Weight-average molecular weight
G’ Storage modulus
G” Loss modulus
|η*| Complex viscosity
xvi
aT Shift factor
C1 WLF parameter
C2 WLF parameter
T0 Reference temperature in WLF equation
Tr Glass transition temperature in WLF equation
η0 Zero-shear viscosity
η+ Stress growth coefficient
Weissenberg number
̇ Shear rate
Relaxation time
Reptation Weissenberg number Stretch Weissenberg number Reptation relaxation time Rouse relaxation time Angular frequency
Me Molecular mass between entanglements
LIST OF ACRONYMS
Acronym Definition
PLA Poly(lactic acid)
PLLA Poly(L-lactic acid)
PDLA WAXD TEM PET PBT PBS PES PEEK DSC XRD PCDI TNPP DNA EBS C60 TPS PGA CNC CD PHB PHBV PBA OA ZnCC BTA TBC8-eb Poly(D-lactic acid)
Wide Angel X-ray Diffraction Transmission Electron Microscopy Poly (ethylene terephthalate) Poly(butylene terephthalate) Poly(butylene succinate) Poly(ethylene succinate) Poly(ether ether ketone)
Diffrential Scanning Calorimetry X-ray Diffraction Polycarbodiimide nonylphenyl phosphite Deoxyribonucleic Bis-stearamide Fullerene Thermoplastic starch Polyglycolide Cellulose nanocrystals Cyclodextrin Poly(hydroxybutyrate) Poly(hydroxybutyrate valerate) Poly(butylene adipate) Orotic acid
Zinc citrate complex
1,3,5-benzene tricarboxyamide P-tert- butylcalix
xviii DBS NA CNT MWCNT CB MCB PPZn PPA-Zn POSS BF PEG PPG TPP CO2 ATC NES PC PP PB FTIR PVDF SSA PPDX SAXS BOPP iPB WLF NLREG B-PLA Dibenzylidene-D-sorbitol
N,N’-Bis(benzoyl) acid dihydrazide Carbon nanotubes
Multiwall carbon nanotube Carbon black
Modified carbon black Zinc phenylphosphonate Phenylphosphonic acid zinc Polyhedral oligosilsesquioxane Bamboo fiber Polyethylene glycol Polypropylene glycol Triphenyl phosphate Carbon dioxide Acetyl triethyl citrate Nucleation efficiency scale Polycarbonate
Polypropylene Polybutylene
Fourier transform infrared spectroscopy
Poly (vinylidene fluoride) Self-nucleation and Annealing Poly(p-dioxanone)
Small-Angle X-ray Scattering Biaxially oriented Polypropylene Poly (1-butene)
Williams-Landel- Ferry equation Non-linear regression software Branched PLA
1
CHAPTER 1
INTRODUCTION
Context
PLA is a versatile biobased linear polyester that has found multiple applications in recent years. Its use, however, could be further expanded if its crystallization rate could be increased. Higher crystallinity in PLA could lead to enhanced temperature resistance, a typical drawback of PLA for industrial applications. To date, several routes have been explored to increase the level of the crystallinity of PLA. The majority of these studies have been performed in quiescent conditions. However, even in these simple conditions, determination of the optimum crystallization conditions remains a challenge. From a crystallographical and chemical point of view, the most efficient nucleating agents for the crystallization of a semi-crystalline polymer are the crystal nuclei of the same polymer. Hence, studying the “self-nucleation” of PLA in the melt state can give us valuable information about its optimum crystallization conditions. Furthermore, two crystalline phases known as α’ and α may form, depending on the crystallization temperature. The α’ is favored at low crystallization temperature (< 100 °C) while the α phase is favored at high crystallization temperatures (> 120 °C). Within the crystallization temparture range of 100-120 °C, a mixture of these crystalline phases might co-exist.
PLA-based products are produced by conventional polymer processing techniques (e.g. injection molding, extrusion, film blowing). Crystallization in polymer processing conditions involves dynamic flow and heat transfer. For example, in injection molding, the polymer melt is subjected to high deformation rates during mold filling. Thus, crystallization upon cooling takes place in static mode but upon highly stretched polymer chains, which is very different from the quiescent crystallization used in calorimetric studies. Another interesting example is that of film blowing. In this process, the polymer melt experiences elongational flow leading to highly enhanced crystallization rates. Overall, the PLA crystallization kinetics in the presence of shear and elongational flow is still, to a large extent, poorly understood.
1.1 Research questions and objectives
Depending on the crystallization temperature, PLA has two crystalline phases, α and α’. The effect of these crystalline structures on the self-nucleation behavior of PLA has not been investigated yet. The first focus of this work will therefore aim at determining how the crystal phases differ in terms of nucleating efficiency and their role on the final sample morphology. The second question will be in relation with the effect of molecular weight. It is well recognized that molecular weight plays an important role on the mobility of polymer chains. In turn, this will play a role on crystal growth rates and on the overall crystallization rate. The research question that deserves to be tackled concerns the role of molecular weight on the crystallization dynamics and furthermore on the nucleation efficiency and phase morphology (α vs α' forms) genereated upon cooling and after self-seeding. This will provide a better understanding on means to promot the crystallization kinetics of PLA.
The third research question that will be addressed will be regarding the effect of flow on crystallization. As mentioned previously, manufacturing of thermoplastics always implies flow conditions that in turn influences crystallization kinetics. Hence, understanding the crystallization behavior of semi-crystalline polymers, like PLA, in the presence of flow is critical for both academic and industrial viewpoints. Consequently, the research has sought to determine how crystallization can occur upon continuous shear flow and how crystallization can be promoted through strong pre-shearing flows. Since the chain relaxation is strongly molecular-weight dependant, these last questions were answered for a range of molecular weight giving this study a more general scope.
Hence, in summary the main objective of this project is to further improve the basic understanding of:
“Quiescent and flow-induced crystallization of PLA” with specific objectives being:
To study the self-nucleation behavior of pure PLA, in particular on the effect of α and α' crystalline phases on nucleation efficiency.
3
To investigate the effect of continuous shear flow and strong pre-shearing flow on the crystallization behavior of PLA with varying molecular weight.
1.2 Thesis organization
The thesis has been organized in the following manner. In chapter 2, a literature review on PLA crystallization has been presented in two parts. A general knowledge on crystallization of PLA, its crystalline phases and the ways that have been employed so far to improve the crystalinity of PLA is reflected in the first section. The second part focuses on the flow-induced crystallization of PLA. Chapters 3 to 5 cover the three distinct core experimental parts responding to the three main objectives described previously. Chapter 3 presents a study on the effect of thermal protocol on the self-nucleation of PLA. In chapter 4, effect of molecular weight on the nucleation efficiency of PLA crystalline phases is demonstrated. Chapter 5 presents the effect of molecular weight on the shear-induced crystallization of PLA. Finally, chapter 6 briefly outlines the most significant concluding remarks and presents recommandations for the future works in this area.
1.3 Original contribution
This work exhibits several original contributions to the subject of PLA crystallization. In the first section of the work, which addresses the quiescent crystallization of PLA, a successive heating and cooling thermal protocol to study the self-nucleation of PLA was illustrated. In addition, the optimum condition for the crystallization kinetics of PLA was reported. For the first time, a double crystallization peak for the self-nucleated PLA was reported. These peaks were ascribed to the formation of the α and α’ phases. Changing the proportion of these two peaks by slightly changing the temperature within the partial melting range of PLA was another originality of the first section of the study. In the second part, the effect of thermal process and molecular weight on the nucleation efficiency was intended using the same applied thermal protocol in the first part. The self-nucleation experiments revealed that for the high-molecular weight PLA the maximum crystallization temperature upon cooling after self-seeding is a dependent function of the isothermal crystallization temperature. However, for the low-molecular weight PLA, it is rather equivalent, irrespective of the isothermal crystallization temperature. Furthermore, the double crystallization peak previously observed
in the first part of study was detected for the self-seeded low-molecular weight PLA on a given partial melting temperature range. The last phase of project regarding the shear-induced crystallization of PLA was original because it was not explored prior to the attempts reported in this thesis. It showed that crystallization kinetics of PLA was accelerated with molecular weight in the presence of shear flow.
5
CHAPTER 2
LITERATURE SURVEY
2.1 Preface
This section is dedicated to a review on crystallization kinetics of PLA, published methods for increasing its crystallinity, some aspects of stereocomplex PLA, self-nucleation and flow-induced crystallization of PLA. The last two subjects are the basis of the current research.
2.2 Lactic acid and lactide
Due to the existence of a chiral carbon in its backbone, PLA possesses two stereoisomers, L-PLA and D-L-PLA, which are called PLLA and PDLA, respectively. L-PLA can be synthesized by ring opening of lactide; a cyclic lactic acid dimer is produced in the first step (Figure 1) and this structure is polymerized to obtain high molecular weight PLA. Meso-lactide can also be produced by the combination of L- and D- units (Figure 1). The L:D ratio in PLA is a crucial parameter to control its biodegradability, mechanical properties as well as the degree of crystalinity and the melting point [1].
Figure 1. Stereoforms of lactide [2].
Details on synthesis of this polymer including the effect of temperature, catalysts, and kinetics of polymerization reactions can be found elsewhere [3]. We only focus on the crystallization of PLA. Before reviewing the main aspects of PLA crystallization, the crystallinity of polymers is briefly discussed.
2.3 Polymer crystallization
A two-phase model traditionally describes semi-crystalline polymers. In this model, every amorphous and crystalline phase demonstrates different characteristics. However, Menczel
et.al [4] provided the first experimental evidences indicating the presence of a third
intermediary phase. This interfacial layer is regarded as rigid amorphous fraction (RAF). Characteristics and properties of RAF are beyond the scope of this study and afterwards we mainly focus on the role of PLA crystalline phases.
The process of crystallization of polymers from the melt is divided into three parts: primary nucleation, crystal growth, and secondary crystallization [5]. In primary nucleation, a crystalline nucleus is formed in the molten state. This nucleus might form homogeneously by means of statistical fluctuation in the melt phase or heterogeneously by the presence of heterogeneities. Nucleation is often heterogeneous and takes place on surfaces, cavities, or cracks of insoluble impurities. After the formation of nuclei, crystalline lamellae establish and 3D structures form. The most commonly observed morphology on solidification from the melt is the spherulite; however, formation of the other structures such as hedrites or dendrites has been reported as well [6]. Crystallization does not stop with the growth of the crystals, and a process, which is called “secondary crystallization”, occurs. Here, the level of crystalinity as well as thickness of the already formed lamellar crystals increase, as reported in polyethylene [7] or poly(3-hydroxybutyrate) [8]. Figure 2 shows a spherulite of isotactic polypropylene (iPP), which represents the organization of the crystalline lamellae and the amorphous phase.
Figure 2. A spherulite of iPP as observed in the optical microscope [9].
Polymer crystallization is usually described by Lauritzen–Hoffman model, which explains three different regimes of crystallinity when log (G) + U*/k (T-T0) is plotted as a function of (TΔT)-1[10].In this model, G is the spherulite growth rate, U* is the activation energy and k is the constant. Covering the fundamental aspects of this theory is impossible in this review.
Figure 3 presents the Lauritzen–Hoffman plot for PLA with different molecular weights [11].
2.4 PLA crystalline phases
PLLA crystals grow in three structural modifications, consisting in different helical conformations and cell symmetries developed upon different thermal and mechanical treatments [12]. The α form, the most stable type, forms upon melt or cold crystallization, and also from solution-spinning processes at low drawing temperatures [13]. Chain conformation of α phase is a left-handed 103 helix packing into an orthorhombic unit cell with parameters a = 1.06 nm, b = 1.737 nm, and c = 2.88 nm [14].
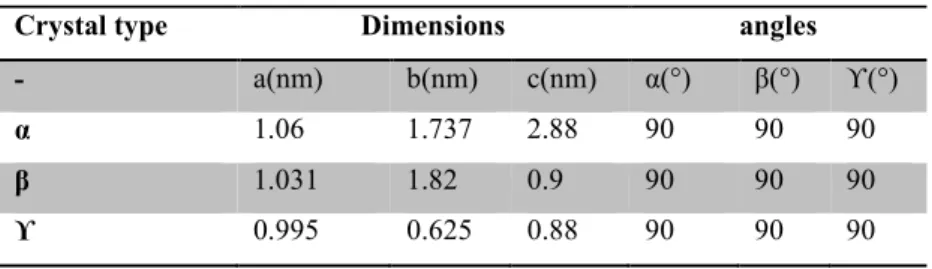
By stretching of α at high draw and high temperature ratios, another crystal structure, β, forms which has a unit cell with a = 1.031 nm, b = 1.821 nm, and c = 0.900 nm, and a chain conformation with left handed 31 helices [15]. The third crystal modification of PLLA, the γ form, has been reported to develop upon epitaxial crystallization on hexamethylbenzene substrate, with two antiparallel helices packed in an orthorhombic unit cell with a = 0.995 nm, b = 0.625 nm, and c = 0.88 nm [16]. Table 1 summurizes Properties of PLA crystal forms.
Table 1. Properties of different PLA crystal forms.
Crystal type Dimensions angles
- a(nm) b(nm) c(nm) α(°) β(°) ϒ(°)
α 1.06 1.737 2.88 90 90 90
β 1.031 1.82 0.9 90 90 90
ϒ 0.995 0.625 0.88 90 90 90
The crystallization kinetics of PLLA has been investigated by many research groups, and it has been found that it exhibits peculiar behavior [11,12,17,18]. The curve of the crystallization half-time (t1/2) versus crystallization temperature (TC) is basically continuous for most semi crystalline polymers, but for PLA it is discontinuous in the temperature range of 100-120 °C as can be seen in Figure 4. Besides, the profile of spherulite radius growth rate (G) versus TC shows two maximums in Figure 5 Two explanations exist for such an atypical behavior. Some studies have shown that this behavior can be ascribed to regime transition in crystalinity of PLA. Regime transitions of PLA crystal growth from the melt were investigated by Abe et al. using microscopic techniques [11]. Kinetic analysis demonstrated that regime transitions of PLA from regime III to regime II and from regime II to regime I took place at 120 °C and 147 °C, respectively. During transition from II to I, spherulitic crystals transformed to hexagonal
ones while no obvious morphology change was observed from II to III for spherulites. Di Lorenzo argues that the unusually high rate of crystallization below 120 °C cannot be attributed to the nucleation rate since no remarkable increment in the rate of nucleation was detected between 100 °C and 120 °C [19]. This phenomenon was ascribed to high radial growth rate of spherulites. No significant change in morphology of spherulites was observed as well. In addition, by using directly measured G values, a regime II-III transition was reported around 120 °C [19,20].
Figure 4. Crystallization half-time vs TC for PLA [20].
Nevertheless, others have associated the unusually high rate of crystallization of PLA to polymorphic nature of PLA [17,21,22]. Ohtani [22] studied the crystallization behavior of amorphous PLA which was prepared by quenching from melt to ice-cold water. From the analysis of wide-angle X-ray diffraction, it was found that when amorphous PLA was crystallized below 120 °C, β crystals formed while annealed samples above 120 °C exhibited the α form of crystallites. Instead of t1/2, Yasuniwa et al. [17] defined the peak of crystallization time, τp, as the time spent from the onset to the point where the exothermic crystallization peak appears. If the peak profile of isothermal crystallization is symmetric, then τp = t1/2. They found that log τp against the isothermal crystallization temperature, Tc, changed discontinuously at 113 °C. Furthermore, the curve of spherulite growth rate, G vs. TC, presented a discrete change at 113 °C. X-ray patterns proved that the crystal structure of samples crystallized below 113 °C and above 113 °C were trigonal (β form) and orthorhombic
(α form), respectively. They ascribed the discrete change of spherulite growth to a different growth mechanism of PLA crystalline phases.
Figure 5. Spherulite radius growth rate of PLA as a function of TC [18].
In recent years, a new crystalline structure designated as α’, a disordered type of α, has been proposed for the PLLA samples which have been produced via melt or cold crystallization below 120 °C. This is different from the organized α form crystalized at higher temperatures [21,23,24].
For the first time, Zhang et al. [23,24,25] provided a comprehensive study on the effect of the isothermal crystallization temperature on the PLLA crystallization structure. They mentioned that the isothermal crystallization behavior of PLLA from the melt and glassy state by infrared spectroscopy was different [25]. The isothermal melt-crystallized PLLA sample was prepared at 150 °C after melting at 200 °C for 1 min whereas the isothermal cold-crystallized sample was prepared at 78 °C. No splitting band, induced by interaction of CH3 or C=O groups, was observed for the cold-crystallized sample while it was observed in the melt-crystallized sample.(When PLA is cooled from the melt we have the melt crystallization while when it is heated from solid state we have the cold crystallization). As a result, dissimilar chain packing was found during two different isothermal crystallization procedures. Additionally, WAXD patterns of the samples annealed at 80 °C and 140 °C were rather different. It, therefore, suggested the crystallization structure of PLLA samples prepared at different temperatures were dissimilar. Furthermore, in another attempt, they investigated the crystallization structure
of PLLA prepared between 80-150 °C [21]. Since there was no characteristic band at 908 cm-1 regarding β crystals of PLLA samples, it was concluded unequivocally there was no β form in the structure of prepared PLLAs crystalized at different temperatures. Moreover, in the region of 1810-1710 cm-1, the C=O stretching band area, a new band appeared at 1749 cm-1 with increasing the annealing temperature above 100 °C (Figure 6) [26]. The different electron diffraction patterns, ED, as well as TEM micrographs of samples taken from PLLA samples from 80 °C and 140 °C also confirmed the crystalline structure of PLLA was not similar at high and low isothermal crystallization temperatures. As previously mentioned above, IR analysis does not confirm the formation of the β structure at low temperatures. Consequently, based on this conclusion another type of crystalline structure for PLLA formed at low temperatures was defined. By means of IR spectroscopy, the α’ form for PLLA was proposed. It has the 103 helix chain conformation and the different lateral packing of the helical chains, which is different from lateral packing of α crystalline phase.
2.5 PLA multiple melting behavior
Multiple melting has been reported for many semi-crystalline polymers such as poly (ethylene terephthalate), PET [27], poly(butylene terephthalate), PBT [28], poly(ether ether ketone), PEEK, poly(butylene succinate), PBS [29], and poly (ethylene succinate), PES [30]. Thus far, three mechanisms have been suggested to explain the double melting behavior of semi-crystalline polymers; dual lamellae population, melt-recrystallization, and dual crystal structure [31].
Dual lamellae population has been reported mainly for PEEK [32,33]. This model is further divided into sub-models; the lamellae insertion model [34], and the lamellae stack model [35]. The absence of polymorphic transition thus excludes the possibility of two different crystal structures that could be assigned to the dual melting peaks often observed in PEEK thermographs. However, this is out of the scope of this research, which deals with PLLA, which is a polymorphous polymer.
The melt-recrystallization model explains the multiple melting. The low and high melting peaks can be assigned to the melting of some original crystals and to the melting of crystals formed during the crystallization process, respectively. The exothermic peak between these double endothermic peaks associates to the recrystallization. In other words, the melting progresses through the melting of the original crystals, their recrystallization, and finally the fusion of recrystallized crystals. Many researchers reported appearance of the double melting peaks in PLLA [31,36,37,38]. Jamshidi et al. studied the melting behavior of a series of PLLAs with different molecular weights [39]. The polymers with molecular weights lower than 3000 g/mol exhibited a weak and broad melting peak, slightly lower than that of the main endothermic peak. This peak disappeared by increasing the molecular weight. The broad peaks were attributed to an unstable crystalized region but further explanation was not given.
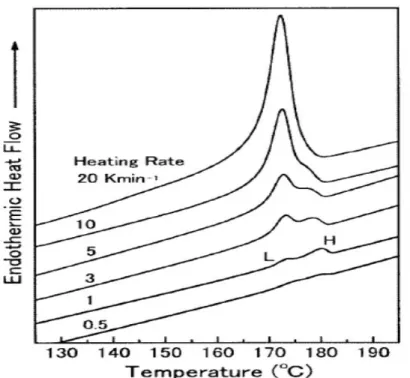
Figure 7 illustrates the DSC curves of melt-crystalized samples at a cooling rate of 1 °C/min
from the melt [40]. There are two melting peaks designated low (L) and high (H). The H/L peak area ratio decreased with heating rate. According to the melt-recrystallization model, imperfect crystals transformed to more stable crystals through the melt-recrystallization mechanism [41,42]. When the rate of melting overcame the rate of recrystallization, an endothermic peak appeared while an exothermic peak appeared when the rate of recrystallization overwhelmed the rate of melting.
Figure 7. DSC curves of samples melt-crystalized at a cooling rate of 1 °C/min, being heated. The heating rates are indicated [40].
The double melting behavior, as well as an exothermic peak between two endotherms, for PLLA with the molecular weight of 18000 g/mol and higher ones, was also reported [43]. Some authors attributed this small exotherm to a cold crystallization [44]. It was then elucidated from the change in the X-ray diffraction patterns that the phase transition from the disordered crystal modification (α’) to the organized form (α) occurred in a range of 155-165 °C for the samples isothermally crystallized at low temperatures, below 100 °C [38]. The lattice spacing calculated from the main diffraction peak, for isothermally crystallized samples at 80 °C and 100 °C, increased with temperature by thermal expansion. At 155 °C, a decrease in lattice space was observed and fitted to those of samples isothermally crystallized at 120 °C and 140 °C. This variation in lattice space corroborated the phase transition from α’ to α. Kawai et al. [45] also confirmed this α’ to α transform at 150 °C. They explained that this transition proceeded without melting in a very short time. Consequently, they considered this transition as a solid-solid phase transition.
2.6
Stereocomplex PLA
By a simple physical blending of PDLA and PLLA, stereocomplex PLA is formed. The PLA complexation occurs via the racemic crystallization process. This phenomenon was first introduced by Ikada et al. [46]. After that, many articles were published by Tsuji and coworkers about the other features of stereocomplex PLA [47,48,49,50,51,52,53,54,55].
Figure 8 depicts the DSC curves of the pure PLLA and PDLA and their blend in different
ratios. A single endothermic peak appeared in both pure enantiomers around 180 °C while a new melting peak was observed at 230 °C for the blends. When the blend ratio is 50/50, the peak around 180 °C disappeared and the peak around 230 °C was sharper. This outstanding rise in melting temperature was associated to a new crystalline structure due to co-crystallization of both enantiomers of PLA in their solution [46].
De Santis and Kovacs reported that the crystalline structure of PLLA and PDLA are left-handed and right-left-handed, respectively [56]. Stereocomplex crystal was formed through van der Waals forces as dipole-dipole interactions between two components. Okihara and his coworkers studied the crystalline structure of PLA stereocomplex using XRD [57]. The crystalline structure of the racemic crystal is triclinic with cell dimensions of a=0.916 nm, b=0.916 nm, c=0.87 nm and angles of α=109.2°, β=109.2° and γ=109.8°. In the unit cell, a PLLA segment and a PDLA segment are contained as a pair and packed laterally in parallel style. The L- and D- polylactides in the complex take a 31 helical conformation, which is a little extended from a 10 in the homopolymer crystal with the α form 3 helix.
According to Ikada et al. [46], the diffraction peaks for homopolymer appear at 2θ around 15°, 16°, 18.5° and 22.5° in WAXD patterns while PLLA50/PDLA50 exhibited the diffraction peaks at 2θ around 12°, 21° and 24°.
Figure 8. DSC thermograms of blend polymers from PLLA and PDLA. The ratios on the curves denote the blend ratios of PLLA to PDLA [46].
Various parameters including blending ratio [51,53,58,59,60], molecular weight [47,48,54,61], and optical purity [62,63,64] affect the racemic crystallization and homocrystallization of PLA.
2.6.1
Blending ratio
Equimolar ratio of PLLA and PDLA is the optimum ratio for the formation of PLA stereocomplex [46]. Changing this balance led to formation of homocrystals as well. According to Tsuji et al. [50], for PDLA mole fractions between 0.1 to 0.3 and 0.7 to 0.9, two melting peaks were observed regarding to homocrystals and stereocomplex crystals. For mole fractions between 0.4 and 0.6 only stereocomplex peak was observed [50,51].
2.6.2
Molecular weight
Crystallization of stereocomplex PLA from pairs of a low molecular weight PDLA, 4900 g/mol, and PLLA of various molecular weights was investigated by Tsuji et al.[50]. Mole fraction of PDLA was fixed at 0.5. By increasing the molecular weight of PLLA in the region above 60000 g/mol in the blend, the main melting peak of PLA stereocomplex decreased monotonically. The melting enthalpy, ∆Hm, calculated for PLLA with a molecular weight less than 60000 g/mol was approximately 70 J/(g-polymer) and was 50 J/(g-polymer) for PLLA with a molecular weight above 100000 g/mol. These results imply that when the molecular weight of at least one of the enantiomers is low enough, stereocomplex crystals form predominantly with almost no homopolymer crystals. To check this finding, further investigation was performed on the crystallization of PDLA having a high molecular weight, 360000 g/mol, and PLLA of various molecular weights. Analysis of DSC thermograms revealed that ∆Hm of homocrystals increased gradually with increasing molecular weight of PLLA, around 35-40 J/(g-polymer), whereas ∆Hm of stereocomplex crystals decreased monotonously with molecular weight of PLLA and at a molecular weight of 100000 g/mol it became virtually zero. These results confirm the postulation that racemic crystals form favourably to homopolymer crystals if the molecular weight of one of the components is sufficiently low. Other studies [51,65,66] also confirm this assumption.
2.6.3
Optical purity
Optical purity is associated to the ratio between L- and D- ratio units in PLA structures. Because the two repeating units are optically active, they rotate polarized light in opposite directions. Increasing the level of opposite enantiomeric monomer in a polymer causes the reduction of chain optical purity [67]. Optical purity of enantiomers affects the level of stereocomplexation. Tsuji et al. studied the crystallization of 50/50 blends of similar optical purity PLLAs and PDLAs prepared by solution casting and pure polymers as well as non-blended samples [64]. No spherulite structure was observed for non-non-blended samples with optical purity less than 76 %. By decreasing the isothermal crystallization temperature, the spherulite density increased. This effect was more pronounced for samples having lower optical purities. Furthermore, blended films had higher spherulite density than non-blended samples at any crystallization temperature and optical purity. DSC heating thermographs of melt quenched PLLA and PDLA samples displayed a cold crystallization temperature and
subsequent melting peaks. Increasing optical purity decreased the cold crystallization temperature and increased melting point. Whereas homopolymers with 83 % optical purity were not able to crystallize during heating in DSC, the blends of the homopolymers crystallized. Furthermore, at a constant crystallization temperature, increasing optical purity led to increasing the melting point.
2.7 Enhancing PLLA crystallization by nucleating agents
The most practical method to increase the nucleation density and the crystallization rate is the addition of heterogeneous nucleating agents. Even though the detailed mechanism of heterogeneous nucleation is not well understood, it is believed to arise from molecular interactions between the polymer and the surface of the nucleating agent [68]. This interaction results in a reduction in the interfacial free energy barrier for stable nucleus formation. Heterogeneous nucleation agents have been employed to reduce process cycle times, allow crystallization at a lower undercooling (high temperatures) and form smaller crystals to enhance material crystalinity.
Generally, nucleating agents are classified in two physical and chemical groups [69]. Through a chemical reaction, chemical nucleating agents can render the nucleation process such as organic salts of sodium used in crystallization of PET. Li and Huneault [70] examined the effect of sodium stearate on the crystallization of PLA. They reported that this nucleating agent showed no significant effect on the crystallization rate. They also measured the variation of viscosity of PLA with 0.5% of this substance and showed the viscosity of this compound was lower by a factor of 2.5 due to the chain scission.
Physical nucleating agents are mostly applied to promote PLA crystallization rate [71]. Henceforth, the effect of these nucleating agents on the crystallization of the PLA will be reviewed.
2.7.1
Talc
Kolstad [72] tested an assortment of nucleating agents and found that talc, a common nucleating agent for thermoplastics, was the most effective one. With 6 wt % of talc, the t1/2 value of PLLA was found to be less than 1 min at crystallization temperatures between 90 and 120 °C. In addition, the nucleation density also increased by 500-fold. The epitaxial mechanism was used to explain the Talc nucleated crystallization of PLLA.
The well-known Avrami equation is often used to analyze the crystallization kinetics. It assumes that the relative degree of crystalinity develops with crystallization time, t, as:
1 − = exp − (1)
where is the relative degree of crystalinity at time t; the exponent n is the Avrami exponent and k is a kinetic rate constant. The exponent is typically between 2 and 4 for polymer crystallization and is associated to the nucleation mechanism (homogeneous or heterogeneous and simultaneous or sporadicIf the nucleation sites are present at the early stage of the nucleation, then this is called simultaneous nucleation. However, when the nuclei form in the polymer matrix at a constant time rate, the nucleation is called sporadic. The higher n values are attributed to three dimensional spherulitic growth with a sporadic or a combination of sporadic and simultaneous nucleation type, whereas the lower amounts are related to two dimensional growth with instantaneous and some sporadic nucleation. Parameter k is a growth rate constant involving both nucleation and growth rate parameters. Figure 9 depicts the degree of crystallization of PLLA versus time for different crystallization temperatures.
Effect of talc as a nucleating agent to improve the crystallinity of PLLA in injection molding was also investigated [73]. Isothermal crystallization results illustrated that t1/2 at 105 °C was 38.2 min for neat PLA that eventually reduced to 0.6 min for sample containing 2 % Talc corresponding to a 65-fold increment in crystallization rate. In non-isothermal crystallization with the cooling rate of 10 °C/min, neat PLA displayed no crystallization temperature while the sample containing 2 % Talc exhibited a crystallization temperature around 107 °C. The combination of nucleating agent and optimum processing conditions led to an increase in final crystallinity and a reduction of injection cycle time. Strength, modulus and heat distortion temperature of sample increased noticeably.
Nofar et al. also used Talc as a nucleating agent to promote the crystallization of both linear and branched PLA [74]. It was shown that Talc was an efficient nucleating agent, especially for linear PLA. It was reported that the addition of Talc to PLA enhanced the crystallinity of PLA samples with more linear structure, whereas for more branched PLA Talc had the least effect on crystallinity suggesting the branched structure dominated crystallization already regardless of the presence of Talc.
2.7.2
Clay
Particular interest has been recently paid to nanocomposites technology consisting of a polymer matrix and organoclay because they exhibit outstandingly improved mechanical and various other properties as compared to those of virgin polymers [75]. The detailed crystallization behavior and morphology of pure PLA and PLA/C18-MMT have been described by Young Nam et al. [76]. It was observed that ordering of spherulites was much higher in the case of pure PLA than that of PLA nanocomposites because the aggregation of MMT particles, which was not nucleated during crystallization, existed inside the spherulite and then the occurrence of the regular orientation of lamella stacks inside the spherulite could be disrupted. Moreover, the overall crystallization rate of neat PLA increased after nanocomposites preparation with MMT ; however, it had no influence on the linear growth rate of pure PLA. It should be mentioned that the overall 30% increase in crystallization rate in this case, was modest when compared with Talc.
Pluta [77] also investigated the effect of clay on the crystallization of PLA. It was reported that clay reduced slightly the crystallization rate of a PLA containing 4 % D-LA and shifted
the cold crystallization temperature to higher values in comparison with pure PLA. This phenomenon was attributed to reduced chain mobility.
The nonisothermal and isothermal crystallization behaviours of PLA and PLA-Organoclay nanocomposites in the presence of three different chain extenders Polycarbodiimide (PCDI), tris nonylphenyl phosphite (TNPP), and Joncryl ADR4368F were investigated [78]. Addition of PCDI increased the cold crystallization temperature and decreased the degree of crystallinity due to lower mobility of polymer chains reacted with chain extenders. In contrast, the degree of crystallinity and crystal growth rate increased as TNPP was added. Eventually, addition of Joncryl led to the formation of long-chain branching structure which disrupted the chain packing. The rate of crystallinity and level of crystallization decreased as well. According to these articles, it can be consequently concluded that organically modified layered silicates are less effective than Talc as a common nucleating agent.
2.7.3
Bio-based nucleating agents
Amid the different nucleating agents, bio-based ones are a specific subset of interest. Crystallization half-time of PLA decreased from 38 min to 1.8 min by incorporation of 2 % of a vegetable-based ethylene bis-stearamide, (EBS). In nonisothermal melt crystallization with the cooling rate of 10 °C/min a broad and weak crystallization peak was observed around 97 °C which was less effective than talc showing a sharp exothermic peak around 108 °C [73]. As a part of genetic molecule found in deoxyribonucleic, (DNA), and ribonucleic acid, (RNA), nucleobases are biocompatible and eco-friendly [79,80]. With addition of 1 % of uracil, one kind of nucleobases, PLLA could complete its crystallization upon cooling at 10 °C/min. Crystallization half -time decreased from 16.8 min for pure PLLA at 120 °C to 1.02 min with addition of 1 % of uracil. Moreover, the crystalline structure of PLLA was not affected by uracil [80].
A new study has shown that addition of polysaccharides such as chitin, chitosan, cellulose and starch from various plants had no significant effect on the overall PLLA crystallization [81]. Effect of various additives such as PDLA, talc, fullerene (C60), montmorillonite, and various polysaccharides on the non-isothermal crystallization of PLLA was investigated as well. The effect of additives in accelerating the overall PLLA crystallization during cooling from the melt, decreased in the following order: PDLA > Talc > C60 > montmorillonite >
polysaccharides. As a result, this finding indicates that polysaccharides are not suitable nucleating agents to enhance the PLA crystallization.
Starch is a biopolymer whose blends with PLA during last years have been under investigation [82,83]. The effect of starch on crystallization of PLA is smaller than that of talc. The blends containing 1-40 % starch, have crystallization half -time in the range of 14 min to 1.8-3.2 min whilst 1 % Talc is more efficient and has a t1/2 around 0.4 min [84]. However, effect of starch becomes more remarkable when it is in its thermoplastic state [85]. By using interfacial modifier, the size of the dispersed phase in the blend of PLA/TPS decreased which had a significant effect on the crystallinity of PLA. In other words, unmodified sample did not show any exothermic peak at cooling rate of 10 °C/min while the compatibilized blend reached its maximum crystallinity level. Moreover, t1/2 was around 1.25 min for the modified blend. Polyglycolide, (PGA), and its copolymers are biodegradable aliphatic polyesters. PGA has a melting temperature of 220-230 °C which is much higher than that of PLA, 170-180°C. It could, therefore, act as a biodegradable nucleating agent for PLA. DSC studies indicated that the nucleation of PLLA was improved in the presence of PGA even at a PGA content as low as 0.1 wt.-% [86]. Increasing the amount of PGA above 3 % wt.-% led PLA and PGA to crystallize separately. A strong molecular interaction between PLA and PGA enhanced the growth of PLLA crystallites from the surface of PGA.
Thanks to its biocompatibility and high tensile properties, cellulose nanocrystals, CNC, have been examined to investigate their effect on the crystallinity of PLLA [87]. Having a 15nm diameter and 200-300nm length, the unmodified CNC exhibited no remarkable effect on the crystallinity of PLLA. However, when it was functionalized by partial silylation, SCNC, it presented a modest effect on the crystallinity. The crystallization half-time decreased 2-fold around 4 minutes with the incorporation of 1% of SCNC. Moreover, this surface treatment, improved the tensile strength and modulus of the nanocomposites. This enhancement attributed to reduction of the length of cellulose nano crystals leading to increase the efficiency of SCNC as a nucleating agent.
Cyclodextrin (CD) is a natural product of starch which has a cone shape and a hydrophobic cavity that is apolar relative to the outer surface. The penetration of polymer chains into the empty cavity of CD can lead to inclusive-complex (IC) [88]. The nucleation effect of IC has been demonstrated in several biodegradable polymers including poly (hydroxybutyrate), PHB,
poly(hydroxybutyrate valerate), PHBV, poly(butylene adipate), PBA, and poly(butylenesuccinate), PBS [89,90,91]. It is believed long polymer chains inside the CD cavity are crystallizable. Effect of IC of PLA on the crystallization of PLA has been investigated [92]. It was found α-CD had a modest effect on the crystallinity of PLA. At 118 °C, t1/2 was 40 min for pure PLA while it was around 20 min for IC-PLA. For both pure PLA and IC-PLA composite, the Avrami exponent value n ranges from 1.8 to 2.3. It consequently implies that the addition of PLA-IC might not change the crystallization mechanism of PLA. Orotic acid, OA, is also another green nucleating agent that was studied by Qiu et al. [93]. Addition of only 0.3 % of Orotic acid revealed a significant effect on the crystallinity of PLA. A sharp exothermic peak was observed by cooling the sample with the rate of 10 °C/min vicinity 124°C. The t1/2 decreased to 38 seconds at temperature around 117 °C. The nucleation mechanism of this nucleator has not been understood; however, it was postulated that a good match between the b-spacing of PLLA and the a-spacing of OA could describe such a noticeable effect. Thus far, the most efficient reported nucleating agent for increasing the crystallization of PLA is OA.
Citric acid can form complex with many metal ions. Zinc citrate, Zncit, is a frequently used zinc supplement in foods, pharmaceutical and hygienic products. Effect of Zinc citrate complex, ZnCC, a nanoscale product of the reaction of zinc acetate and citric acid, as a nucleating agent on the crystallinity of PLLA has been studied. With the addition of 0.05 % wt % ZnCC, PLLA could complete the crystallization under cooling at 10 °C/min and the crystallization half-time dropped remarkably, with this effect being more prominent as increasing ZnCC content. Epitaxy is the possible mechanism offered by the authors to explicate the nucleation phenomenon of PLLA/ZnCC system [94]. On the basis of the data of k and n, Avrami parameters, and t1/2, it was found that the nucleation ability of the three nucleating agents increased in the following order: Talc< Zncit< ZnCC. Based on WAXD patterns, an excellent matching existed between b-axis of PLLA and a-axis of ZnCC. Moreover, the hydrogen bond interaction between the hydroxyl groups of ZnCC and the carbonyl groups in PLLA chains could stabilize the nucleation process. Discrepancy between nucleation ability of Zncit and ZnCC was explained by the larger specific area of ZnCC.
PHB is one of the most famous biodegradable polyesters. Nevertheless, PHB has some weaknesses for example high crystallinity, brittleness and narrow processing window.
Blending with other polymers has been taken as an easy and profitable action to overcome the problems of this polymer [75,95,96,97]. PHB blended with PLA has drawn interests since both of them are biodegradable. Studies have shown the miscibility between these two polymers is dependent on the molecular weight of PHB [96,97]. DSC analysis results indicated that PLLA showed no miscibility with high molecular weight PHB, MW = 650000 g/mol, in different range of blend ratios. On the contrary, some limited miscibility appeared with low molecular PHB, MW=5000 g/mol, when the PHB content was below 25 %. Additionally, WAXD results showed that for all the samples, the disorder, α’, phase of PLLA was produced in the nonisothermal crystallization process which was verified by an obvious transition related to the disorder to order transition, α’to α, around 160 °C [98].
There are many bio-based nucleants acting as a nucleating agent for PLA. For the sake of brevity, other studies have not been mentioned here. Most of these chemicals have not substantial effect on the crystallization kinetics of PLA, providing that we exclude the metal-citrate groups from this classification. For example, when these nucleants are compared to Talc as a most useful nucleating element in industry, it can be concluded that their effect is moderate. Therefore, application of these materials is limited in reality. Furthermore, the majority of these blends have been fashioned in the solution state which is far away the real processing techniques like extrusion and injection molding operating in molten state.
2.7.4
Organic nucleants
Organic materials can also nucleate the crystallization of PLA physically [1]. Providing organic nucleation sites, organic nucleants are low molecular weight substances that crystallize faster at a higher temperature than the polymer. N,N Ethylenebis (12-hydroxystearamide), commercial name of WX1, was employed as a nucleator for PLLA containing 0.8 % D- content. Upon heating at 5 °C/min, the cold crystallization temperature shifted to lower temperatures, from 100.7 °C to 79.7 °C, indicating WX1 is an effective nucleating agent. Optical micrographs showed a layer of trans -crystallites grown from WX1 surface , implying the epitaxial crystallization of PLA [99].
1,3,5-benzene tricarboxyamide (BTA) and its derivatives are the other types of organic compounds with benzene moiety that was investigated by Nakajima et al. [100]. Maximum crystallinity around 44 % was achieved by incorporation of 1 % of this compound at 100 °C for 300 seconds whereas pure PLA had 17 % of crystallinity in similar circumstances. In
![Figure 2. A spherulite of iPP as observed in the optical microscope [9].](https://thumb-eu.123doks.com/thumbv2/123doknet/4998426.123864/27.892.180.733.181.485/figure-spherulite-ipp-observed-optical-microscope.webp)
![Figure 5. Spherulite radius growth rate of PLA as a function of T C [18].](https://thumb-eu.123doks.com/thumbv2/123doknet/4998426.123864/30.892.239.636.214.564/figure-spherulite-radius-growth-rate-pla-function-t.webp)
![Figure 9. Degree of crystallization of PLLA vs. time for different crystallization temperatures [1]](https://thumb-eu.123doks.com/thumbv2/123doknet/4998426.123864/38.892.177.693.619.1005/figure-degree-crystallization-plla-time-different-crystallization-temperatures.webp)
![Figure 12. Schematic of shish-kebab structure [161].](https://thumb-eu.123doks.com/thumbv2/123doknet/4998426.123864/56.892.225.617.154.432/figure-schematic-of-shish-kebab-structure.webp)