arXiv:nucl-ex/0106008v2 6 Sep 2001
Investigation of background subtraction techniques for high mass
dilepton physics
P. Crochet1 and P. Braun-Munzinger2
1 Laboratoire de Physique Corpusculaire, IN2P3/CNRS and Universit´e Blaise Pascal,
Clermont-Ferrand, France
2 Gesellschaft f¨ur Schwerionenforschung, Darmstadt, Germany
(October 17, 2018)
Abstract
The signals in high mass dilepton spectroscopy with nucleus-nucleus colli-sions at collider energies are superimposed on a generally large combinatorial background. Because this background contains a significant correlated like-sign component originating from B meson decays, the “like-like-sign” method to determine the background is inappropriate. We discuss strategies to deal with the correlations in the background. By taking advantage of the B meson os-cillation mechanism and of the particular features of B meson decays a new method to measure the b¯b production cross-section is proposed.
I. INTRODUCTION
Heavy quarkonia states provide, via their leptonic decays, an essential tool to probe the earliest stage of heavy ion collisions at ultra-relativistic energies and are considered a crucial signature for demonstrating the existence of the quark gluon plasma (QGP) and for diagnosing its properties [1–4]. The anomalous suppression of the J/ψ meson, observed in Pb + Pb reactions at CERN/SPS, is indeed considered as an indication for the creation of a deconfined medium [5]. However, the production mechanism for both open and hidden charm at SPS is a subject of intensive current debate. Thus the standard pQCD-based framework [1,2] for charmonium production and interaction with the deconfined medium is nowadays confronted with new approaches such as the statistical hadronization model [6] and the kinetic recombination model [7]. These statistical models differ from the standard approach in their predictions for higher beam energies: they imply a significant J/ψ en-hancement rather than suppression. In both approaches rescattering of heavy quarks in a deconfined medium is essential. Furthermore, a unique signature of the new mechanisms is the peculiar centrality dependence [8], a scaling of the quarkonia yield with the square of the open charm (or bottom) yield [6–8] and thermal ratios for relative yields of quarkonia states [6]. It then becomes mandatory to measure, in addition to the quarkonia yields, also the yields for open charm and open beauty. The study of high mass dileptons is therefore one of the major physics goals of RHIC and the LHC heavy ion program. This new regime of beam energies brings however the challenge of extracting, for the first time, the quarkonia signals in the presence of a significant and highly complex combinatorial background which arises mostly from the semi-leptonic decay of open charm and open bottom (up to 200 c¯c and 6 b¯b pairs are expected to be produced per central Pb + Pb collision at LHC energy). Consequently, high mass dilepton spectra exhibit peculiar features and the well known tech-niques for background subtraction which work successfully for low mass resonances at low beam energies, cannot be applied in a straightforward way.
problems related to the subtraction of the combinatorial background to the dilepton spectra at high invariant mass. We demonstrate that the peculiar characteristics of the combinatorial background at high invariant mass provides a means to measure, albeit indirectly, the number of b¯b pairs produced in the reaction.
II. SUBTRACTING THE COMBINATORIAL BACKGROUND
In the multiparticle environment characteristic of heavy ion reactions the possibility to observe a resonance relies on the fact that the reconstructed invariant mass of its decay products appears as a narrow peak signal superimposed on a broad background. Depending on the underlying physics and on the event multiplicity, the background originates from uncorrelated particles and/or from correlated particles i.e. of common origin. In principle the signal can be extracted by fitting the signal+background distribution with appropriate functions chosen in order to provide a good description of the overall spectrum. This tech-nique, however, does not work if signal and background have a similar shape. This could result either i) from a bump in the background due to physical reasons, detector acceptance, or analysis cuts, or ii) from a broad signal due to a large intrinsic resonance width and/or a smearing of this width by the apparatus resolution. In these cases it becomes difficult or even impossible to disentangle the signal and background components by fitting their sum. Obviously, the situation gets even worse when the resonant signal is small and/or when the shape of the background is unknown. These difficulties become even more obvious when extracting a continuum like the Drell-Yan, the thermal radiation, or the open charm/bottom dilepton signal. The only way to overcome this problem is to estimate independently the background distribution and to subtract it from the signal+background spectrum. Such a technique is nowadays intensively used in heavy ion collisions at high beam energies.
Considering an unlike-sign two particle invariant mass spectrum, there are mainly two ways to determine and subtract the combinatorial background:
is estimated by the number of like-sign pairs within each event. The signal S of the number of unlike-sign pairs N+−is then given by S = N+− − 2R√N++N−−where the factor R accounts for a possible asymmetry in the production of positively and nega-tively charged particle and/or an asymmetry due to a detector trigger/acceptance bias relative to the particle charge. This technique has the disadvantage that the statis-tics in the background spectrum is limited to the number of available events. On the other hand, since the number of unlike-sign pairs and like-sign pairs are calculated within the same event, the normalization of the determined background to the sig-nal+background spectrum is straightforward, provided that one knows the R factor with good accuracy.
• Event-mixing technique: the uncorrelated background in the unlike-sign pair sample is given by an unlike-sign pair spectrum for which the two particles of a pair are taken from two different events. This offers a better statistical precision than the previous method since one can mix each event with several (or even many) other events. The mixed events have to be identical in centrality. In presence of flow they have to be rotated into a common reaction plane. After normalization of the signal+background spectrum and the event-mixing spectrum to the respective number of events an additional normalization factor of 2 has to be applied to the event-mixing spectrum. Note that with real data, the normalization factor is not straightforward because, due to fluctuations and detector resolution, the centrality of the mixed events is never strictly identical. Therefore the normalization of the estimated background to the signal+background is usually done from the integration of the two spectra in a region where the correlated signal is assumed to be negligible. Note also that, in order to be applied to experimental data, the event-mixing technique requires that the two track resolution of the detector be taken into account.
Each method has its own advantages and drawbacks depending on the particle environment and on the nature of the signal to be extracted [9–11]. In particular, the event-mixing
technique can lead to incorrect results in the case of large signal-to-background. This can be intuitively understood by considering the extreme case of a sample of events where each event consists of two correlated particles only, such as a c¯c pair. In this case there would be no real background to the signal but the event-mixing technique would produce a fake background. On the other hand it is obvious that the like-sign method, which relies on the fact that a like-sign pair is always uncorrelated, will fail if the events contain like-sign correlated particle pairs.
In the following we shall show that, because the decay products of bottom decay contain like-sign correlated lepton pairs, the applicability of the like-sign technique for background subtraction in dilepton physics at the collider energies, such as currently available at RHIC and to become available at the LHC, is questionable. By making use of the differences between the background estimated with the like-sign and the event-mixing techniques, we propose a new method to measure indirectly the number of b¯b pairs from the dilepton spectra. As illustrative examples, we consider the two dilepton channels (e+
e−, µ+ µ−) in the acceptance of the ALICE detector [12] for central Pb + Pb collisions. Technical details about the simulation are given in appendix A.
III. DISCUSSION
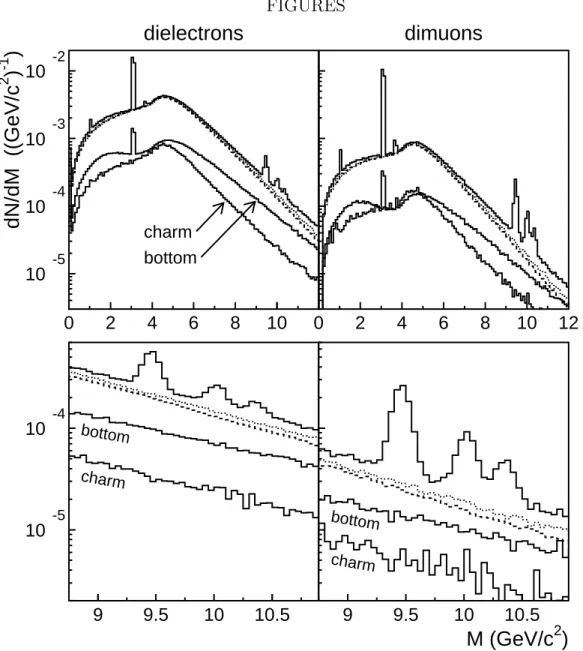
Figure 1 shows the invariant mass (M) distribution of unlike-sign lepton pairs in the ALICE detector acceptance. With a transverse momentum threshold of 2 GeV/c on each lepton, the dileptons from B meson decays are the dominant component of the combinatorial background all over the invariant mass region except for 3 <∼ M <∼ 5 GeV/c2 where the component from D meson decays is significant. Particularly interesting is the difference in shape between the two invariant mass distributions: the distribution from D meson decays exhibits one single maximum at intermediate M and a shoulder at low M while that from B meson decays shows two bumps at low and intermediate M. The bump at intermediate M results mostly from a combination of two primary leptons while the bump at low M is a
result of a combination of a primary and a secondary lepton produced by the same B meson in the so-called B-chain channel1. This channel represents a sizeable fraction of dileptons because the first generation of decay products of a B meson generally contains a D meson whose semi-leptonic decay branching ratio is rather large. On the other hand, this channel is almost inexistent for primary D mesons because the secondary leptons from charm decay mostly originate from π and K meson decay. Most of these secondary leptons which have very low momenta are removed by the transverse momentum threshold. Consequently, the dilepton distribution from D meson decay is dominated, to a large extent, by pairs of primary leptons.
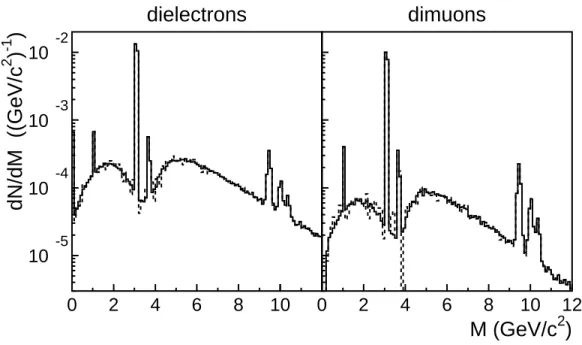
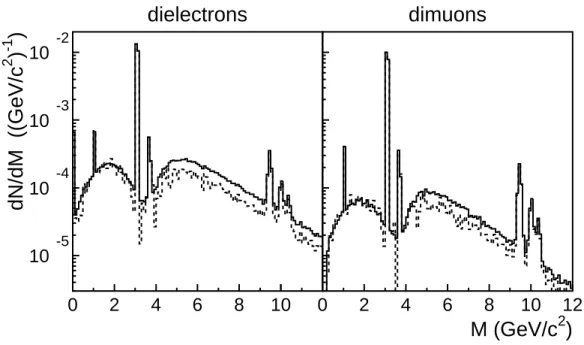
The background to the unlike-sign correlated dilepton signal is estimated by means of the two previously described techniques. The like-sign spectrum is normalized with the R factor equal to 1 since no charged particle asymmetry is present in our simulated events (more details about the R factor are given in appendix B) Concerning the event-mixing spectrum we use the standard normalization factor of 2 mentioned previously since all simulated events can be considered as strictly identical in terms of centrality. The resulting background distributions are shown by the dashed and the dotted histograms in Fig. 1. Clearly the two techniques do not lead to the same result: for large M, the background from the like-sign method systematically underestimates that from the event-mixing method. This can be better observed by inspecting Fig. 2 and 3 where the background-subtracted spectrum is compared to the sum of all unlike-sign correlated signals. Figure 2 shows that the event-mixing technique works as expected i.e. the background-subtracted spectrum is identical to the sum of the unlike-sign correlated signals (the difference between the solid and the dashed histograms is hardly visible in Fig. 2). On the other hand, Fig. 3 shows that the
1A primary lepton l
1 is a lepton directly produced by the meson Q in the first decay generation:
Q → l1 + anything. A secondary lepton l2 is a lepton produced in the second decay generation:
background-subtracted spectrum with the like-sign technique seems to describe well the unlike-sign correlated signal at low M but underestimates this signal by about 25% for M >∼ 3 GeV/c2.
Two effects contribute to the failure of the like-sign technique. Both of them are related to the particularity of the B mesons in a sense that a B¯B pair produces not only unlike-sign correlated lepton pairs, but also like-sign correlated lepton pairs:
• The first decay generation of B mesons contains ∼ 10% of primary leptons and a large fraction of D mesons which decay semi-leptonically with a branching ratio of ∼ 12%. Therefore a B¯B pair is a source of like-sign correlated pairs. For example, in the following decay chain:
B+
→ ¯D0 e+ ν
e, ¯D0 → e− anything B− → D0 π−, D0
→ e+ anything
the B+B− pair produces a correlated e+e+ pair in addition to the e+e− pair. • Like the K0K¯0
system, the 2 neutral B0¯ B0 meson systems B0 dB¯ 0 d and B 0 sB¯ 0 s undergo the phenomenon of particle-antiparticle mixing (or oscillation). This effect is quantified by the so-called mixing parameter χd (χs) which corresponds to the time-integrated probability that a produced B0
d (B 0 s) decays as a ¯B 0 d ( ¯B 0
s) and vice versa. The mixing parameters are predicted by the Standard Model and have been measured experi-mentally [13]. They are estimated to χd = 0.17 and χs ≥ 0.49. Therefore, a B0dB¯
0 d
(B0 sB¯
0
s) pair produces, in the primary dilepton channel, ∼ 70% (∼ 50%) of unlike-sign correlated lepton pairs and ∼ 30% (∼ 50%) of like-sign correlated lepton pairs. Due to these effects the unlike-sign dilepton spectrum does not contain the full correlated signal because a part of this correlated signal is made of like-sign lepton pairs. Conse-quently, the like-sign subtraction removes from the unlike-sign dilepton spectrum not only the uncorrelated component but also a fraction of the correlated signal. Note that, in the case presented in Fig. 3, the use of the like-sign technique to subtract the background to the Υ signal would bias only weakly the result because the yield in the resonances peak is
much larger than the yield in the background below these peaks. On the contrary, this bias would become important in the case of a strong Υ suppression which would manifest itself by an almost vanishing peak. It is obvious that it would become even more important for continuum physics.
Figure 4 shows the like-sign and the unlike-sign correlated components. For M <∼ 3 GeV/c2, the correlated B meson decay distribution almost exclusively consists of unlike-sign pairs. For M >∼ 3 GeV/c2, the like-sign correlated component reaches about 45% of the unlike-sign correlated component. The like-sign correlated component arising from B0 mixing amounts to about 30% of the total like-sign correlated distribution.
Since D mesons do not oscillate (no evidence for D meson oscillation has been observed so far [13]), a D ¯D pair cannot produce a like-sign correlated lepton pair in the primary decay generation. Nevertheless, D mesons can generate like-sign correlated lepton pairs from their decay chain. It can be seen from Fig. 5 that the corresponding size of the effect is very weak in both the dielectron channel and the dimuon channel. As already mentioned, this is due to the fact that most of the secondary leptons from charm decay are removed by the transverse momentum threshold of 2 GeV/c.
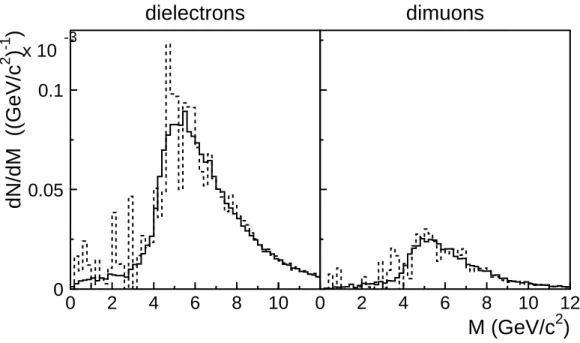
As shown above, the event-mixing background does not contain any correlated signal whereas the sign background contains, in addition to the uncorrelated signal, the like-sign correlated lepton pairs from bottom decay. Therefore, subtracting the first background from the second one should get access to the like-sign correlated component. Figure 6 shows that this is indeed the case in the present simulations: when subtracting the event-mixing spectrum from the like-sign spectrum, one obtains a non-zero distribution which corresponds precisely to the like-sign correlated component from bottom decay. The latter is directly connected to the full b¯b cross-section since any change in the b¯b cross-section will translate into a proportional change in the like-sign correlated dilepton yield. The signal obtained from the subtraction of the two background distributions can therefore be considered as a reliable measurement of the number of b¯b pairs. Indeed, neither a resonance nor the thermal radiation nor the Drell-Yan mechanism can provide like-sign correlated dileptons
and, as shown in Fig. 5, the amount of like-sign correlated lepton pairs from charm decay is negligible when applying a pt threshold of 2 GeV/c on both leptons.
Note that one could also get a model-independent estimate of the number of b¯b pairs from the integration of the background-subtracted unlike-sign spectrum at high invariant mass where the dileptons from bottom decay dominate (Fig. 1). However, this could lead to a non-pure bottom sample since the integrated signal would contain all kind of unlike-sign correlated pairs. In particular, it would contain the Drell-Yan unlike-signal whose yield could become significantly large relative to the sum of correlated charm and bottom yields in the case of strong energy loss effects on heavy quarks [14]. It would also contain the unlike-sign correlated pairs from charm whose thermal production cross-section could be enhanced for a QGP with a relatively high temperature [15,16], as well as lepton pairs from a thermalized hot QGP.
We point out that whereas in e+e−reactions a good understanding of open beauty hadron production, sample composition and decay has been recently achieved [13], in nucleus-nucleus reactions none of the open beauty hadrons has ever been measured so far (this holds even for open charm hadrons). For the present investigations we have assumed that B meson production, mixing, and decay can be extrapolated from nucleon-nucleon collisions to nucleus-nucleus collisions by multiplication with the number of binary collisions. The reality may be far from this, and it is indeed a major goal of the ultra-relativistic heavy ion program to study the differences. However, for the present studies which concern mostly the signal/background we believe that the current investigation addresses the crucial and important new points which can be studied in the heavy ion environment.
Note, finally, that the proposed method provides a global estimate of the like-sign signal from bottom including the signal from B0 mixing and from the B meson decay chain. Fur-ther detailed investigations should reveal wheFur-ther the two contributions might be identified separately by means of further constraints on the kinematical characteristics of the lepton pairs.
IV. CONCLUSIONS
We have presented some features of high mass dilepton spectra in heavy ion collisions at collider energies with special emphasis on the determination of the continuum background at high invariant masses. Our investigations show that the combinatorial background contains a large amount of dileptons from bottom decay. Because bottom decay is a source of like-sign correlated lepton pairs, the result of the background determination using the like-like-sign technique is inappropriate. The event-mixing method is not affected by this effect and gives a reliable estimate of the combinatorial background. We have demonstrated that, by subtracting the event-mixing distribution from the like-sign distribution, one obtains a precise estimate of the yield of like-sign correlated lepton pairs from bottom decay. These results are relevant for analysis of data from RHIC and the LHC.
ACKNOWLEDGEMENTS
We thank D. Mi´skowiec for careful reading of the manuscript and for useful comments.
APPENDIX A: SIMULATION ENVIRONMENT
Our simulation is similar to that presented in [17]. It consists of the following steps: • Open charm and open bottom in central Pb + Pb reactions are computed with
PYTHIA 5.7 [18] assuming that a Pb + Pb collision is a superposition of a certain number of p+p reactions. We use the GRVH0 parton distribution function to nor-malize the production cross-sections in p+p reactions at √s = 5.5 TeV to 6.7 mb and 0.2 mb for charm and bottom respectively [19]. These cross-sections are then extrapolated to Pb + Pb collisions at impact parameter b = 0 fm with the nuclear overlap function TPbPb(0) = 30.4 mb−1 [20]. It results into 205 c¯c and 6 b¯b per central Pb + Pb event.
• The heavy quarks hadronize into heavy mesons through a Peterson fragmentation function [21]. The c(¯c) quarks are assumed to fragment into D+(D−), D0( ¯D0), and D+
s (D−s ) mesons. For the b(¯b) quarks, we consider B
+(B−), B0( ¯B0), B0 s( ¯B 0 s), and Λ0 b( ¯Λ 0 b).
• Heavy mesons decay according to JETSET 6.4 [18] with free decay branching ratios. • Resonance events including φ, J/ψ, ψ′, Υ, Υ′ and Υ′′ are generated separately with
yields and spectra taken from [22,23]. The resonances decay according to JETSET with fixed branching ratio.
• The ALICE detector response is modeled in a simple way by2: – geometrical conditions: 45◦ < Θ
e < 135◦ and 2◦ < Θµ < 9◦ where Θe and Θµ denote the polar angle of electrons and muons, respectively;
– lower and upper transverse momentum thresholds: 2 < pt < 10 GeV/c for both electrons and muons;
– conditions on vertex: ve
t < 3 cm and vzµ < 100 cm where v e
t and vzµ are the electron transverse distance and muon longitudinal distance between the interac-tion point and the track vertex. The second vertex cut simulates the effect of the front absorber of the muon spectrometer;
– transverse momentum resolution: ∆pt/pt increases linearly from 0.6% at pt=1 GeV/c to 1.4% at pt=10 GeV/c for both electrons and muons.
• The leptonic component of central Pb + Pb events is constructed by means of a cocktail of the generated leptons from open charm, open bottom and resonances. Each lepton is given a weight which includes the production cross-section of its source folded with the
2We do not intend to reproduce detailed features of the ALICE detector response but use
actual number of simulated sources per event and the corresponding decay branching ratio. The weight and the momentum components of the leptons are registered keeping the information on the direct parent and the grandparent of the decay product. This allows to trace back the composition of final spectra.
Leptons from other sources are neglected. Not taken into account in the simulation are: shadowing of the structure functions, energy loss of the partons in the medium, rescattering of heavy mesons, suppression/enhancement of the resonance yields. The ALICE detector filter assumes perfect particle identification and efficiency.
APPENDIX B: ORIGINS OF CHARGE ASYMMETRY AND THE R FACTOR
The presence of an asymmetry in the production of positive and negative charged back-ground leptons leads to an enhancement of the like-sign dileptons relative to the unlike-sign dileptons. Therefore, the correct normalization of the like-sign spectrum relies on a precise determination of the R factor. We discuss here the origins of possible charge asymmetries in nucleus-nucleus reactions, in which conditions this leads to a R factor different from unity and how to estimate R in this case.
Charge asymmetry at the production level
At least three physical effects at the particle production level can lead to a charge asym-metry in the final stage of nucleus-nucleus reactions:
• charge conservation implies an excess of positively charged hadrons in the final state because the colliding ions are positively charged;
• isospin conservation implies a ratio π−/π+ > 1 because the ion N/Z ratio is larger than 1;
It is obvious that these asymmetries propagate to the decayed leptons. However in central nucleus-nucleus reactions the multiplicity of charged particles produced in the interaction is so large that any initial charge asymmetry is smeared-out [24]. In fact, it can be demon-strated that R = 1 exactly if the particle multiplicities are Poisonnian [25]. This has also been shown by means of Monte-Carlo simulations for central Pb + Pb reactions at SPS [24]. The charge asymmetry tends to vanish with increasing beam energy as evidenced by the mea-sured π−/π+
ratio which goes, in central Au + Au reactions, from 2.15±0.30 at GSI/SIS [26] to 1.00±0.02 at RHIC [27].
On the contrary, the previous statement is not valid anymore in low multiplicity events like non-central nucleus-nucleus reactions. In this case R is larger than unity. Its actual value can be precisely determined by means of simulations [24]. Even in this case R differs only slightly from unity. Indeed in peripheral (b ∼ 13 fm) Pb + Pb collisions at SPS, the R factor for dimuons in the acceptance of the NA50 spectrometer is found to be 1.075 [24]. It should be even closer to unity at higher beam energy thanks to the larger particle multiplicity.
Charge asymmetry due to a detector acceptance/trigger bias
A charge asymmetry in the lepton sample can also be the consequence of a possible detector bias relative to the lepton charge. The detector bias caused by a different acceptance for positively and negatively charged particle is usually taken into account by averaging the data collected with the two opposite settings of the magnetic field [25]. Similarly a charge asymmetry could result from a different probability for the trigger system to accept like-sign and unlike-sign events. Such an effect can be estimated by means of simulations as discussed in [28].
REFERENCES
[1] T. Matsui and H. Satz, Phys. Lett. B 178 (1986) 416.[2] H. Satz, Rep. Prog. Phys. 63 (2000) 1511, Nucl. Phys., A 661 (1999) 104c. [3] R. Vogt, Phys. Rep., 310 (1999) 197.
[4] J.F. Gunion, R. Vogt, Nucl. Phys. B 492 (1997) 301.
[5] M.C. Abreu et al., NA50 collaboration, Phys. Lett. B 477 (2000) 28. [6] P. Braun-Munzinger, J. Stachel, Phys. Lett. B 490 (2000) 196.
[7] R.L. Thews, M. Schroedter, J. Rafelski, Phys. Rev. C 63 (2001) 054905. [8] P. Braun-Munzinger, J. Stachel, Nucl. Phys. A 690 (2001) 119.
[9] D. L’Hote, Nucl. Instrum. Methods A 337 (1994) 544.
[10] M. Ga´zdzicki, M.I. Gorenstein, J. Phys. G: Nucl. Part. Phys. 27 (2001) L41. [11] N.van Eijndhoven, W. Wetzels, hep-ph/0101084.
[12] ALICE Technical Proposal, CERN/LHCC 95-71. [13] D.E. Groom et al, Euro. Phys. Jour. C 15 (2000) 1.
[14] B. K¨ampfer, O.P. Pavlenko, K. Gallmeister, Phys. Lett. B 419 (1998) 412. [15] E. Shuryak, Phys. Rev. Lett. 68 (1992) 3270.
[16] K. Geiger, Phys. Rev. D 48 (1993) 4129. [17] Z. Lin, R. Vogt, Nucl. Phys. B 544 (1999) 339. [18] T. Sj¨ostrand, Comput. Phys. Commun. 82 (1994) 74,
http://www.thep.lu.se/tf2/staff/torbjorn/Pythia.html.
X.N. Wang, Int. J. Mod. Phys. A 10 (1995) 2999. [20] R. Vogt, Heavy Ion Phys. 9 (1999) 339.
[21] C. Peterson, D. Schlatter, I. Schmitt, P.M. Zerwas, Phys. Rev. D 27 (1983) 105. [22] Addendum to the ALICE Technical Proposal, CERN/LHCC 99-13.
[23] Addendum to the ALICE Technical Proposal, CERN/LHCC 96-32. [24] M.C. Abreu et al., NA50 collaboration, Eur. Phys. J. C 14 (2000) 443.
[25] F. Bellaiche, Doctorat de l’Universit´e, Universit´e Claude Bernard Lyon-I, IPN-Lyon, LYCEN T9735 (1997),
http://lyoinfo.in2p3.fr/eiexp/theses/bellaiche/these.html. [26] D. Pelte et al., FOPI collaboration, Z. Phys. A 357 (1997) 215. [27] B.B. Back et al., PHOBOS collaboration, hep-ex/0104032.
FIGURES 10 -5 10 -4 10 -3 10 -2 0 2 4 6 8 10 charm bottom
dN/dM ((GeV/c
2)
-1)
dielectrons
0 2 4 6 8 10 12dimuons
10 -5 10 -4 9 9.5 10 10.5 bottom charm 9 9.5 10 10.5 bottom charmM (GeV/c
2)
FIG. 1. Invariant mass distributions of unlike-sign dielectrons (left) and unlike-sign dimuons (right) for central Pb + Pb reactions at LHC energy. The events are filtered through the ALICE de-tector acceptance cuts as described in the text. The top (solid) histogram on each figure comprises the sum of all unlike-sign lepton pairs. The dashed and dotted histograms show the background determined by the event-mixing technique and with the like-sign technique, respectively. The his-tograms labeled charm and bottom correspond to the component where both leptons result from D and B meson decay, respectively. The two lower panels are zooms of the upper panels in the invariant mass region of the Υ family.
10 -5 10 -4 10 -3 10 -2 0 2 4 6 8 10
dN/dM ((GeV/c
2)
-1)
dielectrons
0 2 4 6 8 10 12M (GeV/c
2)
dimuons
FIG. 2. Invariant mass distributions of unlike-sign correlated dileptons (solid histograms) for central Pb + Pb reactions at LHC energy. The events are filtered through the ALICE detector acceptance cuts as described in the text. The dashed histogram is obtained by the subtraction of the background, determined by the event-mixing technique, from the total distribution. For more details, see text.
10 -5 10 -4 10 -3 10 -2 0 2 4 6 8 10
dN/dM ((GeV/c
2)
-1)
dielectrons
0 2 4 6 8 10 12M (GeV/c
2)
dimuons
FIG. 3. Same as Fig. 2 but using the like-sign technique instead of the event-mixing technique for the determination of the background.
10 -6 10 -5 10 -4 10 -3 0 2 4 6 8 10
dN/dM ((GeV/c
2)
-1)
dielectrons
0 2 4 6 8 10 12M (GeV/c
2)
dimuons
FIG. 4. Invariant mass distributions of correlated dileptons from bottom decay for central Pb + Pb reactions at LHC energy. The events are filtered through the ALICE detector acceptance cuts as described in the text. The unlike-sign and like-sign components are shown by the solid and dashed histograms, respectively. The dotted histogram represents the like-sign component which results from B0B¯0 mixing.
10 -7 10 -6 10 -5 10 -4 0 2 4 6 8 10
dN/dM ((GeV/c
2)
-1)
dielectrons
0 2 4 6 8 10 12M (GeV/c
2)
dimuons
FIG. 5. Invariant mass distributions of correlated dileptons from charm decay for central Pb + Pb reactions at LHC energy. The events are filtered through the ALICE detector accep-tance cuts as described in the text. The unlike-sign and like-sign components are shown by the solid and dashed histograms, respectively.
0 0.05 0.1 x 10 -3 0 2 4 6 8 10
dN/dM ((GeV/c
2)
-1)
dielectrons
0 2 4 6 8 10 12M (GeV/c
2)
dimuons
FIG. 6. Invariant mass distributions of dileptons for central Pb + Pb reactions at LHC energy. The events are filtered through the ALICE detector acceptance cuts as described in the text. Solid histogram: like-sign correlated dileptons from B meson decays. Dashed histogram: distributions obtained after subtraction of the background estimated with the event-mixing technique from the one estimated by the like-sign technique.