ac magnetic behavior of large-grain magnetoresistive La
0.78Ca
0.22Mn
0.90O
xmaterials
Ph. Vanderbemden*SUPRATECS and Department of Electrical Engineering and Computer Science (Montefiore Institute) B28, University of Lie`ge, Sart-Tilman, B-4000 Lie`ge, Belgium
B. Vertruyen, A. Rulmont, and R. Cloots
SUPRATECS and Chemistry Institute B6, University of Lie`ge, Sart-Tilman, B-4000 Lie`ge, Belgium
G. Dhalenne
Laboratoire de Physico-Chimie de l’Etat Solide, Universite´ Paris-Sud, 91405 Orsay Cedex, France
M. Ausloos
SUPRATECS and Physics Institute B5, University of Lie`ge, Sart-Tilman, B-4000 Lie`ge, Belgium 共Received 11 July 2003; published 19 December 2003兲
We report a detailed set of ac magnetic measurements carried out on bulk large grain La-Ca-Mn-O samples extracted from a floating zone method-grown rod. Three samples with La0.78Ca0.22Mn0.90Oxstoichiometry but differing in their microstructure were investigated by electrical resistivity and ac susceptibility measurements: 共i兲 a single grain sample, 共ii兲 a sample containing two grains, and 共iii兲 a polycrystalline sample. We show that the superimposition of dc magnetic fields during ac magnetic susceptibility measurements is an efficient way for characterizing the magnetic transition of samples with different microstructures. Whereas both single grain and polycrystalline samples display a single susceptibility peak, an additional kink structure is observed in the case of the double grain sample. The temperature dependence of the ac susceptibility measured with superim-posed dc magnetic fields is analyzed in the framework of second-order phase transition ideas. The relations between the critical exponents (⫹␥⬃1.5,␦⬃2.5) are found to be close to those of the mean-field model for all samples. This is attributed to the disordering caused by unoccupied Mn sites.
DOI: 10.1103/PhysRevB.68.224418 PACS number共s兲: 75.47.Gk, 75.47.Lx, 71.30.⫹h, 61.72.Mm
I. INTRODUCTION
The interest in manganese perovskite compounds of the Ln1⫺xAxMnO3⫹/⫺d family 共where Ln is a large lanthanide
and A generally an alkaline-earth兲 has been recently revived after the discovery of CMR 共colossal magnetoresistance兲 properties in some of these materials:1–3the electrical
resis-tivity, exhibiting a maximum at a given temperature TM I corresponding to a metal-insulator transition, is drastically suppressed under the application of a magnetic field. These materials are also characterized by a ferromagnetic-paramagnetic transition at a temperature TC close to TM I noticeable in various physical properties.4
More generally, the research activity on CMR materials brings out underlying fundamental aspects which are of great interest for the physics of highly correlated electron systems.2 The physical properties of these compounds are
influenced by several parameters. The two most meaningful ones are the Mn4⫹/Mn3⫹ ratio 共i.e., the charge carrier
density兲5 and the Mn-O-Mn bond angle, which affects the
orbital overlapping between neighboring ions.6
Beside these intrinsic parameters, the microstructure of these materials was shown to influence strongly their electri-cal transport properties, as proved by comparative studies of thin films, bulk ceramics and single crystals.7–16 In single
crystals and epitaxial thin films, the magnetoresistance is quite large and concentrated in the vicinity of the transition temperature TC whereas in polycrystalline materials—either bulk ceramics or thin films—a significant magnetoresistance is displayed at low fields for all temperatures below TC.
Unlike the transport properties, the magnetic properties of polycrystalline CMR materials were shown to be weakly in-fluenced by their microstructure.15,17To our knowledge how-ever, no systematic study of magnetic properties has been performed on bulk CMR material containing either one single grain or two grains separated by a single grain bound-ary. In the present study we report and discuss ac magnetic susceptibility measurements carried out on such large grain samples, with the emphasis placed on the study of magnetic fluctuations around the transition temperature. In a previous work18 we have reported the characterization of these
samples through electrical resistivity and dc magnetization measurements.
ac magnetic susceptibility measurements have been widely used for characterizing the magnetic transitions oc-curring in various materials,19,20 including CMR
materials.17,21–23 However, in such complex materials as
manganites, the actual magnetic structure often results from the competition between several magnetic states of similar ground-state energy 共ferromagnetic, antiferromagnetic, charge-ordered,...兲.24,25 This can even lead to so-called
phase-separated materials, where two magnetic phases coex-ist in a single crystal.26,27Consequently, the physical
mecha-nisms governing the magnetic response cannot always be distinctly sorted out through an ac susceptibility experiment. As an example, a frequency dependence of the ac suscepti-bility can be due to either an intrinsic spin glass behavior or to extrinsic phenomena such as domain wall pinning.28 De-pending on the sample homogeneity, the magnetic transition may also occur over a wide temperature range.29 Therefore
the analysis of an ac magnetic response can be difficult and sometimes inconclusive.
When the temperature dependence of the ac susceptibility is measured in presence of dc field, the low temperature (T ⬍TC) signal contribution due to the physical mechanisms mentioned above is progressively driven to saturation, allow-ing the emergence of a universal signal contribution arisallow-ing from critical fluctuations.23As a result, a sharp peak in the
in-phase ac susceptibility
⬘
(T) can be clearly identified near TC. A comprehensive review of the theoretical and ex-perimental aspects relative to the origin of this peak and its field dependence has been carried out by Williams,23withinthe classical framework of a second order paramagnetic/ ferromagnetic transition theory. The presence of the peak was shown experimentally in dilute magnetic systems such as AuFe,30 PdMn,31 and amorphous ferromagnetic alloys.32 More recently, a similar behavior was also depicted in CMR ceramics such as La0.67Pb0.33MnO3,33La
0.67Ca0.33MnO3,17,34
and La1⫺xMgxMnO3.35–37It should be emphasized that all
these works refer to polycrystalline samples containing grains whose size is typically smaller than ⬃50m. The present study is concerned with the comparison of the mag-netic properties of bulk La-Ca-Mn-O samples containing ei-ther 共i兲 one single large grain or 共ii兲 two large grains sepa-rated by a single grain boundary. The results are compared to those obtained in polycrystalline samples of the same mate-rial.
II. EXPERIMENT A. Synthesis process
A 30-mm-long 4-mm-diam cylindrical rod of calcium-doped lanthanum manganate 共LCMO兲 was grown by the floating zone method. The details of the synthesis procedure as well as specific growth features have been described in a previous paper.18The material microstructure was examined
by polarized light optical microscopy共Olympus AH3-UMA兲. The observation of the rod cross section at several locations between both ends shows that the mean grain size progres-sively increases and finally reaches⬃1 mm3near the far end
of the rod, as sketched in Fig. 1. A polarized light microgra-phy of a cross section in the far end of the rod is also shown in Fig. 1, revealing the presence of only three large grains.
Three bar-shaped samples of typical 0.1⫻0.2⫻0.8 mm3size
were carefully excised from the rod using a wire saw. Their microstructures are single grain 共SG兲, double grain 共DG兲, and polygranular 共PG兲.
Energy dispersive x-ray 共EDX兲 analysis 共Oxford Link Pentafet兲 of each sample showed an homogeneous chemical composition, within the uncertainty of the EDX method. However, this chemical composition was found to differ from the nominal stoichiometry (La0.7Ca0.3MnO3). This phe-nomenon is due 共i兲 to the manganese loss by vaporization during the growth of the rod and共ii兲 to the low value of the calcium distribution coefficient between solid and liquid phases.38 More precisely, the cationic composition
deter-mined by EDX turns out to be La0.78Ca0.22Mn0.90Ox. More-over, the knowledge of the density 共6.07, measured by the Archimedes’ method兲 and the cell volume (233.9 Å3, refined
from XRD data in the Pbnm space group, with the FULL-PROF software兲 has enabled us to calculate the molar mass. The oxygen content could thus be estimated, yielding a chemical composition close to La0.78Ca0.22Mn0.90O2.94. The
theoretical number of Bohr magnetons estimated for such a chemical content (3.20B) is in good agreement with the
experimental value (3.17B) determined by measuring the
saturation magnetization at T⫽50 K and0H⫽5 T.18 B. Physical measurements
dc magnetic moment measurements at several tempera-tures were carried out in a Quantum Design Physical Prop-erty Measurement System 共PPMS兲, using an extraction method. ac magnetic susceptibility measurements were per-formed both in a home-made susceptometer39 and in the PPMS. Before each measuring sequence, the remnant field of the superconducting magnet was eliminated by applying a succession of decreasing fields in alternate directions.
Transport measurements were carried out on the three specimens using the conventional 4-point technique. Very small electrical contacts were achieved by attaching thin gold wires 共33 m diameter兲 to the samples using DuPont 6838 silver epoxy paste annealed in flowing O2for 5 min. In
the sample containing two grains 共DG兲, the electrical con-tacts were placed across the single grain boundary. The elec-trical resistance vs temperature R(T) curves measured under applied dc magnetic fields ranging from 0 to 1 T were re-corded in the Quantum Design PPMS between 20 K and room temperature.
III. RESULTS A. Electrical resistivity
The temperature dependence of the electrical resistivity of the three La-Ca-Mn-O samples is shown in Fig. 2. The data are measured with a 1 mA injection current parallel to the long axis of each sample. All samples display the overall characteristics of a transition from a low temperature metal-liclike state (d/dT⬎0) to a high temperature insulatorlike behavior (d/dT⬍0). Both the single grain 共SG兲 and double grain 共DG兲 samples display a sharp peak at T⫽Tp⬃196 K and very similar electrical resistivity values at temperatures
FIG. 1. 共Left兲 Schematic diagram of the far end of the La-Ca-Mn-O rod showing the locations where three samples were ex-tracted: SG⫽single grain; DG⫽double grain; PG⫽polygranular sample.共Right兲 Optical polarized-light micrography of a cross sec-tion in the far end of the rod.
T⬎Tp. Their behavior markedly differs for T⬍Tp: the re-sistivity of the single grain sample共SG兲 is significantly lower than the resistivity measured across the grain boundary in the sample containing two grains共DG兲. At T⫽20 K, the electri-cal resistivity values for SG and DG samples are 0.57 and 2.2⍀ m, respectively. The use of a semilog scale in Fig. 2 allows us to compare qualitatively the (T) curves of both samples for T⬍Tp: the double grain sample exhibits a slight shoulder structure whereas the data measured for the single grain do not display any inflexion point. The presence of such a shoulder in the resistivity curve is the signature of the presence of a grain boundary in the DG sample,18while the
data measured on the SG sample are similar to those mea-sured on LCMO single crystals.7,25,30,41The clear differences
in the resistivity behavior of the SG and the DG samples do also confirm, a posteriori, that no ‘‘unseen’’ grain boundary is present in the ‘‘single grain.’’
The polygranular sample 共PG兲 is characterized by much higher electrical resistivity values than the SG and DG samples. For T⬎Tp, the resistivity of PG lies one order of magnitude above that of SG and of DG. The PG resistivity peak around T⬃Tp is quite smooth but perceptibly emerges from the large resistivity signal occurring at T⬍Tp. At T ⫽20 K, the electrical resistivity of the PG sample is 2500 ⍀ m, i.e., three orders of magnitude above the resistivity of the DG sample. All these characteristics are consistent with the polycrystalline nature of the PG sample containing a sig-nificant number of grain boundaries, which inhibit the cur-rent flow and are thus responsible for the higher resistivity values.
The transition temperature TM I of each of the three samples was determined by locating the main inflexion point of (T), yielding values of 190.2 K, 188.5 K, and 192.5 K for the SG, DG, and PG samples, respectively. It should be noticed however that the sharpest of the three resistive tran-sitions, i.e., that of the SG sample, is expected to be the most
appropriate for getting an accurate TM I determination. These TM I values are in agreement with those reported in the lit-erature for similar chemical composition.40
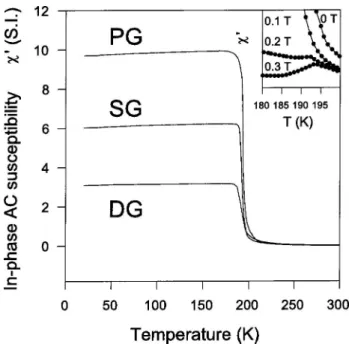
B. ac susceptibility
The temperature dependence of the ac susceptibility of the three samples was first measured for a 1 mT and 1 kHz applied ac magnetic field without bias dc magnetic field. All reported measurements共Fig. 3兲 were carried out in zero-field cooling, but no noticeable difference was observed with re-spect to the field cooled procedure, within experimental un-certainty. On lowering the temperature, the susceptibility in-creases rapidly when the system undergoes the metal-insulator transition at T⫽TC, becoming nearly temperature independent below TC. A careful examination of the data shows that the susceptibility passes through a maximum共the so-called Hopkinson peak43兲, and then slowly decreases with
a very small (d
⬘
/dT) value. The behavior is in good overall agreement with existing measurements on other CMR samples17,21–23and displays the characteristics of a classical paramagnetic-ferromagnetic phase transition.42,43 Themag-netic transition is somewhat sharper for the single grain sample SG than for the DG and PG samples. The rather small (d
⬘
/dT) observed for the three samples at T⬍TC strongly suggests that the ⬘
(T) dependence is bounded to some value determined by the sample geometry. Using the classical notations, the internal magnetic field Hiis given by Ha– D•M, where Ha and M respectively denote the applied field and the sample magnetization; D is the demagnetization factor (0⬍D⬍1). For materials exhibiting a high suscepti-bility (M /Hi), the measured apparent susceptibility (M /Ha) is limited to a maximum value roughly given by 1/D. This FIG. 2. Comparison of the electrical resistivity vs temperaturecurves measured on the single grain 共SG兲, the double grain 共DG兲, and the polycrystalline共PG兲 samples.
FIG. 3. Temperature dependence of the real component (⬘) of the ac susceptibility measured on the single grain共SG兲, the double grain共DG兲, and the polycrystalline 共PG兲 samples. Inset: evolution of the⬘(T) curves of the DG sample under several superimposed dc magnetic fields ranging from 0 to 0.3 T.
limit is fixed by the sample dimensions and is therefore tem-perature independent, as observed in Fig. 3. Using the data of Fig. 3, one can estimate the demagnetization factors of the SG, DG, and PG samples to be respectively 0.16, 0.22, and 0.10, consistent with the values of 0.14, 0.19, and 0.09 esti-mated from the sample dimensions.44Hence the differences in the low temperature
⬘
values for the three samples are caused by their geometry rather than by their microstructure. It is well known that small-D 共i.e., long and thin兲 samples should be preferred for the study of magnetic properties but it was not possible to extract long specimens in the case of our quasi-single-grain materials. Therefore these geometrical effects have to be taken into account in the present study.The temperature dependence of the ac susceptibility was also measured under various superimposed dc magnetic fields. Both ac and dc magnetic fields were parallel to the long axis of the samples. The inset of Fig. 3 shows the typi-cal evolution of the ac susceptibility in-phase component
⬘
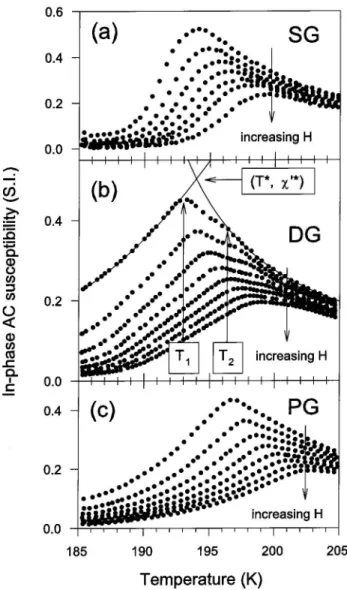
for the DG sample under increasing dc fields ranging from 0.1 to 0.3 T. A distinct peak appears around the transition temperature. Figure 4 focuses on the evolution of this
⬘
(T) peak for larger dc bias fields, i.e., from 0.3 T to 1 T. The⬘
data plotted in Fig. 4 are corrected for demagnetization ef-fects using the demagnetization factor of each specimen de-termined as above. All samples display the same overall be-havior: when increasing the dc field amplitude, the maximum of
⬘
shifts to higher temperatures, decreases in amplitude and is progressively smeared out, in agreement with the data reported previously for other ferromagnetic systems.23Strikingly, however, the DG sample displays a well-defined kink structure, which is not observed in the single grain共SG兲 and the polycrystalline 共PG兲 samples. This can be clearly seen in the upper curve in Fig. 4共b兲 (0H⫽0.3 T):
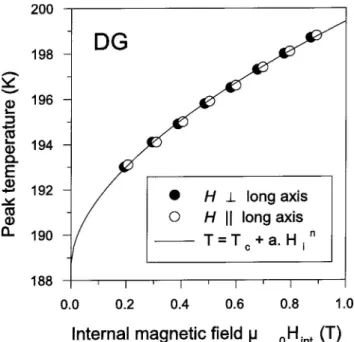
the main peak, located at T1⫽193.2 K, is followed by a kink around T2⫽196.5 K. On increasing the applied dc field
am-plitude, the behavior of this kink mimics that of the main peak. For applied magnetic fields exceeding ⬃0.8 T both peaks merge into one large bump. Measurements with a magnetic field perpendicular to the long axis of the DG sample (D⬃0.42) display a behavior entirely similar to the one depicted in Fig. 4共b兲 but with slightly different peak temperatures.
In Fig. 5, we have plotted the main peak temperature T1 of the DG sample as a function of the internal magnetic field Hi, calculated by the formula Hi⫽Ha– D•M, where Ha is the applied magnetic field and M is the dc magnetization value, carefully measured at each (T1, Ha) point, i.e., at the peak temperature T1 corresponding to the applied field Ha. As can be seen on the figure, the data sets collected for each dc field orientation follow one single curve when plotted as a function of the internal magnetic field. This indicates that there is no intrinsic anisotropy in the susceptibility behavior of the sample.
In summary, the results show that 共i兲 the resistivity data confirm what could be expected from the microstructure of each sample, 共ii兲 the resistive and magnetic transitions are the sharpest for the single grain sample SG,共iii兲 the zero-dc field ac susceptibility behavior is dominated by geometric effects, 共iv兲 the dg sample displays a perceptible kink
struc-ture in the
⬘
(T) data measured under bias static magnetic fields. The details, differences and similarities in the ac mag-netic properties of the three samples are the subject of Sec. IV.IV. DISCUSSION
First of all, it should be noticed that the transition tem-perature of all studied samples lies around 190 K, which is lower than the transition temperature (TC⬇260 K) charac-teristic of the La0.7Ca0.3MnO3stoichiometry. In fact, the
tran-sition temperature lies between those measured for La1⫺xCaxMnO3 single crystals40 with x⫽0.225 and x
⫽0.275. This feature can be attributed to the actual chemical composition of the sample (La0.78Ca0.22Mn0.90O2.94), which
displays Mn deficiency and lower Ca/La ratio with respect to the nominal composition 共see Sec. II A兲.
FIG. 4. Real component (⬘) of the ac susceptibility measured on the single grain共SG兲, the double grain 共DG兲, and the polycrys-talline 共PG兲 samples for several superimposed dc magnetic fields ranging from 0.3 to 1 T, with 0.1 T steps. The lines in共b兲 represent data extrapolated from outside the temperature window containing the two peaks.
A. Critical fluctuations analysis
In Ref. 17 dealing with the magnetic properties of a La0.67Ca0.33MnO3 polycrystalline material, it was shown that
the locus of the
⬘
(T) maxima measured for several dc fields defines a crossover line above which the magnetic response is thermally dominated, and below which the response is field dominated. In terms of the usual reduced fields and temperatures given by h⬃Hi/TCand t⫽兩T⫺TC兩/TCand us-ing the scalus-ing law equation of state,23the producth tm⫺(␥⫹)
should be a constant. In this equation,␥andare the critical exponents and tmdenotes the reduced temperature at the
⬘
peak. This suggests that the peak temperature Tpmeasured in all samples should fit a relationship given byTp⫽TC⫹a•Hin,
with an exponent n equal to 1/(⫹␥). The fitting param-eters obtained for the SG, DG, and PG samples are listed in Table I. The DG sample case is illustrated in Fig. 5. The (⫹␥) values are seen to range between 1.39 and 1.61, closer to the mean-field approximation (⫹␥⫽1.5) than to the 3D Heisenberg prediction (⫹␥⫽1.75).45 The
proce-dure also allows us to determine precisely the critical tem-perature TCof each sample by extrapolating the results down to Hi⫽0. The results, summarized in Table I, show a very good agreement between the ‘‘theoretical’’ magnetic TC and the corresponding TM I values deduced from the electrical transport measurements shown above共Fig. 2兲.
Similarly, scaling arguments23 show that the amplitude of
the peak susceptibility m should follow a power law rela-tionship as a function of the reduced internal field h
m⬃h(1/␦)⫺1,
so written using the Widom equality23 ␥⫽(␦⫺1). The ␦
values obtained by fitting the peak amplitude 共corrected for demagnetizing effects兲 as a power law function of the inter-nal field are listed in Table I. Notice that the ␦ exponent is determined without any other assumption on,␥, or TC. As can be seen, the ␦ values for the three samples 共ranging between 2.42 and 2.67兲 are not consistent with the 3D Heisenberg (␦⫽4.803) predictions46 but are rather close to
the mean-field value (␦⫽3). In the particular case of the DG sample exhibiting the kink structure, the fitting procedure was also carried out using the (T*,
⬘
*) points resulting from the intersection of lines extrapolated from outside the temperature window containing the peak and the kink, as shown by the solid lines in Fig. 4共b兲. However, such a pro-cedure does not significantly modify the results; it leads to ␦⫽2.52, a value close to ␦⫽2.54 obtained by locating the true maximum of the experimental data without any curve fitting.The discrepancy between the experimental data and the theoretical predictions can be discussed as follows. Some authors35have shown that the paramagnetic to ferromagnetic
transition in the case of the La1⫺xCaxMnO3 system might be either first order (x⬃0.3) or second order (x⬃0.2). Since the actual transition temperature of the presently investigated material is close to that of La1⫺xCaxMnO3 with x⬃0.25,
some ambiguity can be expected. It has sometimes been sug-gested that the nature of the magnetic transition in La0.67Ca0.33MnO3differs from that of other CMR materials41
and that a description of this compound could be made in terms of percolation theory for phase-separated clusters.47In
the case of the present samples, it clearly appears that the microstructure has little effect on the critical exponents which are found to be close to mean-field values. We con-sider that this feature is related to the Mn deficiency in the actual material stoichiometry: the unoccupied Mn sites un-doubtedly lead to an increase of the relative impact of long distance interactions in the compound. This, in turn, suggests a decreasing correlation range of the fluctuations, which means that the mean-field approximation might be appropri-ate for describing the magnetic fluctuations occurring in the samples.48
B. Origin of the kink„DG sample…
In order to investigate the reason for the peculiar behavior of the DG sample, careful resistivity measurements were car-ried out in the vicinity of the temperature and magnetic field FIG. 5. Comparison of the in-phase ac susceptibility peak
tem-perature vs internal magnetic field measured for the applied mag-netic field applied either parallel共white symbols兲 or perpendicular 共black symbols兲 to the long axis of the double grain 共DG兲 sample. Both sets of data are fitted by the same law共black line兲.
TABLE I. Comparison of resistive transition temperature TM I, critical temperature TC and critical exponent (⫹␥) and␦values determined for the three samples. For ‘‘DG共extrapolation兲,’’ see the procedure described in the text.
Sample TM I共K兲 TC 共K兲 ⫹␥ ␦ SG 190.2 190.0 1.61 2.42 DG 188.5 189.2 1.49 2.54 DG 共extrapolation兲 190.5 2.52 PG 192.5 192.3 1.39 2.67
line shown in Fig. 5, but no noticeable singularity could be detected. In addition, the results displayed in Fig. 5 show that the sample geometry does not affect the material behavior, since data points measured with a magnetic field parallel (D⫽0.22) or perpendicular (D⫽0.42) to the long axis of the sample follow one unique line. We also emphasize that all peak amplitudes plotted in Fig. 4 lie well below the de-magnetization limit (1/D). Therefore it can be concluded that the D factor—despite its rather high value—is not a relevant parameter for the analysis of the phenomenon.
In the literature, the only occurrence of a double bump structure for
⬘
was reported for some dilute magnetic sys-tems such as PdMn alloys.31 As the Mn concentrationin-creases from 3% to 5%, a secondary peak appears at some temperature below the main peak characterizing the critical fluctuations. Both peak amplitudes were shown to decrease rapidly with increasing dc magnetic field, but, unlike the behavior depicted in Fig. 4共b兲, the low-T peak was shown to be shifted towards lower temperatures as the field increases.31Such a behavior is similar to what is observed in
spin glasses, but this is obviously not the behavior observed here.
Based on these considerations, we propose that the kink structure in the DG sample can be attributed to a slight dif-ference, i.e.,⬃3 K, between the critical temperatures of the two constitutive grains. This feature may be caused by a small difference in their respective stoichiometry, not percep-tible through the resolution of the EDX analysis. This inter-pretation is consistent with the fact that no kink could be observed, neither for the single grain nor the polycrystalline sample. In the case of the single grain sample, the stoichi-ometry is expected to be uniform, resulting in a unique criti-cal temperature as observed in Fig. 4共a兲. In the case of the polycrystalline sample, the numerous grains might still have slightly different stoichiometries—and thus slightly different TC’s—but the overall magnetic properties of the sample are averaged on a length scale which is at least one order of magnitude larger than the average grain size. The TC distri-bution is thus expected to be completely rounded off and only one well-defined large peak appears, as shown in Fig. 4共c兲.
The results obtained for the DG sample put into evidence that specific features may sometimes be observed when samples have a size comparable to the grain size itself. In that respect, ac susceptibility measurements in the presence of dc fields is a powerful tool to reveal small TC inhomoge-neities within the material and assess the sample quality. It is also worth emphasizing that, in the case of polycrystalline materials, the presence of one single peak in the ac
suscep-tibility vs temperature curve is not a strict proof of the sample homogeneity. The peak may indeed result from the superposition of several peaks very close to each other, re-flecting the TC distribution in the sample.
qV. CONCLUSIONS
We have examined the properties of three magnetoresis-tive La-Ca-Mn-O samples (La0.78Ca0.22Mn0.90O2.94)
ex-tracted from a rod grown by the floating zone method. The samples are characterized by different microstructures and contained either共i兲 one single grain, 共ii兲 two large grains, or 共iii兲 several small grains. The material chemical composition was determined to be homogeneous within the uncertainty of the EDX method. The quality of the LCMO bulk material was confirmed by both resistivity and ac susceptibility mea-surements. Superimposing a dc field on the ac driving field led to the appearance of a maximum in
⬘
, whose field and temperature dependence is consistent with the description of a second-order magnetic transition. The critical exponent values (⫹␥⬃1.5,␦⬃2.5) were found to be independent of the microstructure. These relations between critical expo-nents are close to those of the mean-field approximation. This can be understood from the actual stoichiometry of the investigated samples in which disordered unoccupied Mn sites cause a shortening of the fluctuation correlation length. In the sample containing two grains, a noticeable kink structure in the ac susceptibility was observed. This phenom-enon was interpreted as being the signature of a small differ-ence between the critical temperatures of the adjacent grains. Such results emphasize the usefulness of ac magnetic mea-surements in the presence of dc fields in order to bring out small TC variations within the sample. The kink feature was observed neither in the single grain material nor in the poly-crystalline sample. In this latter case, the properties are ex-pected to be averaged over several grains and the data dis-play only one peak, in spite of possible sample inhomogeneities. Therefore we can conclude that consider-able caution needs to be taken when studying magnetic mea-surements on nonhomogeneous samples.ACKNOWLEDGMENTS
Ph.V. and B.V. are grateful to the F.N.R.S. for financial support. We also would like to thank Professor H.W. Vander-schueren for allowing us to use the M.I.EL. laboratory facili-ties. B.V. thanks Professor Revcolevschi and Professor Ber-thet for welcoming her at the Laboratoire de Physico-Chimie de l’Etat Solide.
*Author to whom correspondence should be addressed at, Univer-sity of Lie`ge, SUPRATECS, Department of Electrical Engineer-ing and Computer Science 共Montefiore Institute兲 B28, Sart-Tilman, B-4000 Lie`ge, Belgium. Fax: ⫹32 4366 2877. Email address: [email protected]
1S. Jin, T. H. Tiefel, M. McCormack, R. A. Fastnacht, R. Ramesh, and L. H. Chen, Science 264, 413共1994兲.
2E. Dagotto, cond-mat/0302550共unpublished兲.
3T. Venkatesan, M. Rajeswari, Z. W. Dong, S. B. Ogale, and R. Ramesh, Philos. Trans. R. Soc. London, Ser. A 356, 1661 共1998兲.
4S. Sergeenkov, H. Bougrine, M. Ausloos, and A. Gilabert, Phys. Rev. B 60, 12322共1999兲.
5C. Zener, Phys. Rev. 82, 403共1951兲.
6C. N. R. Rao, A. K. Cheetham, and R. Manesh, Chem. Mater. 8, 2421共1996兲.
7C. S. Hong, W. S. Kim, E. O. Chi, K. W. Lee, and N. H. Hur, Chem. Mater. 12, 3509共2000兲.
8M. Sahana, M. S. Hegde, C. Shivakumara, V. Prasad, and S. V. Subramanyam, J. Solid State Chem. 148, 342共1999兲.
9G. J. Snyder, R. Hiskes, S. DiCarolis, M. R. Beasley, and T. H. Geballe, Phys. Rev. B 53, 14434共1996兲.
10W. Westerburg, F. Martin, S. Friedrich, M. Maier, and G. Jakob, J. Appl. Phys. 86, 2173共1999兲.
11C. Ho¨fener, J. B. Philipp, J. Klein, L. Alff, A. Marx, B. Bu¨chner, and R. Gross, Europhys. Lett. 50, 681共2000兲.
12K. Steenbeck, T. Eick, K. Kirsch, K. O’Donnel, and E. Steinbeib, Appl. Phys. Lett. 71, 968共1997兲.
13K. Steenbeck, T. Eick, K. Kirsch, H. G. Schmidt, and E. Stein-beib, Appl. Phys. Lett. 73, 2506共1998兲.
14N. D. Mathur, G. Burnell, S. P. Isaac, T. J. Jackson, B. S. Teo, J. L. MacManus-Driscoll, L. F. Cohen, J. E. Evetts, and M. G. Blamire, Nature共London兲 387, 266 共1997兲.
15J. E. Evetts, M. G. Blamire, N. D. Mathur, S. P. Isaac, B. S. Teo, L. F. Cohen, and J. L. MacManus-Driscoll, Philos. Trans. R. Soc. London, Ser. A 356, 1593共1998兲.
16A. Gupta, G. Q. Gong, G. Xiao, P. R. Duncombe, P. Lecoeur, P. Trouilloud, Y. Y. Wang, V. P. Dravid, and J. Z. Sun, Phys. Rev. B
54, R15629共1996兲.
17J. H. Zhao, X. Z. Zhou, A. Peles, S. H. Ge, H. P. Kunkel, and G. Williams, Phys. Rev. B 59, 8391共1999兲.
18B. Vertruyen, R. Cloots, A. Rulmont, G. Dhalenne, M. Ausloos, and Ph. Vanderbemden, J. Appl. Phys. 90, 5692共2001兲. 19R. B. Goldfarb, M. Lelental, and C. A. Thompson, in Magnetic
Susceptibility of Superconductors and Other Spin Systems, ed-ited by R. A. Hein et al.共Plenum, New York, 1991兲, p. 49. 20J.-L. Tholence, in Magnetic Susceptibility of Superconductors and
Other Spin Systems, edited by R. A. Hein et al.共Plenum, New York, 1991兲, p. 503.
21S. K. Hasanain, A. Baig, A. Mumtaz, and S. A. Shaheen, J. Magn. Magn. Mater. 225, 322共2001兲.
22A. E. Kar’kin, D. A. Shulyatev, A. A. Arsenov, V. A. Cherepanov, and E. A. Filonova, JETP 89, 358共1999兲.
23G. Williams, in Magnetic Susceptibility of Superconductors and Other Spin Systems, edited by R. A. Hein et al.共Plenum, New York, 1991兲, p. 475.
24E. Dagotto, T. Hotta, and A. Moreo, Phys. Rep. 344, 1共2001兲.
25A. E. Pantoja, H. J. Trodhal, R. G. Buckley, Y. Tomioka, and Y. Tokura, J. Phys.: Condens. Matter 13, 3741共2001兲.
26N. Mathur and P. Littlewood, Phys. Today 56共1兲, 25 共2003兲. 27J. C. Loudon, N. D. Mathur, and P. A. Midgley, Nature共London兲
420, 797共2002兲.
28P. A. Joy and S. K. Date, J. Magn. Magn. Mater. 220, 106共2000兲. 29F. M. Araujo-Moreira, M. Rajeswari, A. Goyal, K. Ghosh, V. Smolyaninova, T. Venkatesan, C. J. Lobb, and R. L. Greene, Appl. Phys. Lett. 73, 3456共1998兲.
30I. Maartense and G. Williams, Phys. Rev. B 17, 377共1978兲. 31S. C. Ho, I. Maartense, and G. Williams, J. Phys. F: Met. Phys.
11, 1107共1981兲.
32P. Gaunt, S. C. Ho, G. Williams, and R. W. Cochrane, Phys. Rev. B 23, 251共1981兲.
33A. Peles, H. P. Kunkel, X. Z. Zhou, and G. Williams, J. Phys.: Condens. Matter 11, 8111共1999兲.
34J. H. Zhao, H. P. Kunkel, X. Z. Zhou, and G. Williams, J. Phys.: Condens. Matter 13, 5785共2001兲.
35J. H. Zhao, T. Song, H. P. Kunkel, X. Z. Zhou, R. M. Roshko, and G. Williams, J. Phys.: Condens. Matter 12, 6903共2000兲. 36X. Z. Zhou, H. P. Kunkel, J. H. Zhao, P. A. Stampe, and G.
Williams, Phys. Rev. B 56, R12714共1997兲.
37J. H. Zhao, H. P. Kunkel, X. Z. Zhou, and G. Williams, Phys. Rev. B 66, 184428共2002兲.
38D. Shulyatev, S. Karabashev, A. Arsenov, and Y. Mukovskii, J. Cryst. Growth 198Õ199, 511 共1999兲.
39Ph. Vanderbemden, Cryogenics 38, 839共1998兲.
40T. Okuda, Y. Tomioka, A. Asamitsu, and Y. Tokura, Phys. Rev. B
61, 8009共2000兲.
41H. S. Shin, J. E. Lee, Y. S. Nam, H. L. Ju, and C. W. Park, Solid State Commun. 118, 377共2001兲.
42J. M. D. Coey, M. Viret, and S. von Molnar, Adv. Phys. 48, 167 共1999兲.
43S. Chikazumi, Physics of Ferromagnetism共Clarendon, Oxford, 1997兲.
44D. X. Chen, J. A. Brug, and R. B. Goldfarb, IEEE Trans. Magn.
27, 3601共1991兲.
45M. E. Fisher, Rev. Mod. Phys. 46, 597共1974兲.
46C. S. Hong, W. S. Kim, and N. H. Hur, Phys. Rev. B 63, 092504 共2001兲.
47M. Ziese, J. Phys.: Condens. Matter 13, 2919共2001兲.