Publisher’s version / Version de l'éditeur:
ASHRAE Transactions, 107, 1, pp. 720-729, 2001-08-01
READ THESE TERMS AND CONDITIONS CAREFULLY BEFORE USING THIS WEBSITE.
https://nrc-publications.canada.ca/eng/copyright
Vous avez des questions? Nous pouvons vous aider. Pour communiquer directement avec un auteur, consultez la première page de la revue dans laquelle son article a été publié afin de trouver ses coordonnées. Si vous n’arrivez pas à les repérer, communiquez avec nous à [email protected].
Questions? Contact the NRC Publications Archive team at
[email protected]. If you wish to email the authors directly, please see the first page of the publication for their contact information.
NRC Publications Archive
Archives des publications du CNRC
This publication could be one of several versions: author’s original, accepted manuscript or the publisher’s version. / La version de cette publication peut être l’une des suivantes : la version prépublication de l’auteur, la version acceptée du manuscrit ou la version de l’éditeur.
Access and use of this website and the material on it are subject to the Terms and Conditions set forth at
The Smoke hazard from a fire in high spaces
Lougheed, G. D.; Hadjisophocleous, G. V.
https://publications-cnrc.canada.ca/fra/droits
L’accès à ce site Web et l’utilisation de son contenu sont assujettis aux conditions présentées dans le site LISEZ CES CONDITIONS ATTENTIVEMENT AVANT D’UTILISER CE SITE WEB.
NRC Publications Record / Notice d'Archives des publications de CNRC:
https://nrc-publications.canada.ca/eng/view/object/?id=23d187c8-b999-41ae-ae01-7ea5aa5128d4 https://publications-cnrc.canada.ca/fra/voir/objet/?id=23d187c8-b999-41ae-ae01-7ea5aa5128d4The Smoke hazard from a fire in high spaces
Lougheed, G.D.; Hadjisophocleous, G.V.
A version of this document is published in / Une version de ce document se trouve dans : ASHRAE Transactions, v. 107, pt. 1, 2001, pp. 720-729
www.nrc.ca/irc/ircpubs
The following paper was published in ASHRAE Transactions, Vol.
107, Pt. 1.
2001 American Society of Heating, Refrigerating
and Air-Conditioning Engineers, Inc.
This posting is by permission of ASHRAE and is presented for
educational purposes only.
ASHRAE does not endorse or recommend commercial products or
services. This paper may not be copied and/or distributed
electronically or in paper form without permission of ASHRAE.
Contact ASHRAE at
www.ashrae.org.
720 ASHRAE Transactions: Symposia
ABSTRACT
In a recently completed research project sponsored by ASHRAE (899-RP), the National Research Council of Canada used full-scale physical model studies combined with CFD modeling to investigate the effectiveness of mechanical smoke exhaust systems used for atrium smoke management. The previous publications resulting from this research focused on the impact of plugholing on the effectiveness of a smoke management system. In this paper, the research results are used to investigate the impact on smoke venting of the ceiling jet formed when the plume impinges on the ceiling. Also, alge-braic equations and a computational fluid dynamic (CFD) model were used to estimate smoke properties in the smoke layer. The numerical results are compared with the experimen-tal results.
INTRODUCTION
In a recently completed research project sponsored by ASHRAE (899-RP), the National Research Council of Canada (NRC) used full-scale physical model studies combined with CFD modeling to investigate the effectiveness of mechanical smoke exhaust systems used for atrium smoke management (Lougheed and Hadjisophocleous 1997; Hadjisophocleous et al. 1999; Lougheed et al. 1999). This research addressed concerns raised by designers and research-ers regarding the possibility of fresh air being pulled into the exhaust inlet for smoke management systems in which the headroom for accumulation of smoke above the highest egress route is minimal. This plugholing of the exhaust inlet by the fresh air from below the smoke layer can decrease the effi-ciency of the smoke exhaust system and can result in an
increased smoke layer depth, which may expose building occupants to smoke.
In addition to the plugholing phenomena, NFPA 92B (1995) also recommends that the smoke layer depth below the exhaust inlets must be deep enough to accommodate the ceil-ing jet, which is produced when the buoyant plume produced by a fire comes into contact with the ceiling of a compartment. The ceiling jet is the flow of smoke under the ceiling extending radially from the point of fire plume impingement on the ceil-ing. Normally, the temperature of the ceiling jet is greater than the adjacent smoke layer.
There has been considerable research on the ceiling jet. However, most of this research has focused on problems related to detector activation (Beyler 1986). Very little research has been conducted to investigate the impact of the ceiling jet on smoke venting using mechanical systems. However, design guides recommend that an atrium smoke exhaust system be designed assuming a minimum smoke layer depth of at least one-tenth the floor-to-ceiling height (Klote 2000).
In this paper, the results from the research project on plugholing are used to investigate the ceiling jet phenomenon. Also, the impacts of the ceiling jet and plugholing on the effec-tiveness of a mechanical smoke exhaust system are compared. For some smoke management applications in high atria, in which the ceiling jet and plugholing phenomena can have an impact, the smoke accumulating at the top of the atrium will be appreciably diluted by entrained air, decreasing the hazard posed by the smoke. There are algebraic equations available (NFPA 1995) for use in estimating the smoke properties, both during the smoke filling phase and with venting. Milke (2000) has discussed the smoke hazard during early development of
The Smoke Hazard from a
Fire in High Spaces
Gary D. Lougheed, Ph.D.
George V. Hadjisophocleous, Ph.D., P.Eng.
Member ASHRAE Member ASHRAE
Gary D. Lougheed and George V. Hadjisophocleous are senior research officers in the Fire Risk Management Program, Institute for Research in Construction, National Research Council Canada, Ottawa, Ontario.
ASHRAE Transactions: Symposia 721
the fire. The algebraic equations and a computational fluid dynamic (CFD) model were used to determine the properties of the smoke in the smoke layer during venting. In this paper, the numerical and experimental results are compared.
PHYSICAL MODELS Test Facility
Two experimental test facilities were used during the project on plugholing. For the larger of the two facilities, the ductwork for the mechanical exhaust system was suspended below the ceiling of the large-scale test facility (Lougheed et
al. 1999). The exhaust inlets were approximately 1.4 m below the ceiling height. As such, the results from the tests using this facility do not provide any information on the effect of the ceil-ing jet. Also, the instrumentation used in this facility was limited to thermocouples used to determine temperature profiles.
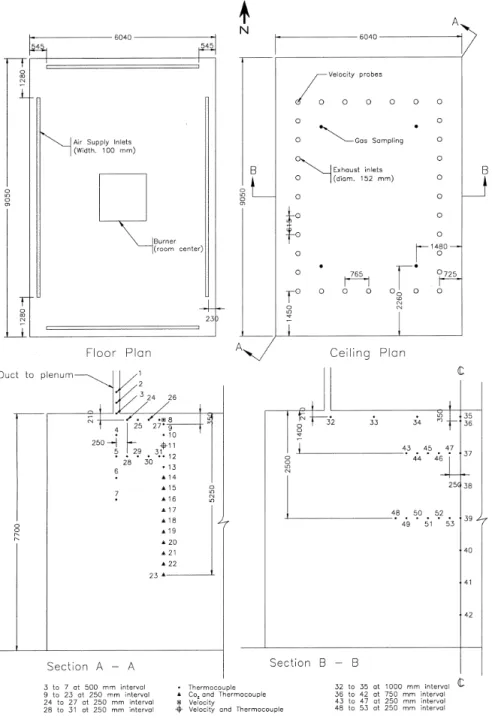
In the small-scale test facility, a plenum system was mounted above a large room and 32 exhaust inlets were extended through the ceiling into the test compartment (Figure 1). The facility was 9 m × 6 m × 5.5 m with a door on the west wall near the southwest corner and a door on the east wall near the northeast corner. The interior wall surface of the
722 ASHRAE Transactions: Symposia
compartment was insulated using 25 mm thick rock fiber insulation. The insulation was used for two reasons: first, to protect the walls of the facility so that high gas temperatures could be attained during the tests and, second, to provide a better boundary condition for the CFD runs. A detailed description of the test facility is provided in Lougheed and Hadjisophocleous (1997).
A fan was used to supply fresh air into the compartment through openings in the floor around the walls as shown in Figure 1. The openings were designed to maintain the velocity of the incoming air to less than 1 m/s for the maximum air flow expected, which was between 2 and 4 m3/s.
Thirty-two exhaust inlets with a diameter of 150 mm were located in the ceiling of the compartment, as shown in Figure 1. These inlets were used to extract the hot gases from the compartment during the tests. All exhaust ducts were connected through a central plenum and ductwork to an exhaust fan.
Instrumentation
The test facility was instrumented with thermocouples and pitot tubes for velocity measurements. Also, gas inlets were located in the room for extracting gas samples to deter-mine CO2 concentrations at various locations. The location of
the instrumentation is shown in Figure 1. A detailed descrip-tion of the instrumentadescrip-tion is provided in Lougheed and Hadjisophocleous (1997).
Test Procedure and Parameters
Tests using the small-scale test facility were conducted over an extended period of time, using a propane burner fire located at the center of the test facility. During the test period, the propane burner was used to provide a series of steady-state fire conditions. Each fire size was maintained for several minutes allowing the conditions (temperature and CO2 concentrations) in the test room to come to equilibrium. The exhaust system was operated throughout the test.
The main parameters, which were varied in the tests, were as follows:
1. Heat release rate. Tests were conducted with the following
heat release rates: 15, 25, 50, 150, 250, 300, 400, 500, 600, and 800 kW.
2. Number of exhaust inlets. Tests were conducted with 1, 4,
16, and 32 exhaust inlets with the exhaust inlets 150 mm in diameter. In addition, tests were conducted with 32 exhaust inlets with a 75 mm diameter.
3. Exhaust inlet height. Tests were conducted with the exhaust
inlets at heights of 5.5 m (150 mm below the ceiling), 4.5 m, and 3.5 m.
4. Exhaust inlet orientation. Most tests were conducted with
the centerline of the exhaust inlet oriented vertically. For comparison, a limited number of tests were conducted with the centerline of the exhaust inlets oriented horizontally.
5. Fan speed. Tests were conducted with two fan speeds for
tests with 32 exhaust inlets. Only the low fan speed was used for tests with 1, 4, and 16 exhaust inlets.
In order to extend the range of test parameters that could be investigated, extensions were added to the exhaust inlets for some tests. The results of the tests with extensions provided a test arrangement that minimized the impact of the ceiling jet. For these tests, plugholing was the dominant factor, which had an impact on the effectiveness of the mechanical exhaust system.
A series of tests was also conducted with the exhaust inlets located at ceiling height. The results of these tests are used in this paper to investigate the impact of both the ceiling jet and plugholing on smoke venting.
NUMERICAL MODELING Description of CFD Model
The numerical simulations for this project were done using a general three-dimensional computational fluid dynamics model with capabilities in handling laminar and turbulent flows, incompressible and compressible media, multi-component fluids, porous media, Lagrangian particle tracking, reacting combusting flows, conjugate heat transfer, surface-to-surface radiation, rotating frames of reference, and subsonic, transonic, and supersonic flows (ASC 1994). The grid generation features of the model include the ability to handle nonorthogonal boundary-fitted grids, grid embedding, and grid attaching.
Turbulence was modeled using the k-ε turbulence model, which is the model used for most engineering applications and found in most commercial codes.
Radiation exchange between the hot gases and the surroundings was modeled using the model’s diffusion radia-tion model (ASC 1994) with a gas absorpradia-tion coefficient of 0.1.
Fire Modeling
The fire was modeled using two methods: a flamelet combustion model (Peters 1984, 1986) and a heat source. In the flamelet model, only two user-defined scalar equations are used: one is the mixture fraction and the other is the variance of the mixture fraction. In this simulation, propane was used as fuel and the following 12 chemical species were used: C3H8, O2, H, O, H2, H2O, CO, CO2, CH3, CH4, C2H2, and
C2H4. When using the heat source method, the fire heat release
rate was defined as a volumetric heat source in control volumes at the fire location.
Computational Grid
Results from the tests in the small-scale facility and preliminary numerical simulations indicated that conditions in the room were symmetric, so the room was modeled by considering only one quarter of the room. Two different
ASHRAE Transactions: Symposia 723
computational grids were employed. When the flamelet model was used, the computational domain was divided into a grid of 21× 31 × 21 control volumes. Additional grid points were embedded around the fire and the exhaust inlets to enable better resolution of the solution in these areas. The total number of grid points for these simulations was 24,014. When the volumetric heat source was used for the fire, the compu-tational domain was divided into a grid of 23× 17 × 24 control volumes. The total number of grid points for these simulations was 9384.
Boundary Conditions and Fluid Properties
The following boundary conditions were used:
• Solid walls. The walls of the enclosure were modeled as
solid, adiabatic, and hydrodynamically smooth bound-aries. This type of boundary is appropriate as the walls of the enclosure were insulated and had a smooth sur-face.
• Ceiling vents. At the ceiling vents, a constant mass flow
rate was assigned based on the experimental data obtained at the quasi-steady state.
• Floor openings. At the floor openings, the total pressure
was set to 101,325 Pa across the area of the openings. The inlet velocities were free to develop corresponding to the mass flow rate downstream. Inlet air temperature was assumed to be 291 K. Although in the experiments a fan was used to supply fresh air to the room through these openings, the supply air had a very low velocity, and the governing parameter was the flow rate of the exhaust fan, so the assumed boundary condition is acceptable.
Radiative and Convective Heat Transfer
Simulations were conducted with radiative and convec-tive heat transfer to the walls and ceiling. In these simulations, conduction through the wall materials was also considered.
Simulations were also conducted without running the radiation model. For these simulations, it was assumed that 30% of the heat released by the fire was lost to the boundaries of the test facility. Similar results were obtained using the two types of simulations. However, there were considerable savings in computational time using the latter approach.
IMPACT OF CEILING JET AND PLUGHOLING ON SMOKE VENTING
It is generally assumed that two phenomena have an impact on smoke venting for atria in which there is minimum headroom between the design height and the exhaust inlets. These are the ceiling jet and plugholing. In this section, the two phenomena are described, and the results obtained with the small-scale physical model are used to investigate their impact.
Plugholing
The objective of a smoke management system, using a mechanical exhaust system, is to maintain the smoke layer above a design height, which is above the highest egress route or opening to a communicating space. However, the plughol-ing of the exhaust inlet by fresh air from below the smoke layer can decrease the efficiency of the smoke exhaust system and result in an increased smoke layer depth, which may expose building occupants to smoke (Figure 2).
In the recently completed research project sponsored by ASHRAE, full-scale physical model studies were used, combined with CFD modeling, to investigate the plugholing issue (Lougheed and Hadjisophocleous 1997; Hadjisophocle-ous et al. 1999; Lougheed et al. 1999). This research indicated that, in order to minimize the impact of plugholing, multiple exhaust inlets should be used for the mechanical smoke exhaust system. This is demonstrated in Figures 3-5, which show the temperature profiles in the test facility for tests with heat release rates of 15, 25, and 50 kW, respectively. The numbers of inlet openings were 1, 4, 16, and 32.
The temperature profiles were determined with steady fire and smoke exhaust conditions. These profiles show the location of the hot upper layer in the test facility. In previous publications (Lougheed and Hadjisophocleous 1997; Hadjiso-phocleous et al. 1999; Lougheed et al. 1999), a method was developed for estimating the height of the base of the smoke layer and the base of the transition zone. Specifically, these
724 ASHRAE Transactions: Symposia
boundaries were assumed to be the heights at which the temperature rise was 80% and 20%, respectively.
The temperature profiles shown in Figures 3-5 clearly show that by using 16 or 32 exhaust inlets, a much thinner smoke layer can be obtained.
With the small test facility, there was a variation in the volumetric flow rate produced by the exhaust system due to restrictions in the duct system with one and four inlets. However, the impact of the number of openings on the smoke depth was also observed in the tests with the large-scale facil-ity, in which the number of openings did not affect the volu-metric flow rate in the exhaust system (Lougheed et al. 1999).
Design Criteria
Limiting the mass flow rate through the exhaust inlets can reduce the impact of plugholing. One approach for determin-ing the maximum flow rate through an exhaust inlet is one used in the United Kingdom to minimize plugholing in gravity venting systems (CIBSE 1995). Using mass flow rate, the design criteria is given by
(1) where
mmax = maximum mass flow rate of exhaust without plugholing, kg/s;
Ts = absolute temperature of the smoke layer, K;
To = absolute ambient temperature, K;
d = depth of the smoke layer below the exhaust inlet, m; β = exhaust location factor (dimensionless);
C = 3.13 (constant).
Based on limited information, suggested values for β are 2.0 for a ceiling exhaust inlet located near a wall, 2.0 for a wall exhaust inlet located near the ceiling, and 2.8 for a ceiling exhaust inlet far from any walls.
This equation may not be practical for high spaces with high exhaust flow rates. For these cases, the smoke is highly diluted by the entrainment of air into the plume, resulting in low temperature rises. Other criteria based on life hazard assessments may be more suitable.
Impact of Ceiling Jet
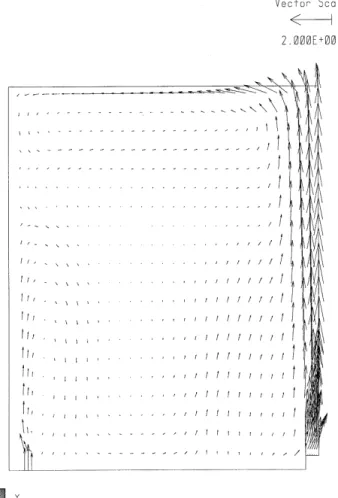
The general flow conditions produced by the ceiling jet are shown in the CFD simulation shown in Figure 6. Once the plume hits the ceiling, the smoke flows under the ceiling until it hits the walls where it is initially redirected downward. Subsequently, there is a recirculation flow back toward the center of the test facility.
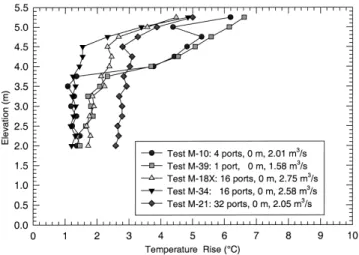
The results shown in Figures 3-5 indicate that there was a significant reduction in the smoke layer depth by increasing the number of exhaust inlets to 16. However, a further increase to 32 had little or no impact even for tests with high exhaust flow rates. In this operating regime, it can be assumed that the Figure 3 Temperature profiles for tests at 15 kW.
Figure 4 Temperature profiles for tests at 25 kW.
Figure 5 Temperature profiles for tests at 50 kW.
ãã ~ñ ` βÇR⁄ O qëÓqç që --- N⁄ O qç që --- N⁄ O Z
ASHRAE Transactions: Symposia 725
ceiling jet rather than plugholing was the predominant factor determining the minimum attainable smoke layer depth.
In Figure 7, the temperature profiles for a series of tests with 16 exhaust inlets are shown with heat release rates of 15, 25, and 50 kW. Using the 80% temperature rise criteria to determine the bottom of the smoke layer, the test results indi-cate that the minimum smoke layer depth was approximately 0.5 m. This includes the tests with very low heat release rates producing temperature rises of <4ºC. The smoke layer depth was approximately 10% of the height of the test facility.
NFPA 92B (1995) recommends that the smoke layer depth below the exhaust inlets must be deep enough to accom-modate the ceiling jet. To achieve this, it is recommended that the smoke exhaust systems be designed assuming a minimum smoke layer depth of at least one-tenth the floor-to-ceiling height (Klote 2000). This is consistent with experimental results with the physical model.
The smoke profiles shown in Figure 7 also indicate that the transition zone was >1 m in some cases. This was relatively thick compared to tests with higher heat release rates, which produced fully developed smoke layers. In the latter tests, the transition zone depth was 0.5 m or less (Lougheed and Hadjisophocleous 1997).
The reason for the increase in the depth of the transition zone can be seen in the flow profile from the CFD simulation shown in Figure 6. At the walls, the ceiling jet flow is redi-rected downward and subsequently back into the test facility. The base of this recirculation flow is approximately 1.5 m below the ceiling, resulting in a transition zone depth of approximately 1 m and a ceiling jet depth of 0.5 m.
Discussion
For atria that have minimum space between the ceiling height and the design height (highest egress route or opening to communicating space) for a smoke management system, the ceiling jet and the plugholing phenomena can impact on the effectiveness of the mechanical smoke venting system.
Using multiple inlets to reduce the mass flow rate through the inlets can minimize the entrainment of cold air from below the smoke layer into the exhaust inlet with the smoke (plugh-oling). Design criteria for use in determining the smoke layer depth required below the exhaust inlet height and for the spac-ing between the exhaust inlets have been developed (Klote 2000).
By using multiple exhaust inlets, the impact of the plug-holing phenomenon on the effectiveness of the mechanical smoke exhaust system can be minimized, reducing the depth of the smoke layer below the inlets. However, for ceiling mounted inlets, the ceiling jet formed by the impingement of the fire plume on the ceiling also has an impact on smoke vent-ing. The data from tests with the small-scale test facility indi-cate that the minimum smoke layer depth was 0.5 m. The transition zone extended a further 1 m or more below the ceil-ing. These results are consistent with the assumption that the minimum smoke layer depth that can be achieved using
Figure 6 Velocity vectors through fire plume for medium-scale simulation (m/s).
726 ASHRAE Transactions: Symposia
mechanical smoke venting is approximately 10% of the height of the atrium. This smoke depth is required to accommodate the ceiling jet (Klote 2000).
SMOKE PRODUCTION AND PROPERTIES
Smoke can adversely affect occupants during building evacuation. The potential smoke hazards include elevated temperatures, exposure to toxic gases, and a reduction in visi-bility. Various methods are available for determining the smoke production rate, interface height, concentration of gas species in the smoke, temperature in the smoke layer, and the smoke optical density (reduction in visibility). These methods include the algebraic equations provided in NFPA 92B (1995), zone models, and CFD models.
For high atria, much of the smoke production is the result of air entrainment into the plume. As a result, if the smoke layer is maintained near the top of the tall space using smoke venting, the smoke that accumulates in the smoke layer will be appreciably diluted, decreasing the potential hazard posed to building occupants.
The ceiling jet and plugholing phenomena can result in a decrease in the height of the smoke layer, potentially exposing building occupants to smoke. However, for high atria, the question is whether or not the smoke entering the occupied areas results in hazardous conditions.
In this section, the results obtained using the algebraic equations and a CFD model are compared to the measured results from the small-scale physical model.
Smoke Production
The smoke production for fires in atria includes the smoke produced within the flaming region and the air entrained into the plume. The mass flow rate of smoke into the smoke layer can be estimated using the following equation:
(2) where
Qc = convective heat release rate, kW; = mass flow rate at height z, kg/s;
z = clear height above the top of the fuel, m;
C1 = 0.071;
C2 = 0.0018.
For high clear heights, the air entrained into the plume dominates smoke production. The entrained air dilutes the smoke, decreasing the potential hazard.
Smoke Layer Height
For a given design fire, the height of the smoke layer can be estimated using Equation 1 by assuming a mass balance between the mass flow rate in the plume and the mass flow rate in the exhaust system. This approach determines the height of the interface between the transition zone and the smoke layer (NFPA 1995).
In a previous paper, interface heights determined using the CFD model were compared with experimental results (Hadjisophocleous et al. 1999). In general, the CFD model seems to overpredict the interface height for lower heat release rates and underpredict it for higher ones.
The above comment regarding the smoke layer height also holds for estimates of the smoke layer height using Equa-tion 1. For tests with low heat release rates, the ceiling jet and plugholing phenomena affect the efficiency of the smoke exhaust system. As a result, the smoke layer interface can be lower than would be predicted by a simple mass balance between the smoke production rate and the mass flow rate in the exhaust system.
Smoke Layer Temperature
An estimate of the average plume temperature at the inter-face height under steady-state conditions can be determined using the first law of thermodynamics (Klote 1994). In this case, the mass flow rate into the smoke layer is equal to the mass flow rate in the exhaust system. Such analysis leads to the following equation for the temperature in the smoke layer: (3) where
Ts = average plume temperature at elevation z, °C;
Ta = ambient temperature, °C;
Qc = convective heat release rate, kW;
ρo = density of ambient air, kg/m3;
V = volumetric flow rate in the exhaust system, m3/s;
Cp = specific heat of plume gases, kJ/kg°C.
In earlier publications (Lougheed and Hadjisophocleous 1997; Lougheed et al. 1999), it was shown that the temperature increase in the smoke layer in the physical model tests was consistent with the temperatures estimated using the adiabatic equation. The results for the small-scale test are shown in Figure 8.
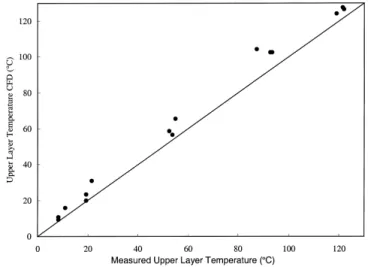
The CFD model was also used to estimate the temperature in the smoke layer (Hadjisophocleous et al. 1999). A compar-ison of the measured and calculated smoke temperature is shown in Figure 9. The CFD model results tended to be higher than the measured results. However, overall there was good comparison over a wide range of heat release rates.
CO2 Concentrations
The concentrations of gas species in the smoke layer produced by a fire in an atrium can be estimated using an alge-braic equation provided in NFPA 92B (1995). The equation is as follows:
Yi = fiQ / (Xαρo∆HcV) (4)
where
Yi = mass fraction of species i, kg of species i/kg of
smoke; ã· `NnÅN⁄ PòR⁄ P ` On Å H Z ã· që q~ nÅ ρç`és ---H Z
ASHRAE Transactions: Symposia 727
fi = yield factor of species i, kg of species i/kg of fuel;
Q = total heat release rate, kW;
V = volumetric flow rate in the exhaust system, m3/s; ρo = density of ambient air, kg/m3;
Xα = combustion efficiency factor, maximum value of 1; ∆Hc = heat of complete combustion, kJ/kg.
For a propane burner fire, the only combustion species of significance is CO2. In Figure 10, the CO2 concentrations
esti-mated using Equation 4 are compared with the measured concentrations. The estimated CO2 concentrations are higher than but comparable to the concentrations measured in the smoke layer, resulting in conservative estimates.
For the test conditions that produced the low CO2 concen-trations, the estimated and measured concentrations differed by as much as 70%. These differences were in part due to the impact of the ceiling jet and the plugholing phenomena, which decreased the height of the smoke layer. As a result, there was less dilution of the smoke by the entrained air, resulting in higher measured CO2 levels than those estimated using Equa-tion 3. However, these variaEqua-tions were for the low heat release fires used as a physical model for high atria (using Froude modeling, the tests in the small-scale facility represented a scaling of up to 10:1 for a 5 MW fire [Lougheed and Hadjiso-phocleous 1997]). For these cases, the amount of CO2 was
very small (< 0.1%). In absolute terms, the differences between the calculated and measured concentrations are negligible. For the very low concentrations, results are compa-rable to the concentration of CO2 in ambient air and they are
within the measurement accuracy of the analyzer.
The average CO2 concentrations in the smoke layer were
also estimated using the CFD model. A comparison between the measured and calculated results is shown in Figure 11. The results are comparable over a wide range of conditions.
Although the comparisons between measured and calcu-lated gas species concentrations were limited to CO2, it is
expected that the approach would work for other combustion Figure 8 Scatter plot of experimental temperature increase
with adiabatic temperature rise in smoke layer.
Figure 9 Scatter plot of experimental and CFD temperature rises in smoke layer.
Figure 10 Scatter plot of experimental and calculated CO2
concentrations.
Figure 11 Scatter plot of experimental and CFD CO2 concentrations in smoke layer.
728 ASHRAE Transactions: Symposia
gases, such as CO. The results indicate that the concentrations of gas species in the smoke layer can be estimated using the algebraic equations and using a CFD model.
Smoke Obscuration
NFPA 92B provides an algebraic equation for estimating the smoke optical density in the smoke layer:
D = DmQ / (Xα∆HcV) (5)
where
D = smoke optical density, OD/m;
Dm = mass optical density, m2/kg;
Q = total heat release rate, kW;
V = volumetric flow rate in the exhaust system, m3/s;
Xα = combustion efficiency factor, maximum value of 1; ∆Hc = heat of complete combustion, kJ/kg.
Since the propane fires used in the test arrangement produced minimal smoke, the smoke optical density was not measured. As such, it is not possible to make comparisons between measured and calculated results. However, since the first smoke layer property that reaches a critical level is a reduction in visibility (Milke 2000), estimates of smoke opti-cal densities are provided in this section for illustrative purposes.
The mass optical density is dependent on the fuel, the burning mode, and the ventilation conditions. It can vary by orders of magnitude depending on the fuel and the ventilation conditions (Milke 2000; Tewarson 1995).
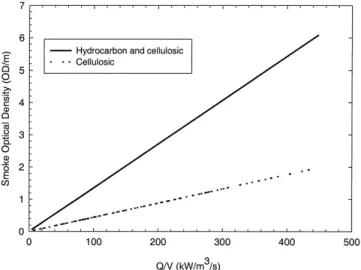
The smoke optical densities for the heat release rates and volumetric flow rates used in the physical tests are shown in Figure 12. Two fuel packages were used: the mixture of hydro-carbon and cellulosic material used in the example provided in NFPA 92B, Appendix F (1995), and a cellulosic fuel (pine).
In Figure 12, the smoke optical densities are plotted versus the ratio of the heat release rate and volumetric flow rate (Q/V). Low values of Q/V are typical of situations for high atria with the smoke layer maintained high in the atrium. In this case, the smoke will be diluted by air entrained in the plume, resulting in low smoke optical densities (<0.1 OD/m). There are numerous proposed limits of smoke optical density (visibility ranges) for evacuation purposes. Tamura (1994) summarized these limits, and, depending on the assumptions used, they range from 0.043 OD/m to 0.3 OD/m (visibility of 3-25 m). This suggests that for high atria in which a large exhaust capacity is required to maintain the smoke layer above the design height, the potential hazard posed by the smoke could also be considered. However, for such an analysis, the choice of an acceptable fuel package and a crite-rion for evaluating the performance of the smoke management system are critical.
CONCLUSIONS
In a recently completed research project sponsored by ASHRAE (899-RP), NRC used full-scale physical model
studies combined with CFD modeling to investigate the effec-tiveness of mechanical smoke exhaust systems used for atrium smoke management (Lougheed and Hadjisophocleous 1997; Hadjisophocleous et al. 1999; Lougheed et al. 1999). Based on this research, design criteria were developed to minimize the impact of plugholing, using multiple inlets to reduce the mass flow rate through the inlets that can minimize the entrainment of cold air into the exhaust inlet with the smoke. Design crite-ria for use in determining the smoke layer depth required below the exhaust inlet height and for the spacing between the exhaust inlets have been developed (Klote 2000).
In this paper, the impact on smoke venting of the ceiling jet formed by the impingement of the fire plume on the ceiling was investigated. The data from tests with the small-scale test facility indicate that the minimum smoke layer depth was 0.5 m. The transition zone extended a further 1 m or more below the ceiling. These results are consistent with the assumption that the minimum smoke layer depth that can be achieved using mechanical smoke venting is approximately 10% of the height of the atrium. This smoke depth is required to accom-modate the impact of the ceiling jet (Klote 2000).
For high atria, much of the smoke production is the result of air entrainment into the plume. As a result, if the smoke layer is maintained near the top of the tall space using smoke venting, the smoke that accumulates in the smoke layer will be appreciably diluted, decreasing the potential hazard posed to building occupants.
Various methods are available for assessing the smoke production rate and smoke properties in the smoke layer. These include the algebraic equations provided in NFPA 92B (1995), zone models, and CFD models. In this paper, the results obtained using the algebraic equations and a CFD model are compared to the measured results for the small-scale physical model.
The results indicate that predictions of the interface height determined using the algebraic equations and the CFD model compare well with the experimental results for most
ASHRAE Transactions: Symposia 729
cases. The exception was those cases with low heat release rate and high mechanical exhaust rates in which the ceiling jet and plugholing phenomena affected the efficiency of the exhaust system. However, even for these situations, the numerical approaches were able to provide conservative estimates for the temperature and the concentration of CO2 in the smoke layer. The smoke optical density and, thus, the reduction in the visibility range can also be estimated. No experimental data were available for comparison. However, smoke optical density estimates using two fuel packages indicate that for the low heat release fires the smoke levels could be comparable to or lower than the limits in the literature typically used for hazard assessments.
The results indicate that the potential reduction in visibil-ity produced by the smoke in the smoke layer for a vented atrium fire is likely to be more significant than the accumula-tion of toxic species. This is consistent with similar analysis for the hazard posed by the smoke accumulating in an atrium during the early development of a fire in an atrium (Milke 2000).
The algebraic equations are only strictly applicable for relatively simple atria (Milke 2000). The CFD model can be used for more complex situations. However, in using either approach for design analysis, the choice of an acceptable fuel package and a criterion for evaluating the performance of the smoke management system are critical.
REFERENCES
ASC. 1994. TASCflow user documentation, version 2.3. Waterloo, Ontario: Advanced Scientific Computing, Ltd.
Beyler, C.L. 1986. Fire plumes and ceiling jets. Fire Safety
Journal, vol. 11, pp. 53-75.
CIBSE. 1995. TM19:1995, Relationships for smoke control
calculations. London: Chartered Institution of Building
Service Engineers.
Hadjisophocleous, G.V., G.D. Lougheed, and S. Cao. 1999. Numerical study of the effectiveness of atrium smoke exhaust systems. ASHRAE Transactions 105(1): 699-715.
Klote, J.H. 1994. Method of predicting smoke movement in
atria with application to smoke management, NISTR 5516. Gaithersburg, Md.: National Institute of Standards
and Technology.
Klote, J.H. 2000. New developments in atrium smoke man-agement. ASHRAE Transactions 106(1): 620-626. Lougheed, G.D., and G.V. Hadjisophocleous. 1997.
Investi-gation of atrium smoke exhaust effectiveness. ASHRAE
Transactions 103(2): 519-533.
Lougheed, G.D, G.V. Hadjisophocleous, C. McCartney, and B.C. Taber. 1999. Large-scale physical model studies for an atrium smoke exhaust system. ASHRAE
Transac-tions 105(1): 676-698.
Milke, J. 2000. Evaluating the early development of smoke
hazard from fires in large spaces, vol. 106.
NFPA. 1995. NFPA 92B, Guide for smoke management
sys-tems in malls, atria, and large areas. Quincy, Mass.:
National Fire Protection Association.
Peters, N. 1984. Laminar diffusion flamelet models in non-premixed turbulent combustion. Progress in Energy and
Combustion Science 10(3): 319-339.
Peters, N. 1986. Laminar flamelet concepts in turbulent combustion. 21st Symposium (International) on
Com-bustion/The Combustion Institute, pp. 1231-1250.
Tamura, G.T. 1994. Smoke movement and control in high rise
buildings. Quincy, Mass.: National Fire Protection
Association.
Tewarson, A. 1995. Generation of heat and chemical com-pounds in fire. SFPE Handbook of Fire Protection
Engi-neering, 2d ed. Quincy, Mass.: National Fire Protection