Electronic copy available at: http://ssrn.com/abstract=1348272
CUSTOMER SATISFACTION AND FINANCIAL ANALYSTS EARNINGS FORECAST ERRORS.
Paul-Valentin Ngobo,* Jean-François Casta** Olivier Ramond***
________________________________________
* corresponding author : Professor of Marketing, Institut d’Administration des Entreprises, Laboratoire Orleans de Gestion (LOG), Faculté de Droit, Economie et Gestion, Rue de Blois - B.P. 6739, 45067 Orleans Cedex 2 France, Tel. : 00 332 38 41 70 28, Fax : 00 332 38 49 48 16, E-mail : [email protected]/
** Professor of Accounting & Finance, Université Paris-Dauphine, DRM-Finance, Place du Général du Lattre de Tassigny, Paris, France, Tel: 0033 144 054 482, E-mail: [email protected]
*** Assistant Professor of Accounting & Finance, Université Paris-Dauphine, DRM-Finance, Place du Maréchal de Lattre de Tassigny, Paris, France, [email protected]
Acknowledgements: A Marketing Science Institute Grant supported this research. The authors thank Chiraz BenAli and Sebastien Lorenzini for valuable research support and Edith Ginglinger, for her comments on this work. We also thank the “Marketing Strategy Meets Wall Street” conference participants at Emory University.
Electronic copy available at: http://ssrn.com/abstract=1348272 ABSTRACT
This paper examines the relevance of customer satisfaction for the financial analysts when preparing their earnings forecasts. We draw on theory in marketing to predict how customer satisfaction should be associated with earnings forecasts and forecast errors. We assembled a dataset of companies studied in the American Customer Satisfaction Index - ACSI (University of Michigan), which also appear on the Institutional Brokers Estimate System (I/B/E/S) files. We control for factors known to influence the earnings forecasts, such as firm profitability and risk, as well as potential unobservable factors using a Mixed-effects regression. We find that customer satisfaction has a negative association with the analysts’ forecast errors. More specifically, both levels and changes in ACSI are associated with higher levels of Actual Earnings per Share (EPS) and higher levels of analysts’ earnings forecasts, making the analysts’ forecasts to be closer to the business reality. The robust impact of customer satisfaction on forecast earnings and errors suggests that analysts who undervalue customer satisfaction information may deprive themselves of an important proxy of non-financial information.
“Many stock analysts aren’t convinced that the university [of Michigan]’s customer satisfaction index, in and of itself, is all that important.”
Hilsenrath (2003) in The Wall Street Journal (February 19). Researchers in marketing are currently very much interested in the link between
marketing actions and firm value (Rust et al. 2004; Srinivasan et al. 1998). The forthcoming
debate in the Journal of Marketing Research (Srinivasan and Hanssens, 2009; Mizik and
Jacobson, 2009; Kimbrough and McAlister, 2009; Garmaise, 2009) and the recent conference on
“Marketing Strategy Meets Wall Street” by the Marketing Science Institute and Emory
Marketing Institute, all, attest of the importance that the subject is gaining in marketing. One of
the areas of particular interest has been the study of the financial consequences of customer
satisfaction. A number of empirical studies have provided evidence that customer satisfaction has
significant effects on return on investment (e.g. Anderson et al. 1994, 1997), market value of
equity (e.g. Ittner and Larcker, 1998; Fornell, Mithas, Morgeson, and Krishnan, 2006), cash flows
growth and variability (e.g. Gruca and Rego, 2005), Tobin’s q (e.g. Mittal, Anderson, Sayrak, and
Tadikamalla 2005; Anderson, Fornell, Mazvancheryl, 2004), credit ratings and debt costs
(Anderson and Mansi, 2008), systematic and idiosyncratic risk (Tulip and Bharadwaj, 2009).
Recently, a debate has emerged about whether and to what extent market participants
respond to changes in customer satisfaction. As a lead indicator of future performance (Anderson
et al. 2004), market participants should recognize and reward customer satisfaction in an efficient
market (Jacobson and Mizik, 2008). In an earlier paper, Ittner and Larcker (1998), using the
ACSI data, found that the market did not respond to increases or decreases in customer
satisfaction. More recently, Fornell, Mithas, Morgeson, and Krishnan (2006) have found that
ACSI ratings relate significantly to market valuation, e.g. a 1% change in ACSI is associated with
a 4.6% change in market value. A portfolio of stocks in the top 20% of ACSI ratings (relative to
compared to 13% for the S&P 500 index. Nevertheless, these authors found that the news about
the ACSI ratings does not reliably move stock prices over the short term. In other words, the
financial market misprices the customer satisfaction information and shares of firms advantaged
in customer satisfaction generate abnormal returns. Aksoy et al (2008) report that purchasing a
portfolio of stocks consisting of firms with high levels and positive changes in customer
satisfaction will outperform the other portfolios combinations (e.g. low levels and negative
changes) along with the S&P 500. These authors found that initially the stock market undervalues
positive satisfaction information, but it adjusts in the long-term.
In contrast to these authors, Jacobson and Mizik (2008) found that except for the
Computer and Internet sectors, customer satisfaction does not provide incremental information to
accounting performance measures in explaining stock prices. O’Sullivan, Hutchinson, and
O’Connell (2009) conduct another portfolio study of the ACSI companies. They conclude that
there is no compelling evidence that the market misprices the value of customer satisfaction. In
response to Jacobson and Mizik (2008), Fornell et al (2008a) argue that Jacobson and Mizik’s
(2008) result is based on an inappropriate analysis model. Fornell et al (2008b) also suggest that
the results of O’Sullivan et al (2009) may have to do with the way they construct their portfolios.
Our study is motivated by these conflicting results about the pricing of customer
satisfaction information. While prior research has examined its influence on stock prices, it has
left one question unaddressed: how does customer satisfaction come into share prices? Indeed,
much of the evidence on the effects of customer satisfaction comes from direct analyses of its
influence on financial performance. An important channel through which customer satisfaction
efforts could translate into the stock pricing is the financial analysts’ forecasts and
recommendations (Srinivasan and Hanssens, 2009). Analysts play an important role as
macroeconomic data, business plans, and possibly non-financial information) and provide (1)
earnings forecasts, (2) share price targets, and (3) buy-sell-hold recommendations. Prior research
indicates that analysts’ earnings forecasts influence market value (Abdel-khalik and Ajinkya,
1982; Givoly and Lakonishok, 1984), that stock recommendations, which are affected by the
analysts’ earnings forecasts, influence stock price (Womack, 1996). Favorable (unfavorable)
changes in analyst recommendations are accompanied by positive (negative) announcement
returns. Yet, despite some frustration over traditional financial statements and the fact that
non-financial information can increase analysts’ forecasts accuracies (see Orens and Lybaert, 2007;
Vanstraelen, Zarzesky, and Robb, 2003), the extent to which analysts use non-financial
information has received limited attention. One type of non-financial information that researchers
in accounting (Ittner and Larcker, 1998) and marketing (Anderson et al. 2004) have studied is
customer satisfaction, an indicator of the quality of the firm-customer relationships.
In this research, we examine whether customer satisfaction information, known at the
time of the forecast by the financial analysts, influences the forecast error. As a non-financial
measure, customer satisfaction contains incremental information over accounting numbers and
hence, is likely to be important in earnings forecasts (Anderson et al 2004). Prior studies have
shown that customer satisfaction positively influences customer behaviors, which influence
various components of a company’s revenues (e.g. Bolton, 1998; Anderson et al., 1994) and
profitability (e.g. Banker et al., 2000). Therefore, it should be surprising if one does not find a
significant relationship between customer satisfaction and earnings forecasts. We address the role
of customer satisfaction information by looking at how analysts’ earnings forecasts (and errors)
relate to customer satisfaction. Prior research has shown that analysts’ earnings forecasts, which
Consequently, we argue that customer satisfaction may influence stock prices if customer
satisfaction does influence the analyst’s earnings forecasts.
By demonstrating the value of customer satisfaction data, we could get analysts to seek
out even more systematically customer metrics from marketers to explain their followed
companies’ growth. For marketers, studying the role of analysts, as an information channel, may
help better understand how marketing metrics in general and customer satisfaction data, in
particular, come into share prices. For the corporate managers, this study examines the extent to
which one specific type of non-financial information, i.e. customer satisfaction, often reported by
firms, influences analysts’ forecasts accuracies, and how this can influence their disclosure
strategy. Finally, identifying accurate forecasts is important because earnings forecasts are an
input to analysts’ stock recommendations and many financial measures (e.g. cost of capital). For
analysts, being able to produce accurate forecasts has implications for their own careers and their
employers. The next section outlines the background of our study. Then, we develop our research
model and hypotheses regarding how customer satisfaction influences forecasts errors. Further,
we give an overview of the data. Next, we present the details of the models. We provide the
findings, and discuss the research implications.
RELATED LITERATURE
In this section, we summarize prior research on financial analysts that is relevant to our
study. Our review will argue the following main point. Prior research has examined different
sources of analysts’ earnings forecast errors but we know little about the role of non-financial
information. Specifically, there is a dearth of research on the role of customer satisfaction despite
Analyst Forecast Accuracy: Prior literature suggests that analysts differ in their forecast
accuracies and that some specific factors account for these differences1. The most studied factors
are the firm specific and the forecaster characteristics. Among the firm characteristics, company
size has been the most studied. It appears that analyst forecasts are more accurate for larger firms
(Brown, 1997; Brown et al., 1987; Hope, 2003; Lang and Lundholm, 1996; Lys and Soo, 1995).
In a meta-analysis, Garcıa-Meca and Sanchez-Ballesta (2006) report an average effect of -0.145.
The arguments include the fact that large firms have more stable growth and earnings (Chung and
Kim, 1994; Hodgkinson, 2001), are more transparent (Lang and Lundholm, 1996), provide
private information (Jaggi and Jain, 1998), and have larger analyst coverage (Atiase, 1985).
Parkash, Dhaliwal, and Salataka (1995) also found that errors are larger for riskier firms.
Some of the studies have examined the impact of investments in intangible assets.
Aboody and lev (1998) examined the impact of intangible accounting in terms of capitalization
versus expensing. They found that the absolute size of analysts’ forecasts errors has a positive
association with the capitalized amount of software development costs. They argue that analysts
would prefer full expensing because all they require for the forecasting of earnings are the
changes in the level of expense. Barron, Byard, Kile, and Riedl (2002) found that analysts’
forecasts are negatively associated with a firm’s level of R&D spending. Gu and Wang (2005)
also find that analysts’ forecast errors are larger for firms with diverse and innovative
technologies. Dehning, Pfeiffer and Richardson (2006) found that investments in IT have a
positive association with the amount of dispersion and error in financial analyst forecasts as well.
Thus, it appears that firms with higher intangible assets have higher information asymmetry,
which makes it difficult for the analysts to forecast their earnings.
1 In this section, we highlight some of the most relevant studies for our paper and by no means provide an exhaustive
The largest majority of the studies have concerned the characteristics of the analysts
themselves. These include the analyst experience, the complexity of the task, the brokerage firm
size, forecasting horizon, age of the forecast, and the affiliation of the house. While some authors
have reported positive effects of firm-specific experience (Clement, 1999; Jacob, Lys, and Neale,
1999; Mikhail, Walther, and Williams, 1997), others have reported no effect of general
experience (Jacob, Lys, and Neale, 1999). Firm specific experience provides the ability to
identify more precisely the factors that drive a company’s earnings. In addition, experienced
analysts are able to use their previous forecast errors to improve their future forecasts.
Garcıa-Meca and Sanchez-Ballesta (2006), however, find that on average only firm-specific experience
has a negative effect on forecast error. Through their long experience, analysts are able to
develop a better understanding of the company’s business. The researchers have measured
portfolio complexity with the number of firms and industries followed by analysts. Clement
(1999) and Jacob et al. (1999) found that the number of companies followed reduces the analyst’s
accuracy, as larger portfolios reduce the amount of time devoted to each company. Garcıa-Meca
and Sanchez-Ballesta (2006) found that, on average, forecast error has a positive association with
the number of industries.
The size of the brokerage house reflects the resource availability. Analysts in large
brokerage houses have access to increased resources, private communications with managers,
tend to be top talents, and to have more sophisticated forecasting models than other analysts do.
Garcıa-Meca and Sanchez-Ballesta (2006) found that larger brokerage firms are more accurate
than their peers are (-0.0256, p<0.001). Another driver of the forecast error is whether the
brokerage house is affiliated. The meta-analysis of Garcıa-Meca and Sanchez-Ballesta (2006)
found a negative average association (-0.03, p<0.01) between affiliation and forecast error.
firms are. Affiliated analysts have greater resources, access to information, reputation, and that
affiliated houses can attract analysts with better forecasting ability. Almost all previous studies
suggest that the recent forecasts are more accurate than those issued earlier are (O’Brien 1988;
Brown et al. 1987; Das and Saudaragan, 1998; Jacob et al. 1999; Jaggi and Jain, 1998; Lys and
Soo, 1995). Garcıa-Meca and Sanchez-Ballesta (2006) report an average positive relationship of
0.2516 (p<0.01) between forecasting horizon and forecast error. Analysts providing forecasts
later in the period are more accurate, as they have the advantage of observing the predictions of
other analysts (Sinha, Brown, and Das, 1997). Even though, the majority of the studies have
focused on these factors, it remains that their explanatory power is low. This indicates that other
factors probably explain differences in analysts’ accuracies.
The Use of Non-financial Information by Analysts: Do analysts use non-financial
information and does it matter? A growing number of papers report that non-financial indicators
of investments in intangible assets are important predictors of revenues (Ittner and Larcker, 1998;
Behn and Riley, 1999; Trueman, Wong and Zhang, 2001; Nagar and Rajan, 2001), operating
income and expenses (Behn and Riley, 1999). Studies of the stock price response also suggest
that nonfinancial information drives firm value (Amir and Lev, 1996; Trueman et al., 2001;
Mizik and Jacobson, 2008). However, researchers have produced mixed results regarding the use
of non-financial information by financial analysts.
One group of studies suggests that analysts pay little attention to the disclosure of
non-financial information. Nielsen (2008) found that analysts, infrequently, discuss intellectual capital
in their reports. Garcia-Meca and Martinez (2007) found that, though analysts, in the Spanish
context, report information regarding a company's strategy, customers, and processes, they less
often provide information about research, development, and innovation. Furthermore, analysts
that analysts were not able to account for the benefits of Total Quality Management programs and
consequently underestimated the resulting earnings. Similarly, Benson, Young, and Lawler
(2006) report that analysts consistently underestimated earnings of firms with high-involvement
human resources management practices. On the other side, Dempsey, Gatti, Grinnell and
Cats-Baril (1997) surveyed 420 senior investment officers, directors of research and financial analysts
on the frequency of use, predictive value, and ease of acquisition of a variety of financial and
non-financial performance measures. They found that analysts go well beyond the traditional
financial measures and use a broad range of leading indicators to assess long-term organizational
success. Brown (1997) reported that analysts considered the "Discussion & Analysis" part of the
10-K reports (which discusses non-nonfinancial information) as important for their forecasts.
As for the effects of non-financial information, researchers tend to agree on the value of
this type of information to financial analysts. McEwen and Hunton (1999) found that the use of
financial statement information alone is associated with forecasting error. In a survey entitled
"Metrics that Matter", Ernst and Young, in 1999, reported that analysts' use of non-financial
information improved their forecast accuracy. Vanstraelen et al (2003) found a positive
relationship between non-financial information disclosure and analysts’ forecast accuracies in
Belgium, the Netherlands, and Germany. Oriens and Lybaert (2007) report that the use of
forward-looking information has a positive association with analyst’ forecast accuracy.
Thus, prior research has examined the sources of analysts’ earnings forecasts and the type
of information used. The primary sources of error have included the forecaster characteristics and
firm-specific factors. However, the extent to which the analysts use customer satisfaction and its
relevance to their earnings forecasts remain an open question. Indeed, customer and employee
information tends to be the least used of all. The most important type of non-financial
forward looking information such as new products to be developed in the next 10-years and sales
forecasts. Yet, non-financial information has the potential to decrease earnings forecast errors.
RESEARCH HYPOTHESES
In Figure 1, we provide the conceptual model that underlies our propositions. First, we
consider the influence of customer satisfaction, a proxy for nonfinancial information, on the
actual earnings per share. If customer satisfaction does influence actual EPS, then we can
examine how accounting for customer satisfaction in the earnings forecasts may reduce the
analyst’s forecast errors. For customer satisfaction to influence forecast errors, it must first
influence the forecasts made by the analysts. Below we develop these ideas.
<Insert Figure 1 about here>
Customer satisfaction and Earnings per Share: Customer satisfaction influences customer behaviors that can stabilize and enhance the earnings components such as sales and
costs. Prior studies found that customer satisfaction influences repeat purchase behavior (e.g.
Bolton, 1998), word of mouth or referral activity (e.g. Anderson, 1998), cross-selling rates (e.g.
Verhoef, Franses, and Hoekstra, 2001), frequency of purchase (e.g. Bolton et al, 2000), the
purchase of premium options (e.g. Ngobo, 2005), price premiums or reduced price elasticity (e.g.
Homburg, Koschate, and Hoyer, 2005). By affecting these aspects, customer satisfaction allows
firms to maintain and increase their revenues (e.g. Rust, Moorman, and Dickson, 2002).
Customer satisfaction also reduces the firm's cost of future transactions (e.g. customer
acquisition) through securing a stable customer base and costs related to customer complaints and
product returns (Fornell, 1992). Other studies report a direct link between customer satisfaction
and profitability (e.g. Anderson et al. 1997) and cash flows growth and variability (e.g. Gruca and
customer satisfaction have the potential to accelerate and enhance the level of cash flows and to
lower their volatility. Consequently, our preliminary hypothesis is that:
H 1(preliminary hypothesis): The association between customer satisfaction and
earnings per share is positive.
Customer satisfaction and analysts’ earnings forecasts: Even if we establish the link
between actual EPS and customer satisfaction, it may not automatically follow that the analysts’
earnings forecasts will reflect the company’s customer satisfaction efforts. First, analysts may not
have access to customer satisfaction data, which tends to be private information. Second, even if
it exists (e.g. the ACSI), they may not believe in its causal effects. Williams and Viser (2002)
argue that investors do not see customer satisfaction as an important intangible asset when they
have to evaluate a business. One reason is that they no longer believe that satisfying customers
yields a competitive advantage. In his paper, Hilsenrath (2003) cites Tom Goetzinger, a
Morningstar Inc. analyst who follows Home Depot, familiar with the ACSI data, as saying he
doesn't pay too much importance to the ACSI, except when there are significant score
movements. This analyst is cited as saying: "In general, I've always been leery of telephone
surveys". Third, the influence of customer satisfaction may be marginal, when public information
obtained by analysts substitute for the privately acquired information. Empirical evidence
indicates that stocks with high analyst coverage are more informative (Hong et al, 2000) and that
analysts’ forecasts and recommendations affect stock prices (Givoly and Lakonishok, 1979;
Francis and Soffer, 1997). Thus, it is possible for large analyst coverage to substitute for the lack
of private information. In this case, customer satisfaction should have no incremental value.
However, prior research dealing with the analysts’ use of non-financial information
suggests that customer satisfaction could play a significant role in the analysts’ earnings forecast
satisfaction scores and more pessimistic about firms with poor customer satisfaction
performance. They should be more optimistic because analysts who do believe in (and use)
customer satisfaction are likely to link higher customer satisfaction scores with higher retention
rates (Bolton, 1998), cross buying (Verhoef, 2003), referrals (Anderson, 1998), and/or price
premium effects (Homburg et al. 2005) and consequently with higher operating income. We
hypothesize that:
H2: Customer satisfaction has a positive association with the analysts’ earnings forecasts.
Customer satisfaction and earnings forecast errors: Mechanically, by influencing the
analyst’s optimism (expectations) regarding the firm’s future earnings and consequently the
analyst’s earnings forecasts levels, customer satisfaction will reduce the earnings forecasts errors.
Thus, we consider that customer satisfaction will reduce the forecast errors because it will lead
analysts to make forecasts that are close to the actual firm performance.
H3: Customer satisfaction has a negative association with the analysts’ earnings forecast errors.
DATA
Sample: Before formally modeling the relationship between customer satisfaction and
analysts’ earnings forecast errors, we present a descriptive analysis of the data. To study the
effects of customer satisfaction on analysts’ outputs, we need a sample of firms that have data on
customer satisfaction. Therefore, we began by selecting firms from the American Customer
Satisfaction Index (ACSI) project at the University of Michigan Business School. Then, we
selected all the ACSI firms in the Institutional Brokers Estimate System (I/B/E/S) files. We used
the Masked Detail tape that provides earnings forecasts and forecast dates for individual analysts
number of forecasts for companies. However, we had to make some choices based on the
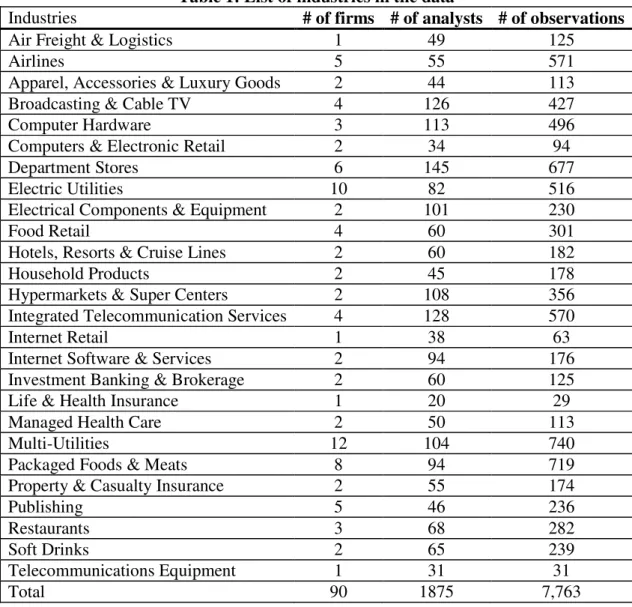
standard practices in accounting and finance publications. For example, we eliminated analysts
who had not made at least four (4) forecasts in the dataset. We also eliminated some industries
because many firms are not public companies but only subsidiaries or SBUs of large companies.
Because the ACSI is a quarterly database, we use predictions made one quarter ahead. We match
the forecast earnings to the realized earnings for every relevant period.
It is important to understand the timing of ACSI scores to understand how we linked the
data with the IBES forecast values. The American Customer Satisfaction Index reports customer
satisfaction data quarterly for each company once a year. For example, data for Prudential
Financial, Inc. is published in February only every year (which the ACSI project calls fourth
quarter). The I/B/E/S, however, reports data for Prudential Financial, Inc. for every quarter of the
year. Therefore, we need to reorganize the data. We proceed as follows. First, using the ACSI
data, we refer to customer satisfaction scores reported in February as first quarter data, in May as
second quarter data, in August as third quarter, and in November as fourth quarter data. We relate
the customer satisfaction data made available in February to earnings forecasts for quarter closing
in March. Consequently, for companies whose satisfaction scores appear in February, we use
only their forecast errors for the quarter ending in March. For companies whose satisfaction
scores appear in May, we use only their forecast errors for quarter ending in June and so on. We
need to combine the ACSI date with the earnings forecast date. However, we do not know the
exact date where ACSI scores are available to analysts or if they are even available to analysts on
the forecast date recorded by the I/B/E/S. Thus, we try to synchronize the forecast dates as
closely as possible to the dates at which the ACSI scores are available. We examined the ACSI
publication and commentary dates on the www.theacsi.org. For example, in 2000 commentaries
indicate (footnote 3) possibilities of prior leakage of customer satisfaction information because
the “ACSI results were routinely provided under embargo to the public relations and market
research units of corporate subscribers and to The Wall Street Journal about two weeks before the
release” (p.7-8). Consequently, we retained only the latest forecast made by the analyst, which
should reflect all the information available to the analyst. Furthermore, Fornell et al (2006) states
that: “Although ACSI has measured customer satisfaction since 1994, before the second quarter
of 1999, the results were published once a year in Fortune magazine, making it difficult to
pinpoint the event date because readers received the magazine on different dates”. Indeed, the
ACSI data were the object of significant press coverage in 1995 (Stewart, 1995) and later in 1998
(Lieber, 1998; Martin, 1998; Grant, 1998) in a series of articles published in Fortune Magazine.
The first publication of the ACSI data in Fortune was on December 11, 1995. However,
subscribers may have obtained the issue two weeks earlier (Ittner and Larcker, 1998). Therefore,
we added the forecasts made from November 27, 1995 to December 1, 1995, and combined them
with the forecasts made in 1996 through 20042.
<Insert Table 1 about here>
Dependent Variable: We used the absolute value of the analyst’s earnings forecast error
because it is the most widely adopted and easier to interpret than the signed measure. We
determined this measure as follows: FEt+1hij =(AEt+1hij−EFthij)/EFthijwhere AEt+1hij refers to the
actual earnings of firm i in industry j and quarter t+1 that was followed by analyst h and EFthij
refers to the earnings forecasted by that analyst. When the analyst made at least two forecasts, we
retained the latest one to be sure that it includes the most recent information prior to the release of
2
We distinguished between the two periods (i.e. 1995-1999: 1 versus 1999:2 through 2004) with a dummy variable but found no significant differences in the effects of ACSI.
the company’s quarterly earnings. We use the earnings provided in the I/B/E/S because they
exclude the special, extraordinary items, discontinued operations, and effects of accounting
changes. This is important, as customer satisfaction should typically influence operating earnings.
Independent variables (analyst level): Consistent with the research purpose and prior studies, we include the following measures: (1) experience, (2) portfolio or task complexity, and
(3) analyst's resources. Experience: We use two measures to capture the analyst’s abilities and
skills regarding earnings forecasting. They are the firm-specific experience and the general
experience. Firm-specific experience refers to number of prior quarters for which the analyst h
following firm i in industry j in quarter t provided at least one forecast for that firm. General
experience corresponds to the number of quarters (irrespective of the firm) analyst h following
firm i in industry j supplied at least one forecast during the previous quarters through quarter t.
Task complexity: Task complexity refers to the number of firms and industries followed by the
analyst. The number of companies followed by the analyst measures the number of firms that
analyst h follows in quarter t. The number of industries is a measure of the number of 4-digit SIC
industries followed by analyst h in quarter t. Analyst Resources: Resources reflect the size of the
brokerage firm. Brokerage Size measures the number of analysts employed by the brokerage firm
employing analyst h who follows firm i in industry j in quarter t.
Independent Variables (Firm-level): We control for company size, number of analysts
(or coverage), business uncertainty or volatility, and prior performance. In line with our research
model, we add customer satisfaction data to assess its incremental value for analysts. Company
size is measured with the logarithm of the firm’s market value one quarter before the release of
analysts’ earnings forecasts. We expect a negative relation between firm size and forecast error.
Analyst Coverage measures the number of analysts who follow the company, and consistent with
Business uncertainty or volatility is supposed to increase the forecasting difficulty for the analyst.
We use the standard deviation of earnings per share (EPS) computed over the preceding quarters
to measure the firm’s volatility. Prior performance accounts for prior profitability. We consider
prior earnings levels to capture the analysts’ response to earnings announcement or any
“post-earnings announcement drift”. Indeed, one of the most widely discussed forecasting anomalies is
“post-earnings announcement drift,” which is said to stem partly from an under-reaction to past
earnings announcements (Zhang, 2008). Furthermore, Hwang et al. (1996) find that analysts’
forecasts errors are larger for loss firms than for the profitable firms. We include a dummy
variable (LOSS) that equals one (1) for firms that report negative earnings in the quarter
preceding the forecasting period and 0 otherwise.
Customer Satisfaction Scores: We collect firm-level customer satisfaction scores from the
American Customer Satisfaction (ACSI) at the University of Michigan. We composed an 11-year
datasheet of quarterly data on customer satisfaction. We use the satisfaction data made available
on the website (www.theacsi.org), which provides data for many firms since 1994 (see Fornell et
al. 1996). The ACSI is a quarterly survey of customers. The first scores came out in October
1994. Since then, there has been a quarterly updating. The ACSI project defines customer
satisfaction as an overall evaluation of the purchase and consumption experience to-date.
Satisfaction (3 10-point items) reflects the customer’s overall feeling of satisfaction, evaluation of
quality regarding expectations, and quality regarding ideal. A company’s satisfaction score is the
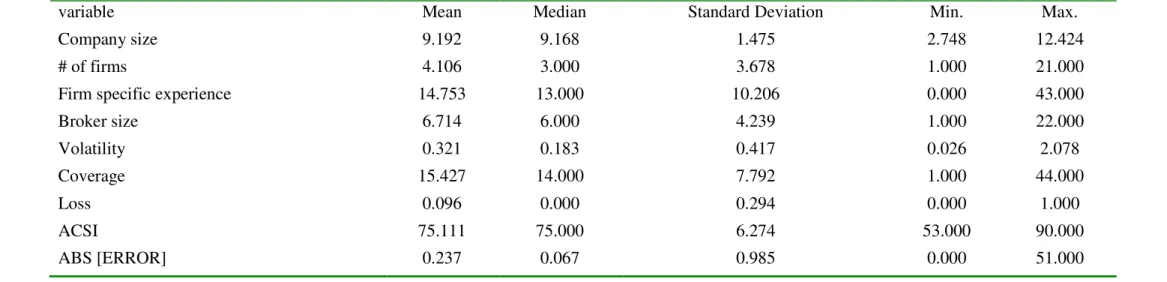
satisfaction of all its interviewed customers. It ranges from 0 to 100. In Table 2, we report the
descriptive statistics for the key variables.
The average number of firms covered by an analyst in our sample is approximately four
(4.10). It is worth noting that the number of analysts per firm and firms per analyst are not
comparable to those reported in other studies on earnings forecasts. Our research includes only
the firms for which we have satisfaction data. The average number of industries is 4.17. In terms
of firm-specific experience, the average analyst has been following a specific company for about
fifteen (14.753) quarters. The average general experience is about 82.497 quarters. In Table 3, we
report the different correlations between the variables of interest. As we can see, the correlations
between number of firms and number of industries is very high (0.968) and so is the correlation
between complexity variables and general experience. To avoid multicollinearity problems, we
decided to measure complexity with the average number of industries and firms followed by the
analysts and the experience with firm-specific experience.
< Table 3 about here>
MODEL FORMULATION
We develop a model that summarizes the current research on predicting earnings forecast
errors, i.e. which accounts for analysts, firm, and possibly industry factors. Indeed, we need to
test whether ACSI provides incremental information over standard measures that generally
influence analysts’ forecast errors. In particular, we must control for well-known covariates, such
as firm size, profitability, risk, and analyst coverage. Furthermore, the problem, as shown in the
data, is that the number of firms is too small in some industries. This makes it difficult to estimate
the within-industry as well as the between-industry variation reliably. Indeed, when estimating
multilevel models, it is desirable to have as many units as possible at the top level of the
multilevel hierarchy (Snijders, 2005). Therefore, we decided to estimate only three levels: (1) the
within-analyst variation, (2) the within-firm (or between analyst) variation, and (3) the
dummy variables (Jacobson and Mizik, 2008). We specify the dependent variable for analyst h
(h=1,…H) following firm i (i=1,…,I) in industry j (j=1,…,J) in quarter t+1 (t=1,…,T) as follows:
(1) hij 1 t ijt SAT i P 1 p p ijt X p i ijt LEPS i t CCI P 2 p p QTR p P 2 p p j SEC p 0 hi 1 t hij ACSI X EPS CCI QTR SEC y ) ( , , , ) ( + + + + = = = = = = = = = = = = + ++ + + + + + × × × × + + + + × ×× × + + + + × × × × + + + + × × × × + + + + × × × × + + + + × ×× × + + + + = == =
∑
∑
∑
∑
∑
∑
∑
∑
∑
∑
∑
∑
ε β β β β β β βHere y(t+1)hijrefers to the dependent variable (e.g. forecast, forecast error) for analyst h
regarding firm i in sector j and quarter t+1. To capture the analysts’ response to earnings
announcement or any “post-earnings announcement drift”, we control for current earnings (EPSijt
). Indeed, one of the most widely discussed forecasting anomalies is “post-earnings
announcement drift,” which is said to stem partly from an under-reaction to past earnings
announcements (Zhang, 2008).QTRprefers to a vector of quarter effects (e.g. February, May,
August, and November) which examines quarter-specific effects associated with customer
satisfaction publication. SEC is a vector of sector dummy variables. j CCI refers to the consumer j
confidence index in time t. It captures the consumers’ optimism on the state of the economy and
it may affect the company’s future earnings as it influences consumers’ activities of spending.
hijt
X is a vector of firm-level control variables (i.e. other firm-specific variables such as analyst
coverage, risk), ACSIijt refers to the customer satisfaction score of firm i in sector j in quarter t, β
reflects the impact of these variables. β0hiis the intercept and ε(t+1)hij is an error term. We control
for unobserved heterogeneity with these relationships:
(2) 0 hi 0 i 0 P 1 p p hijt Z p 01 0 00 0 hi β β Z ν µ β ==== ++++
∑
∑
∑
∑
×××× ++++ ++++ = == = , ,(3) pred pred predi
i β ν
0 hi µ ~ N(0, Ωµ) pred i ν ~ N(0, Ω ν)
Where the average forecast error (or grand mean) is 0 00
β , 0 i 0
ν is the firm-specific error term, 0 hi
µ is
the analyst-specific error term, which allow us to capture the between-firm and the within-firm
variation respectively. We control for the observed analyst heterogeneity with Zhijt, which is a
vector of the characteristics of analyst h following firm i sector j and time t. The mean effect of
each predictor is βpred and pred i
ν is the variation around that mean. By combining equations (2) and
(3) with equation (1), we obtain the following:
(4) hij 1 t ijt SAT i ijt SAT P 1 p p ijt X p i P 1 p p ijt X p ijt EPS i ijt EPS t CCI P 2 p p QTR p P 2 p p j SEC p 0 hi 0 i 0 P 1 p p hijt Z p 01 0 00 1 t hij ACSI ACSI X X EPS EPS CCI QTR SEC Z y ) ( , , , , , , ) ( + ++ + = = = = = = = = = = = = = = = = = = = = + + + + + + + + × ×× × + ++ + × × × × + + + + × × × × + + + + × × × × + + + + × × × × + ++ + × ×× × + + + + × × × × + ++ + × × × × + ++ + × ×× × + + + + + + + + + + + + × × × × + + + + = = = =
∑
∑
∑
∑
∑
∑
∑
∑
∑
∑
∑
∑
∑
∑
∑
∑
∑
∑
∑
∑
ε ν β ν β ν β β β β µ ν β βEquation (4) subsumes many standard models used in accounting and finance when
ijt
ACSI is excluded. Nevertheless, our standard model (i.e. Equation 6 with ACSIijt= 0) differs
from previous studies, as we assume that the intercept as well as some parameters will differ
across firms. Furthermore, our model deals with cross-sectional dependence between analysts
following the same company. The forecasts’ of analysts are related for a given firm. If a firm has
a particularly good period due to some unforeseen event, it is likely that all the analysts will make
inaccurate forecasts. This phenomenon induces cross-sectional dependency in the error term.
Equation (4) will serve to test hypotheses 2 and 3. A significant coefficient of the ACSI variable
We expect the ACSI coefficient to be positive for the earnings forecasts (H2) and negative for the
forecast errors (H3). To test H1, we consider a different equation that excludes analysts.
(5) ij 1 t i 0 ijt SAT i ijt SAT P 1 p P 1 p p ijt X p i ijt X p ijt LEPS i ijt EPS t CCI P 2 p p QTR p P 2 p p j SEC p 0 1 t ij ACSI ACSI X X EPS EPS CCI QTR SEC EPS ) ( , , , ) ( + ++ + = = = = ==== = = = = = == = + + + + + + + + + + + + × × × × + + + + × × × × + + + + × × × × + ++ + × × × × + + + + × ×× × + ++ + × ×× × + + + + × × × × + ++ + × × × × + + + + × × × × + ++ + = = = =
∑
∑
∑
∑
∑
∑
∑
∑
∑
∑
∑
∑
∑
∑
∑
∑
ε ω ζ β ζ β ζ β β β β βHere EPS refers to the earnings per share of firm i in sector j and quarter t+1. The other
variables are defined as above. β , ζ , ω, and µ(t++++1)ijare the model parameters. We expect the
ACSI coefficient (βSAT) to be positive consistent with H1.
FINDINGS Models in levels
In Table 4, we report the results pertaining to H1. Here, we estimate a firm-level model
for the 90 companies in our dataset. The number of observations is 720. Model 1 provides the
estimates for the model that estimates the influence of the control variables only. Model 2
accounts for the influence of ACSI. The BIC shows this model is not better than Model 1. Then,
we estimate a model that accounts for response heterogeneity. The BIC shows that this model has
a better fit than Models 1-2.
<Insert Table 4 about here>
In Model 3, we can see that larger values of ACSI are associated with a significantly
higher level of future actual EPS from the company (0.013, p<0.05). The random coefficient for
ACSI is not significant, an indication that there is no heterogeneity regarding the influence of
customer satisfaction. Thus, we find support for H1, i.e. customer satisfaction has a positive
earlier is associated with actual earnings per share, the question becomes whether analysts are
influenced by this information.
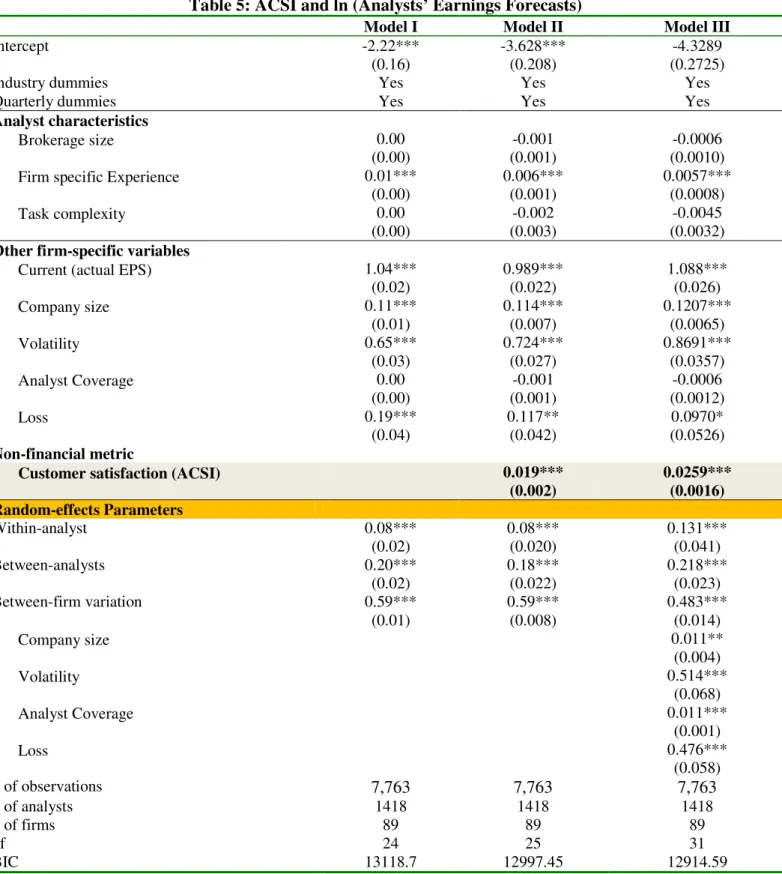
Table 5 reports the results about the analysts’ earnings forecasts. In Model I, we report the
estimates for the model with the control variables. Next, we include ACSI (Model II). This model
has a better fit than the model without ACSI. Further, we estimate the model that controls for the
response heterogeneity and the results show that Model III has a better fit than Model II. In
Model III, we can see that ACSI has a positive association with the earnings forecasts (0.0259,
p<0.000). These findings are suggesting that the forecasts are larger for companies with higher
ACSI scores, probably reflecting the optimism expressed by those analysts. Therefore, H2 is
supported. Furthermore, we observe that analysts tend to make higher forecasts for larger
companies (0.1207, p<0.001), which means that they have higher expectations for larger firms3.
Forecasts are larger for volatile firms as well (0.8691, p<0.001). This may also reflect the fact
that analysts expect higher returns from companies with higher levels of risk. Finally, analysts’
forecasts are larger for companies that reported a loss in prior quarter, meaning that they expect
these firms to improve their performance in the future.
<Insert Table 5 about here>
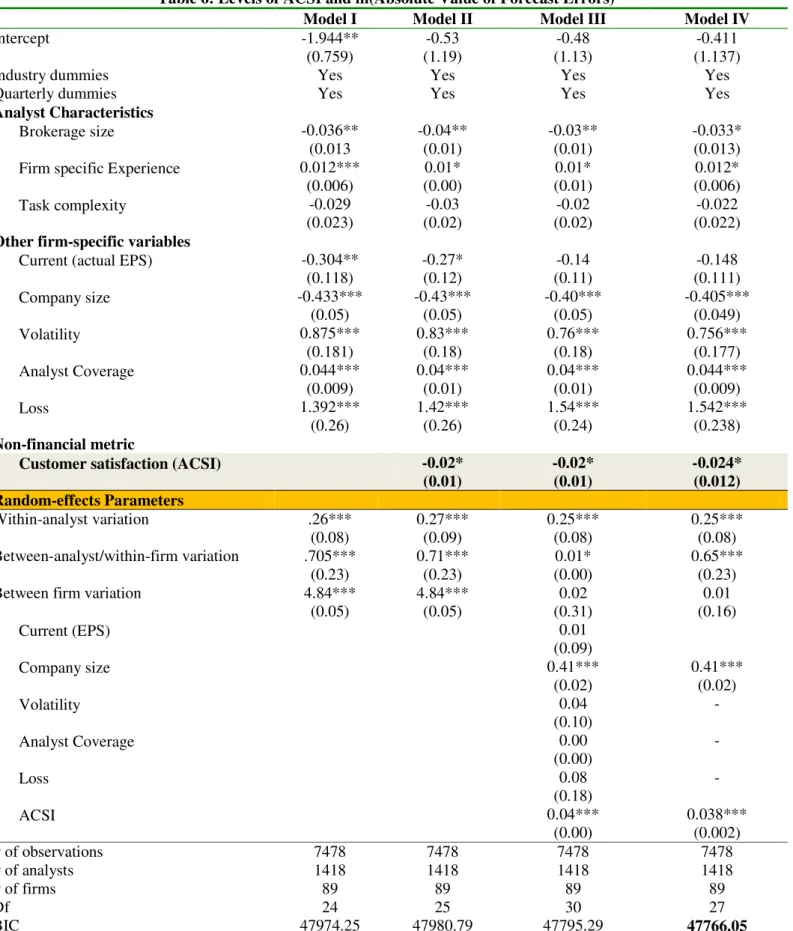
Table 6 presents the results regarding the analysts’ earnings forecasts errors. Model I
includes all the control variables. In Model II, we account for the influence of customer
satisfaction. The results suggest that the model fit statistics are poorer than in Model I. In Model
III, we account for response heterogeneity among firms. The results show that this model has a
better fit than Model II. Furthermore, we estimate a model that constrains the non-significant
random coefficients to zero and find that this model has an even better fit.
3 Company size is measured with ln(market value). This may also suggest that analysts factor investors’ current
<Insert Table 6 about here>
In this model (Model IV), we find that the size of the brokerage company reduces the forecast
errors (-0.033, p<0.05), reflecting the availability of the resources. However, contrary to
expectations, we observe a positive association between firm-specific experience and forecast
errors (0.012, p<0.05). This may reflect overconfidence, which leads analysts to over-forecast as
can be seen in Table 5. Looking at the company-specific variables, we find that the forecast
errors are smaller for large companies (-0.405, p<0.000), reflecting the information availability.
Errors are greater for volatile companies (0.756, p<0.000), reflecting the difficulty for the
analysts to match the actual earnings of these risky companies. The errors are also larger for
companies which made losses in prior periods (1.542, p<0.000). These errors may come from the
fact that analysts are less motivated to follow firms with negative earnings, as they have to spend
effort collecting, analyzing, and summarizing relevant information. If analysts re-issue earlier
forecasts without doing any new research (Chen and Cheng, 2001), their forecast errors could
differ from the new firm reality. Large analyst coverage is associated with greater forecast errors
(0.044, p<0.000). This finding contrasts with the majority of the prior studies. Nevertheless, this
might reflect the information gap between more and less informed analysts, which increases the
variation in the analysts’ forecasts. Finally, we find that customer satisfaction has a negative
association with forecast errors (-0.024, p<0.05) consistent with our prediction in H3.
Models in Changes
Our results suggest that customer satisfaction has a negative effect on earnings forecast
errors. However, Jacobson and Mizik (2008) argue that in an efficient market, the metric (e.g.,
analyst forecast) already reflects the anticipated information and, consequently, the market
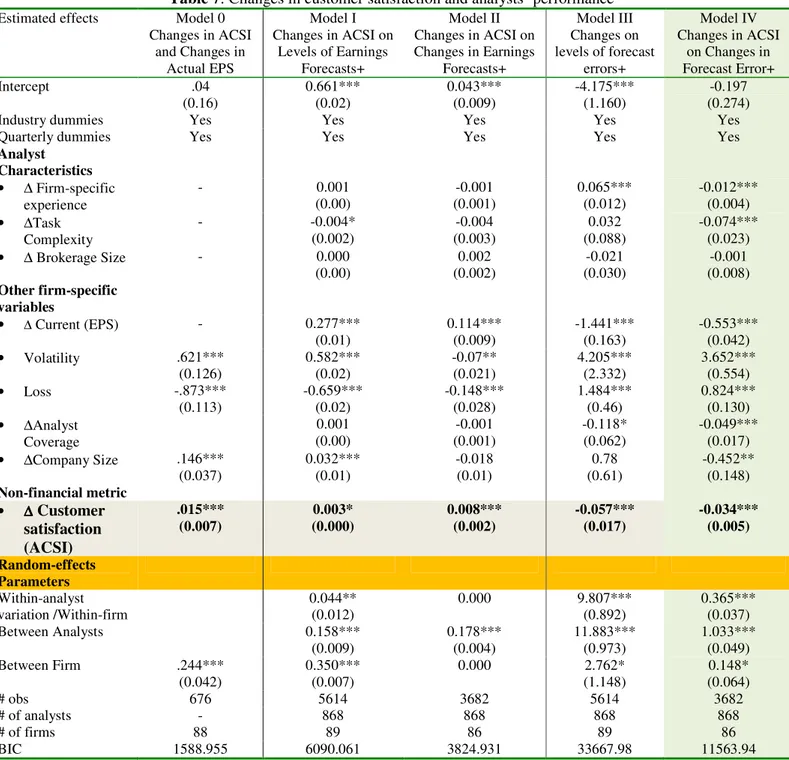
be in contradiction to the efficient market theory. In Table 7, we report the results from
estimating the effects of changes in customer satisfaction.
<Insert Table 7 about here>
We began by estimating a model of the effects of changes in customer satisfaction and
levels of actual EPS. In this model, changes in customer satisfaction did not significantly
influence the levels of future earnings per share. Then, we estimated Model 0 reported in Table 7.
In this model, we relate the changes in customer satisfaction with changes in the actual EPS over
two consecutive periods, e.g. Quarter 1 2000 versus Quarter 1 19994. As can be seen, an increase
in customer satisfaction leads to changes in actual EPS (0.015, p<0.001). Similarly, a change in
company size is associated with changes in EPS (0.146, p<0.001). Next, we consider the effects
of changes in predictors on the levels of analysts’ earnings forecasts (Model I). The results show
that changes in company size (i.e. in market value) lead to higher earnings forecasts as well
(0.032, p<0.001). The associations between volatility, loss and forecasts are similar to the results
in levels. However, an increase in task complexity decreases the earnings forecasts (-0.004,
p<0.05), reflecting the difficulty for the analyst to have a deep knowledge of the company
business. A change in ACSI is associated with a small but significant effect on the level of the
analyst’s EPS forecast (0.003, p<0.05). In Model II, we estimate the effects of changes in
customer satisfaction on changes in earnings forecasts. The results indicate that changes in
customer satisfaction lead to changes in earnings forecasts (0.008, p<0.001) despite a significant
effect of changes in current earnings (0.114, p<0.001). This is an indication that customer
satisfaction does provide some relevant information to analysts in addition to changes in
earnings. Model III, which reports the results regarding the levels of forecast errors, shows that a
change in ACSI is associated with a decrease in levels of earnings forecast errors (-0.057,
p<0.001).
Finally, we consider whether a change in ACSI leads to a decrease in forecast error over
two consecutive periods. We computed the dependent variable as the current error minus the
previous quarter’s error. We lose many observations because of the analyst turnover. We find
that changes in firm-specific experience lead to decreases in forecast errors (-0.012, p<0.001).
Nevertheless, we find that a change in task complexity (# of firms analyzed) leads to a decrease
in forecast errors over two consecutive periods (-0.074, p<0.001), probably suggesting that the
companies operate in similar industries5. Turning to the other-firm specific variables, we observe
that an increase in current earnings leads to a decrease in forecast error (-0.553, p<0.001) and so
do increases in analyst coverage (-0.049, p<0.001) and company size (-0.452, p<0.01). These
results are consistent with the literature in the sense that analyst coverage and company size
reflect information availability (Garcıa-Meca and Sanchez-Ballesta, 2006). Furthermore, an
increase in volatility is associated an increase in forecast errors (3.652, p<0.001), an indication of
the uncertainty associated with future earnings (Parkash et al., 1995). The forecast errors increase
more for companies that made a loss (0.824, p<0.001). Again, this may reflect the difficulty for
the analyst to forecast the earnings of these firms and consequently to match the business reality.
Finally, as expected we find that a change in customer satisfaction is associated with a decrease
in the forecast error over two consecutive periods (-0.034, p<0.001).
GENERAL DISCUSSION
Customer satisfaction has been the focus of marketing studies for some time now. Prior
research shows that customer satisfaction has a positive association with many important
financial metrics. However, aside from direct analyses of the impacts of customer satisfaction on
financial metrics, prior work generally provides little insight into the use of the customer
satisfaction information by key market participants such as financial analysts. The purpose of this
study has been to examine whether customer satisfaction information, known at the time of the
forecast, is related to the forecast error. We obtain empirical evidence that customer satisfaction,
no matter the specification (whether in levels-on-levels, levels or
changes-on-changes), influences the analyst’s performance. On average, customer satisfaction reduces the
analyst’s forecast error. The information provided by customer satisfaction is incremental to the
traditionally used drivers of forecast errors such as prior earnings, company size (lagged market
value), analyst coverage or volatility. Our theory is that customer satisfaction influences the
customer behaviors that stabilize and increase the company’s cash flows (Gruca and Lopo, 2005).
Consequently, by increasing the earnings forecasts made by the analyst as well, customer
satisfaction reduces the discrepancy with actual EPS achieved by the company. Our findings
show that, despite controlling for the influence of the variables often identified as influencers of
the analyst forecast errors, the impact of customer satisfaction remains significant. Furthermore,
we find that the variables generally used to explain analysts’ errors (e.g. the firm specific
experience) do not eliminate the effects of customer satisfaction information. Despite including
the analyst’s firm-specific experience, customer satisfaction still shows incremental value beyond
that reflected in those variables.
We shed new light on the ongoing debate about the mispricing of customer satisfaction
information (Fornell et al 2006; Jacobson and Mizik, 2008; Aksoy et al. 2008; O’Sullivan et al.
2009). Our results suggest that we may observe a mispricing of customer satisfaction (i.e. ACSI)
follow higher- versus lower-ACSI firms. Our results indicate that analysts’ earnings forecasts will
be higher for companies with higher customer satisfaction scores and lower for companies with
smaller scores consistent with the literature. Therefore, if analysts account for customer
satisfaction in their earnings forecasts, we may not find a mispricing of customer satisfaction.
However, if they do not, then we can find a mispricing of customer satisfaction. The robustness
of our analyses might suggest that this mispricing stems from the difference in the use of
customer satisfaction information. Therefore, our finding is probably providing part of the
explanation about how customer satisfaction information comes into stock prices. Customer
satisfaction can influence stock price because customer satisfaction influences the analyst’s
earnings forecasts and forecast errors. Our results add to prior research by showing that high
customer satisfaction is also associated with lower forecast errors in addition to accounting
performance (Anderson et al 1994; 1997; Banker et al. 2000), financial performance (Anderson et
al. 2004; Fornell et al. 2006), and the firm performance on the bond market (Anderson and
Mansi, 2008).
The present study has implications for the study of analysts’ performance. We have extended
our understanding of the factors that explain the sources of analysts’ forecast errors. Although
prior research has examined the effects of intangible assets (e.g. Barron et al. 2002; Gu and
Wang, 2005), to our knowledge, this is the first paper to address the effects of customer
satisfaction on the levels of forecast errors by financial analysts. Our study suggests that financial
analysts should use non-financial information in their earnings forecast efforts and that customer
satisfaction data should be part of it. For managers, our research suggests that, in addition to the
effects on customer behaviors and firm profitability, customer satisfaction may also influence the
The current research contributes to the development of a foundation for a better
understanding the relationship between marketing investments and share prices. In the recent
years, marketers have voiced concern about the legitimacy of marketing within the firm. More
specifically, it appears that marketing’s influence has been decreasing at the level of corporate
strategy (Anderson, 1982; Day 1992; Webster, Malter and Ganesan 2003; Varadarajan, 1992).
This study shows that one way marketing can regain its place on the table is through helping
financial analysts. Prior research suggests that analysts can influence share price movements
through their forecasts. As a result, by allowing them to make accurate forecasts, customer
satisfaction is likely to interest analysts and to contribute to a better image of marketing
investments among analysts, CFOs, and CEOs. This means that marketers could improve the
legitimacy of marketing by getting analysts to seek systematically customer metrics to explain
their followed companies’ growth. Our study suggests that one way through which customer
metrics might come into share prices is probably through analysts’ earnings forecasts. By
influencing the analysts’ earnings forecasts, customer satisfaction is likely to influence share
prices as indeed analysts forecasts influence their recommendations (Womack, 1996).
Our study has relevance for corporate disclosure strategy as well. Given the value
relevance of customer satisfaction for earnings forecasts, corporate managers should
systematically report this data during conference calls and any meeting with financial analysts.
Companies increasingly use conference calls to enhance investors and analysts’ understanding of
earnings announcements. They are informative to market participants as they enhance stock price
responses and help analysts form more accurate earnings expectations. We suggest that
improvements to analysts. Similarly, when possible, the management should highlight the role of
customer satisfaction in driving the company’s earnings.
This study also has some limitations, which provide the foundation for additional
research. First, we had to limit our sample to firms for which we had data available in the
I/B/E/S. We did not study all companies tracked by the ACSI project. Furthermore, we have
examined only the short run effects of customer satisfaction. Additional research going beyond
the immediate (same-quarter) effects to the long run effects may provide additional insights into
the role of non-financial information (such customer satisfaction) for the analyst forecasts and
firm valuation. This study also examined the effects of customer satisfaction on forecast errors.
The next step would be to examine the relationship between customer satisfaction and analysts’
recommendations. For example, do sell-hold-buy recommendations of the high-customer
satisfaction firms differ from those for the low-satisfaction companies? Our results suggest that it
is important to conduct a fine-grained analysis of the specific customer metrics revealed by firms.
For example, we need to examine how customer retention, cross-selling rates do or do not
influence the analysts’ earnings forecasts. Such analysis would be in line with marketers’
concerns regarding the effects of marketing actions on firm value. Such an effort would also
show the complementarities between qualitative information and quantitative information, with
the potential for enhancing the legitimacy of marketing to the board. In sum, our findings suggest
that if financial analysts neglect customer satisfaction information, they might deprive themselves
of an important proxy of non-financial information.
REFERENCES
Aboody, D. and Baruch Lev (1998), “The Value Relevance of Intangibles: The Case of Software
Aksoy Lerzan, Bruce Cooil, Christopher Groening, Timothy L. Keiningham and Atakan Yalçın
(2008), “The long term stock market reaction of customer satisfaction” Journal of
Marketing, July, forthcoming
Allenby, Greg M., and Peter E. Rossi (1999), “Marketing Models of Consumer Heterogeneity,”
Journal of Econometrics, 89 (March/April), 57-78.
Anderson, Paul F. (1982), “Marketing, Strategic Planning and the Theory of the Firm,” Journal
of Marketing, 46 (Spring), 15-26.
Anderson, Eugene W. (1998), “Customer Satisfaction and word-of-mouth,” Journal of Service
Research, 1, (August), 5-17;
Anderson, Eugene W., and Sattar Mansi (2008), “Does Customer Satisfaction Matter to
Investors? Findings from the Bond Market,” Working Paper, available at www.ssrn.com;
Anderson, Eugene W, Claes Fornell and Roland T. Rust (1997) “Customer satisfaction,
Productivity and Profitability: Differences between goods and services” Marketing Science,
16 (Spring), 129-145;
Anderson, Eugene W., Claes Fornell, and Donald R. Lehman (1994), “Customer satisfaction,
Market share, and Profitability: findings from Sweden” Journal of Marketing, 58 (July),
53-66;
Anderson, Eugene W., Claes Fornell, and Sanal K. Mazvancheryl (2004), “Customer Satisfaction
and Shareholder Value,” Journal of Marketing, 68 (October), 172–85.
Atiase, R. K. (1985), “Predisclosure information, firm capitalization, and security price behavior
Ball, Ray and Philip Brown (1968), “An empirical evaluation of accounting income numbers”,
Journal of Accounting Research, 6, 159-178;
Banker, Rajiv D., Gordon Potter and Dhinu Srinivasan (2000), “An empirical investigation of an
incentive plan that includes nonfinancial performance measures”, Accounting Review, 75
(January), 65-92;
Barron Orie, Byard Donald, Kile Charles, and Edward J. Riedl (2002), “High-technology
intangibles and analysts’ forecasts”. Journal of Account Research, 40 (May), 289–312
Behn, B. K. and R. A. Riley (1999), “Using nonfinancial information to predict financial
performance: The case of the US airline industry”, Journal of Accounting, Auditing and
Finance 15 (1): 29 – 56.
Benson George S., Susan M. Young, and Edward E. Lawler III (2006), “High-involvement work
practices and analysts’ forecasts of corporate earnings” Human Resource Management, 45
(Winter), 519-537;
Bernhardt, Kenneth L., Naveen Donthu, and Pamela A. Kennett (2000), “A longitudinal analysis
of satisfaction and profitability” Journal of Business Research, 47 (February), 161-171;
Bolton, Ruth N. (1998), “A Dynamic Model of the Duration of the Customer’s Relationship with
a Continuous Service Provider: The Role of Satisfaction,” Marketing Science, 17 (Winter),
45-65.
Bolton, Ruth N., P. K. Kannan, and Matthew D. Bramlett (2000), “Implication of Loyalty
Programs and Service Experiences for Customer Retention and Value,” Journal of the
Brown, L. (1997), “Analyst forecasting errors: Additional evidence”. Financial Analysts Journal,
November–December, 81–88.
Brown Lawrence D., Gordon Richardson and Steven Schwager (1987), “An information
interpretation of financial analyst superiority in forecasting earnings”, Journal of Accounting
Research, 25(Spring), 49-67
Chen Xia and Qiag Chang (2001), “On the association of analysts’ forecast errors with past stock
returns: A re-examination” Working Paper, University of British Columbia - Sauder School
of Business
Chung, H. and J. B. Kim (1994), “The use of multiple instruments for measurement of earnings
forecasts errors, firm size effect and the quality of analysts’ forecasts errors”, Journal of
Business, Finance and Accounting, 21(5), 707–727.
Clement, Michael (1999), “Analyst forecast accuracy: Do ability, resources and portfolio
complexity matter?” Journal of Accounting and Economics, 27, 285–303.
Das, S., and S. M. Saudaragan (1998), “Accuracy, bias, and dispersion in analysts’ earnings
forecasts: The case of crosslisted foreign firms”, Journal of International Financial
Management and Accounting, 9(1), 16–33.
Day, George. S. (1992), “Marketing’s Contribution to the Strategy Dialogue,” Journal of the
Academy of Marketing Science, 20 (Fall), 323-329.
Dehning Bruce, Glenn M. Pfeiffer and Vernon J. Richardson (2006), “Analysts' forecasts and
investments in information technology” International Journal of Accounting Information
Dempsey, S. J.; Gatti, James F.; Grinnell, D. and W. L. Cats-Baril (1997), "The Use of Strategic
Performance Variables as Leading Indicators in Financial Analysts' Forecasts" Journal of
Financial Statement Analysis,. 2, 4, 61-79.
Easton George S and Sherry L. Jarrell (1998), “The Effects of Total Quality Management on
Corporate Performance: An Empirical Investigation” Journal of Business, 1998, vol. 71, no.
2, 253-307;
Finkelstein Sydney and Brian K. Boyd (1998), “How Much Does the CEO Matter? The Role of
Managerial Discretion in the Setting of CEO Compensation,” The Academy of Management
Journal, 41(April), 179-199.
Fornell, Claes (1992), "A National Customer Satisfaction Barometer: The Swedish Experience"
Journal of Marketing, 56 (January), 6-21;
Fornell, Claes, Michael D. Johnson, Eugene W. Anderson, Jaesung Cha, and Barbara Bryant
(1996), “The American Customer Satisfaction Index: Description, Findings, and
Implications,” Journal of Marketing, 60 (October), 7-18.
Fornell, Claes, Sunil Mithas, Forrest Morgeson (2008a), “Alpha Picking and Beta Surfing:
Above-Market Returns on Customer Satisfaction Persist” Working paper, Ross School of
Business, University of Michigan
Fornell, Claes, Sunil Mithas, Forrest Morgeson (2008b), “The Statistical Significance of Portfolio
Returns” Working paper, Ross School of Business, University of Michigan
Fornell, Claes, Sunil Mithas, Forrest Morgeson, and M.S. Krishnan (2006), “Customer
Satisfaction and Stock Prices: High Returns, Low Risk,” Journal of Marketing, 70 (January),
Francis, Jennifer and Leonard Soffer (1997), “The relative informativeness of analysts stock
recommendations and earnings forecasts revisions”, Journal of Accounting Research, 35
(Autumn) 193-212;
García-Meca Emma and Juan Pedro Sanchez-Ballesta (2006), Influences on financial analyst
forecast errors: A meta-analysis" International Business Review, 15 (February), 29–52
García-Meca Emma and Isabel Martínez (2007), “The use of intellectual capital information in
investment decisions An empirical study using analyst reports” The International Journal of
Accounting, 42, Issue 1, 57-81
Garmaise Mark J. (2009), “Marketing Issues in Corporate Finance (Comment)” Journal of
Marketing Research, forthcoming June Issue
Givoly Dan and Joseph Lakonishok (1979), “The information content of financial analyst
forecasts of earnings: Some evidence of the semi-strong market efficiency”, Journal of
Accounting and Economics, 1 (December), 165-186.
Grant, Linda (1998), “Your Customers Are Telling The Truth” February 16, http://
money.cnn.com/ magazines/fortune/fortune_archive/1998/02/16/237677/index.htm
Gruca, Thomas and Lopo Rego (2005), “Customer Satisfaction, Cash Flow, and Shareholder
Value,” Journal of Marketing, 69 (July), 115–30.
Gu Feng and Wei Min Wang (2005), “Intangible Assets, Information Complexity, and Analysts’
Earnings Forecasts” Journal of Business Finance & Accounting, 32(November &
December), 1673-1702;
Gupta, Sunil and Valarie Zeithaml (2006), “Customer Metrics and their Impact on Financial
Hilsenrath, Jon E. (2003), “Satisfaction Theory: Mixed Yield --- Professor's Portfolio Shows
Strategy of Linking Returns To Reputation Isn't Perfect,” Wall Street Journal, (February
19),
Hodgkinson, Lynn (2001), “Analysts’ forecasts and the broker relationship”, Journal of Business,
Financial and Accounting, 28 (September/October ), 943–961;
Homburg Christian, Nicole Koschate, and Wayne D. Hoyer (2005), “Do Satisfied Customers
Really Pay More? A Study of the Relationship between Customer Satisfaction and
Willingness to Pay” Journal of Marketing, Vol. 69 (April), 84-96
Hong, Harrison, Terence Lim and Jeremy C. Stein (2000), “Bad news travels slowly: size, analyst
coverage, and the profitability of momentum strategies”, Journal of Finance 55 (February),
265-295.
Hope, Ole-Kristian (2003), “Firm-level disclosures and the relative roles of cultural and legal
origin”, Journal of International Financial Management and Accounting, 14 (October), 218–
248.
Hwang, L., C. Jan, and S. Basu (1996), “Loss firms and analysts’ earnings forecast errors,”
Journal of Financial Statement Analysis, 1 (Winter): 18-31.
Itner and Larcker (1998), “Are Nonfinancial Measures Leading Indicators of Financial
Performance? An Analysis of Customer Satisfaction,” Journal of Accounting Research, 36
(Supplement), 1–35.
Jacob, J., Lys, T. Z., and M. Neale (1999), “Expertise in forecasting performance of security
![Table 3: Correlation matrix [Coefficient & p-value]](https://thumb-eu.123doks.com/thumbv2/123doknet/2518322.52467/44.1263.104.1171.191.675/table-correlation-matrix-coefficient-amp-p-value.webp)