Real exchange rate misalignment in Algeria (1980 – 2012)
M. Mourad MADOUNI
University of Abou Bekr Belkaid, Tlemcen- Algeria [email protected]
1980
-2012
- Received:01 Aug 2014 Accepted: 19 Mar 2015 Published: 30 June 2015
Abstract:
The purpose of this paper is to estimate the Equilibrium real exchange rate (ERER) of the Algerian Dinar, from 1980 to 2012 by applying the Edward’s model (1989) and Elbadawi (1994) and asses the degree of misalignment. We will use a co-integration method in order to see whether there is a long run relationship between the ERER and its fundamentals such as: terms of trade, import tariffs or openness and for the adjustment in the short run the Error Correction Model (ECM) is used. Our findings are an increase in the oil prices or an improvement in terms of trade of one percent is associated with an appreciation of the REER of about 1,56 %. A decline in openness of one percent appreciates of the REER about 0,8%.
Keywords: Equilibrium real exchange rate, misalignment, Algerian Dinar. (JEL) Classification : F 31, F37. : ERER 1980 -2012 edwards 1989 Elbadawi 1994 ERER ﮫﺗﺎﯿﺳﺎﺳأ ECM REER 1،56 ٪ REER 0،8 ٪ . jel F31 F37
Real exchange rate misalignment in Algeria (1980 – 2012)
Introduction:
The real exchange rate misalignment remains one of the most important problems in the exchange rate policy. Consistent misalignment causes many serious macroeconomic discrepancies (inflationary pressures, drop in the international reserves, undermine the international competitiveness, and hinder the economic growth, even financial crisis). It is why the policy makers want to keep the real exchange rate close to its equilibrium in order to avoid its negative consequences.
Montiel (1999), Edwards (1989), Elbadawi (1994), Razin (1999) and Baffes (1997) define the misalignment as a sustained departure of the actual real exchange rate from its equilibrium value. Even if the misalignment is negative or positive, it generates incorrect signals to the economic agents and instability.
When the Real exchange rate is under the equilibrium value, it means an undervaluation of the RER. In this situation, there will be a profitable position of exportable goods and decrease of importable goods thus implied an inflationary pressures and unemployment (Brazil in 1980s). In the other side, if the RER is above its equilibrium value means an overvaluation. A decline in the current account will be caused and drain of the international reserves.
In addition, we can distinguish between two kinds of misalignment Edward (1987) [1]: The first one is called macroeconomic induced misalignment appears when, due to inconsistence between macroeconomic policies (monetary and fiscal policy) and the official exchange rate regime, the actual real exchange rate deviates from its equilibrium.
The second is the structural misalignment occurs when there are changes in the real determinants of the ERER that are not transformed in the short run into actual changes of RER.
In the light of the importance of misalignment and in the spirit of the seminal work of Edwards (1989) and Elbadawi (1994), we will assess the degree of misalignment of the Algerian real exchange rate by using the cointegration of Johanson.and the Error Correction Model for the adjustment in the short run.
The rest of this paper is organized as follows: the literature review of equilibrium real exchange rate is presented in section two. Section three exposes the empirical evidence. Section four explains the Edward’s model. Section five introduces the empirical framework, data of the fundamentals and results. Finally, section six concludes.
I. Literature review :
The well known theory of Purchasing Power Parity (PPP) developed by Cassel (1923) is the simplest and the widely used approach of the exchange rate determination. It relies on the Law of one price LPU and built upon a perfect market arbitrage. This basic model had obtained inconsistence results in developing countries because the PPP approach assumes that Real exchange rate remains stable in the long run.
In addition, there are some traditional theories of exchange rate determination: elasticity approach, monetary approach, interest rate parity (Keynes), and Portfolio balance. Dornbush’s model (1976) explains the volatility in the short run of the real exchange rate.
And other theories: Coudert‘s model (1999) which based on the Samuelson effect and the debt to determine the equilibrium exchange rate. Cashin et al. (2003) developed a long-run
equilibrium exchange rate for commodity exporting countries and found that the real commodity prices and the real exchange rate move together in the long run. Also, Montiel and Ostry (1993) proposed a model based on the parallel market premium, but they considered that this former as unreliable indicator of the sign and magnitude of real exchange rate misalignment.
However, there are some modern theories of exchange rate determination such as: FEER, NATREX, BEER and Edward’s model.
First the Fundamental Equilibrium Exchange Rate FEER, developed by Willialmson (1994), is the rate that is expected to generate a current account balance equal to the underlying capital flows over the cycle without trade restrictions, the internal equilibrium being realized.
Second, The NATural Real EXchange rate NATREX, developed by Stein (1995), is the rate that generates a current account balance which corresponds to equilibrium between optimal investment and saving while the rate of unemployment is at its natural level (Friedman).
Third, the Behavioral Equilibrium exchange rate BEER, is developed by (Clark and MacDonald 1998, 2000). The BEER calculates the rate that is determined during the long run relationship between the exchange rate and its determinants: interest rate differential, terms of trade, differential productivity, net foreign assets and government debt.
Finally, Sebastian Edawrds (1987, 1989, 1992, and 1994) presented a seminal work to determine the equilibrium exchange rate in developing countries. He defined the equilibrium real exchange rate as the relative price of tradable with respect to non-tradable goods that results in simultaneous attainment of equilibrium in the external and domestic sector in the economy.
Edwards’s model allows for both real and nominal factors to play a role in the short run, but only real factors (fundamentals) have an effect on the ERER in the long run. Elbadawi (1994) adopts the concept of ERER and uses the co-integration technique to estimate it for Chile, Ghana and India. Between the period 1965 to 1990.
II. Empirical evidence
Many studies have been conducted on the Algerian exchange rate problems (the real exchange rate misalignment), on MENA countries and some developing countries.
KORANCHELIAN T. (2005), by applying the Cashin et al. model (2003), defines the ERER as a function of relative productivities between tradable to non-tradable goods as well as the terms of trade (composed mainly by the hydrocarbon sector revenue) and assesses the degree of misalignment. His finding is that RER was substantially overvalued between1983 to 1992 and returns close to its equilibrium in the 2002-2003.
The IMF[2] staff (2012) uses the methodology of CGER [3] [4] in order to estimate the equilibrium real exchange rate of Algeria. They found that the REER was determined by terms of trade, the differential of output per worker in Algeria vis-à-vis trade partners (productivity) and government spending. The analysis suggests that the REER was overvalued between (1984-2002) and in line the equilibrium level after 2010.
Achy Lahcen (2001) estimated an ERER for five MENA countries namely: Algeria, Morocco, Tunisia, Egypt and Turkey from the period of 1985 to 1997. By applying the Edwards’s model (1989, 1994) and Elbadawi (1994), he uses a co-integration method to see whether there is a long run relationship between the REER and the fundamentals. According to the results of his research, the five MENA countries exhibited an overvaluation of their REER. Especially for
Real exchange rate misalignment in Algeria (1980 – 2012)
Algeria, after 1987 there was a substantial overvaluation due to worsening in the terms of trade (sharp drop of the oil sector’s income in 1986) also the fiscal deficit which was financed by money creation resulted in an overvaluation of RER of about 66% in 1989 and 56% in 1990. An improvement in the oil sector remains the RER at 6% in 1997.
Mongardini J. (1998) estimates an equilibrium real exchange rate for Egypt by using the Edwards’s model from 1989-1996. His findings consists an overvaluation all along the line. The real exchange rate of the Egyptian Pound has reached a peak of 35% in 1989 and RER decline to be closer to its equilibrium in 1995.
HASANOV F. (2009) estimated the ERER by using several methods: Purchasing Power Parity (PPP) Macroeconomic Balance MB, BEER and Permanent real exchange rate. He found that relative productivity, trade openness, Net foreign asset, government expenditures, and oil prices are the main determinants of misalignment.
Fatma Merrakch charfi (2008) estimates an ERER for Tunisia and assesses the degree of misalignment by using the Edward’s model and utilizes the co-integration method to see if there is a long run relationship between the REER and its fundamentals. She found that the REER was overvalued between1989 to 1997.
Some studies about other developing countries are exposed in follows:
Baffes et al. (1997) for Côte d’Ivoire, Burkina Faso, Aron, Elbadawi and Khan (1997) for South Africa, MacDonald and Ricci (2003) for South Africa, Elbadawi and Soto (1997) Chile. Mathisen (2003) for Malawi. Alper and Saglam (2000) and Sengul et al (2012) for Turkey.
All of them use the co-integration method (Johanson) to estimate the ERER path and derive the degree of misalignment. All the countries were characterized by significant overvaluation of their currency and that this overvaluation had a cost in terms of exports competitiveness.
III. The Edwards model
In the light of many studies, Montiel (1993, 1999), Edward (1987, 1989), Elbadawi (1994), the equilibrium real exchange rate is defined as the relative price of tradable to non tradable goods TCR = Pt / Pnt (1)
Pn: represents the price of tradable goods. Pnt: represents the price of non-tradable goods.
The real exchange rate is defined as the relative price of tradable with respect to non-tradable goods which provides a simultaneous internal and external balance (equilibrium).
The internal equilibrium is defined as meaning that the non tradable goods market clears in the current period and is expected to be in equilibrium in the future period.
On the other side, external equilibrium means that the current balance (present and future) are compatible with the long run sustainable capital flows.
There are three goods: exportable, importable and non tradable goods. This economy is supposed to be small; open. It produces exportable, non-tradable goods at the same time consumes importable and non-tradable goods. The government consumes both importable and non-tradable goods. There is tariff on imports. It is assumed that the price of exportable in terms of foreign currency is fixed and equal to unity. (P*x=1)
Pm = E P*m + µ e m = Pm / Pn em = (E P*m + µ) / Pn. (2)
ex = Px / Pn ex = E / Pn. (3)
e* = (E P*m) / Pn. (4)
Cm = Cm (em, Y) with (ɚCm / ɚem) < 0 and (ɚCm / ɚY) > 0 (5) Cn = Cn (em, Y) with (ɚCn / ɚem) > 0 and (ɚCm / ɚY) > 0 (6)
Supply side :
Qx = Qx (ex, ρ) with ( ɚQx / ɚex) > 0 and (ɚQx / ɚρ) > 0 (7) Qn = Qn (ex, ρ) with (ɚQn / ɚex) < 0 and (ɚQn / ɚρ) < 0 (8)
Equations (5) through (8) summarize both demand and supply. When, em and ex is the domestic relative price of importable and exportable goods
Naturally, em is the relevant price for consumption and production decisions. The function of demand depends on non-tradable goods N and on the level of real assets. On the other side, supply function depends on the relative price of exportables to non-tradables and on the relative productivity.
In the external sector:
CA = Qx (ex) – P*m Cm (em, Y) – i*NFA – Gt (9)
R= CA + NFA = 0 (10)
Equation (9) defines the current account as the difference between output of Qx and total (private and public) consumption of importable goods and the payment of the interest debt.
Finally, the system will be in equilibrium if the non-tradable sector clears and the external sector is in equilibrium.
1. Cn (em, Y) + Gn = Qn (ex, ρ) (11) 2. R = CA + NFA = 0 The external is sustainable. (12) So, the equilibrium real exchange rate is defined as follow:
e = f (P*m, µ, NFA, Gt, Gn, Y, ρ) (13)
1. Import tariff, terms of trade and equilibrium real exchange rate[5]:
A decrease of import tariffs or an improvement in the terms of trade has a same impact on the equilibrium real exchange rate.
First, the income effect: a positive shock on the terms of trade improves the trade balance and results in a higher demand for non tradable goods, and an appreciation of the real exchange rate takes place.
Second, the substitution effect: a positive shock of terms of trade or a decrease on import tariffs lets the price of importable goods lower than non-tradable goods. So, the real exchange rate depreciates.
However, increases in tariffs or deterioration on terms of trade appreciate the REER whether the substitution effect prevails.
Real exchange rate misalignment in Algeria (1980 – 2012)
2. Net capital flows:
Empirical evidence tends to support that when the capital flows moves into the country it generates an appreciation of the real exchange rate.
3. Government consumption:
An increase in the government consumption of non tradable goods will result in an equilibrium real exchange rate appreciation.
4. The relative productivity (technological progress):
The technological progress can be presented in two forms:
A) “Product augmenting” or “income augmenting” results in an increase in real income and tends to an appreciation of the real exchange rate.
B) “Factor augmenting” consider an increase in production with the same capacity in the economy results in a reduction in the price of non tradable goods and the depreciation takes place.
IV. The empirical framework 1. Data
Rert = β0 + β1 tott + β2 opent + ɛt
LnREER [6]: real effective exchange rate Real effective exchange rate is the nominal
effective exchange rate (a measure of the value of a currency against a weighted average of several foreign currencies) divided by a price deflator or index of costs, in logarithmic terms. Data are extracted from the World Bank, World development indicator 2012.
TOT: terms of trade [7] is the world crude oil price divided by the CPI. US. Data are
extracted from the CNUCED, UNCTADstat 2012.
LnOpenn: is the sum of exports and imports divided by GDP, in logarithmic terms, Cnuced
UNCTAD stat 2012.
Table 1: Data and series construction
Variables Data construction Data source
Real effective exchange rate (REER) Ln(REER) WDI 2012, IFS IMF Terms of trade (tot) (TOT)=Oil/Cpi US CNUCED, WDI 2012 Openness (open) Ln(OPEN)= (X+M/GDP) CNUCED 2012
Source: World Bank 2012, IFS IMF, CNUCED UNCTAD stat 2012.
Table 2: Statistics for ADF and PP unit root tests
ADF Phillips-Perron
Variables Intercept Trend & intercept None Intercept Trend & intercept None
LnREER -1,3164 - 1,1462 -1,6008 -0,9663 -1,5352 -1,4464 ▲LnREER -4,1830*** -4,0471** -3,9610*** -1,1830*** -1,1008** -3,8910*** LnTOT -1,1439 -1,7728 -0,4233 -1,2509 -1,6603 -0,4352 ▲LnTOT -6,0021*** -5,8755*** -6,0910*** -5,9879*** -12,1945*** -0,0727*** LnOpen -1,1477 -2,3998 -0,0174 -1,3939 -2,4551 0,0355 ▲LnOpen -4,0988*** -4,1360*** -4,1685*** -4,1031*** 4,1454** -4,1727***
The dataset consists of annual data from 1980 to 2012 (33 observations)[8]. The ADF and Phillips-Perron tests indicate that the nonstationarity hypothesis cannot be rejected in level for all variables. However, for the first difference, the hypothesis of nonstationarity is rejected at the level of 5 percent for all variables. So, it suggests that the variables (LnREER, TOT, LnOPEN)) are integrated of order one I(I). (Table 2)
We exclude government consumption [9] and technological progress variables in order to have a consistent result because the number of observation is limited. The capital flow is not significant for the Algeria case.
The econometric analysis confirms the existence of a cointegration relationship between the REER, terms of trade and openess.
The Engel-Granger (1987) and Johansen (1995) maximum likelihood procedures are used to determine the number of cointegrating vectors among the variables. Trace and Max-eigenvalue tests indicate two conintegrating equations at the level of 5 % (Table 3 A. B).
Table 3 A: Statistics for Cointegration results (Trace)
No. of CE(s) Trace stat critical values 0,05 Prob
None 63,65 29,79 0,0000
At most 1 25,61 15,49 0,0011
At most 2 7,319 3,841 0,0068
Table 3 B: Statistics for Cointegration results (Max eigenvalue)
No. of CE(s) Max eigen Stat
0,05
critical values Prob
None 38,03 21,13 0,0001
At most 1 18,29 14,26 0,0109
At most 2 7,319 3,841 0,0068
So, the estimated long run real exchange rate equilibrium equation takes the following form: LnREER = 1,56 LnTOT – 0,8 LnOPEN + 7,58
An increase on the oil prices, in other words an improvements on terms of trade of 1% is associated with an appreciation of the REER of about 1,56 % [10].
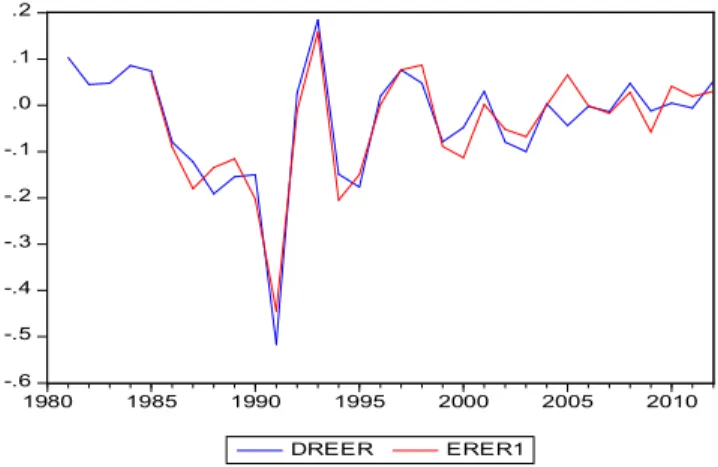
-.6 -.5 -.4 -.3 -.2 -.1 .0 .1 .2 1980 1985 1990 1995 2000 2005 2010 DREER ERER1
Real exchange rate misalignment in Algeria (1980 – 2012)
A decline in openness of 1 percent is associated with an appreciation of the REER about 0,8%.
Whenever the REER deviates from its equilibrium value, it reverts to its equilibrium level in the absence of shocks. The parameter of the cointegration vector is 0,34 implies that the half-life speed (HLS) of dissipation of a unit impulse is 1,68 years[11].
Finally [12], we find that the REER was overvalued after 1986 due to a sharp decline in the oil prices. In 1994, the REER was also overvalued after the implantations of the adjustment program by the IMF. In 2002, the REER was undervalued but overvalued between 2003 to 2006. The REER is broadly close to its equilibrium value by the end 2010.
V. Conclusion and recommendations:
According to the main results of this paper, the REER movement is explained by fundamentals variables such as: terms of trade and the degree of openness of the Algerian economy or in other terms the reduction of the tariffs trade (Edwards 1988,1989), (Elbadawi 1994). An improvement in terms of trade or the rising in the oil prices and the increase in tariffs trade lead to an appreciation of REER. The deviations of the REER from its equilibrium value are adjusted in about 20 months.
Our findings suggest that the REER was substantially overvalued after 1995, 2002, and 2004 but after that the Algerian REER is broadly in line with its fundamentals and close to the equilibrium level.
Given the large share of hydrocarbon exports and representing mainly the whole part of the government revenue, the Algerian economy remains very vulnerable to a decline in the world oil prices (IMF 2011, 2012). In addition, the large part of import of foods and with its increasing world prices is another source of vulnerability.
So, the Algerian authority must implement a new program in order to encourage private investment for boosting non hydrocarbon growth and take aware from the appreciation of REER caused by the improvement of the oil prices (Dutch disease) which undermine the export diversification efforts. And intensify trade relations with neighbor countries.
Appendix 4.4 4.8 5.2 5.6 6.0 6.4 1980 1985 1990 1995 2000 2005 2010 LNREER 0.1 0.2 0.3 0.4 0.5 0.6 0.7 0.8 0.9 1.0 1980 1985 1990 1995 2000 2005 2010 OIL 3.2 3.4 3.6 3.8 4.0 4.2 4.4 1980 1985 1990 1995 2000 2005 2010 LNOPEN
Real exchange rate misalignment in Algeria (1980 – 2012)
Referrals and references
Notes
[1] Cf. Edwards, S. (1987). “Exchange rate misalignment in developing countries”, Discussion paper number 442 and National Bureau of Economic Research.
[2] IMF country report N 13/47 of Algeria. P.37 [3] The Consultative group on exchange rate issues.
[4] According to the CGER, the misalignment is defined as the real exchange rate adjustment that would close the gap between the estimated “current account norm” and the underlying current account.
[5] Elbadawi (1994) , replaces tariff rates with variable of openness which can take into account “implicit” trade restrictions (such as quotas and excgange rate controls).
[6] An increase in the REER is equivalent to real appreciation.
[7] See Cashin et al. (2003) and Sorsa, P., (1999). “Algeria-The real exchange rate, export diversification and trade protection” IMF Working paper WP/99/49.
[8] These procedures will provide better results for larger number of observations. [9] Loko. Et al. (2007)
[10] T. Korancheliane (2005) found that the oil prices affect the Algerian REER of about 0, 24%.
[11] The time T require to dissipate x percent (in this case 50%) of a shock is determined according to (1-θ)T=(1-X), where θ is the coefficient of the error correction term and T is the required numbered periods (years).
[12] The result of this analysis should be treated with some caution, given the existence of parallel market premium (about 32% at end-2012) IMF (2012).
Bibliography
Achy, L. (2001), “Equilibrium exchange rate and misalignment in selected MENA countries”, INSEA. MPRA paper n° 4799.
Alper, E. and Saglam. I, (2000),“ The equilibrium real exchange rate : evidence from turkey”, Topics in middle eastern and north African economies 2.Aron, J. Elbadawi, I. Khan, B. (1997), “Determinants of the real exchange rate in South Africa,” WPS/97/16 in
http://www.csae.ox.ac.uk/resprogs/smmsae/pdfs/smmsae-2002-13.pdf
Baffes, J., Elbadawi, I. and O’connell, S. A. (1997). “Single-Equation of the equilibrium real exchange rate”,
http://wwwwds.worldbank.org/external/default/WDSContentServer/WDSP/IB/2000/02/24/000009265_3971023104048/additional/101501322_20041 117170002.pdf
Cahin, P., Céspedes. F. and Sahay. R. (2003). “Commodity currencies and the real exchange rate”. Central bank of chilie Working paper N 236. Dickey, D.A. and W.A. Fuller (1979). “Distribution of the Estimators for Autoregressive Time Series with a Unit Root,” Journal of the American
Statistical Association, 74, 427–431.
Edwards, S. (1987). “Exchange rate misalignment in developing countries”, Discussion paper number 442 and National Bureau of Economic Research.
Edwards, S. (1988). “Real and monetary determinants of real exchange behavior: theory and evidence from developing countries”, UCLA working paper Number 506 and National Bureau of Economic Research.
Elbadawi, I. and R. Soto (1994), “Capital Flows and Equilibrium Real Exchange Rates in Chile,” Policy Research Working Paper 1306, The World Bank, Washington DC.
Engle, Robert F. and C. W. J. Granger (1987). “Co-integration and Error Correction: Representation, Estimation, and Testing,” Econometrica, 55, 251–276.
Hasanov, F. Huseynov, F. (2009). “Real exchange rate misalignment in Azerbaijan”. SSRN working paper N° 2250501.
Hinkle L. E. and P. J. Montiel ed. (1999), “Exchange rate misalignment, Concepts and measurement for developing countries”, A World Bank Research Publication, Oxford University Press.
IMF country report N°13/47 of Algeria.
Johansen, Søren (1995). “Likelihood-based Inference in Cointegrated Vector Autoregressive Models”, Oxford University Press.
Koranchelian, T. (2006), “The equilibrium real exchange rate in a commodity exporting country: Algeria’s experience”, IMF working paper WP/05/135.
Loko. B., Kpolar. K. and Diallo. O. (2007). “Buoyant capital spending and worries over real appreciation: cold facts from Algeria”. IMF working paper WP/07/286.
MacDonald, D. Ricci, L. (2003) “Estimation of the equilibrium real exchange rate of South Africa,” IMF Working paper WP/03/44.
Macdonald, R. (2000), “Concepts to Calculate Equilibrium Exchange Rates: An Overview”, Discussion paper 3/00, Economic Research Group of the Deutsche Bundesbank.
Mathisen, J. (2003). “Estimation of the equilibrium real exchange rate for Malawi,” IMF working paper WP/03/104.
Merrakchi F, C (2008) “Taux de change réel d’équilibre : enseignement d’un modèle VAR-ECM pour le cas de la Tunisie” Panoeconomecus, 2008, str, 439-464.
Mongardini, J., (1998), “Estimating Egypt’sequilibrium exchange rate”. IMF Working papper WP/98/5. Montiel. P., (2003). “Macroeconomics in Emerging markets” Cambridge University Press.
Montiel, P. J., and Ostry, J., (1993), “Is the parallel market premium a reliable indicator of real exchange rate misalignment in developing
countries?”IMF Working paper WP/93/70.
Phillips, P. C. B. and P. Perron (1988). “Testing for a Unit Root in Time Series Regression,” Biometrika, 75, 335–346.
Sengul, D. Ayla O. B. and Niloufer, S. (2012). “Misalignment under different exchange rate regimes: the case of Turkey”, International Economics 130, p.81-98.
Sorsa, P., (1999). “Algeria-The real exchange rate, export diversification and trade protection” IMF Working paper WP/99/49.