0099-2240/04/$08.00
⫹0 DOI: 10.1128/AEM.70.12.7161–7172.2004
Copyright © 2004, American Society for Microbiology. All Rights Reserved.
Development of a Universal Microarray Based on the Ligation
Detection Reaction and 16S rRNA Gene Polymorphism To
Target Diversity of Cyanobacteria
Bianca Castiglioni,
1Ermanno Rizzi,
2Andrea Frosini,
3Kaarina Sivonen,
4Pirjo Rajaniemi,
4Anne Rantala,
4Maria Angela Mugnai,
5Stefano Ventura,
5Annick Wilmotte,
6Christophe Boutte,
6Stana Grubisic,
6Pierre Balthasart,
6Clarissa Consolandi,
3Roberta Bordoni,
2Alessandra Mezzelani,
2Cristina Battaglia,
3and Gianluca De Bellis
2*
Institute of Agricultural Biology and Biotechnology, Italian National Research Council, Milan,
1Institute of Biomedical
Technologies, Italian National Research Council,
2and Department of Biomedical Sciences and Technology, University
of Milan,
3Segrate, and Institute of Ecosystem Study, Section of Florence, Italian National Research Council,
Sesto Fiorentino,
5Italy; Department of Applied Chemistry and Microbiology, Viikki Biocenter, University
of Helsinki, Helsinki, Finland
4; and Center for Protein Engineering, Institute of
Chemistry, University of Liege, Liege, Belgium
6Received 6 April 2004/Accepted 3 August 2004
The cyanobacteria are photosynthetic prokaryotes of significant ecological and biotechnological interest,
since they strongly contribute to primary production and are a rich source of bioactive compounds. In
eutrophic fresh and brackish waters, their mass occurrences (water blooms) are often toxic and constitute a
high potential risk for human health. Therefore, rapid and reliable identification of cyanobacterial species in
complex environmental samples is important. Here we describe the development and validation of a microarray
for the identification of cyanobacteria in aquatic environments. Our approach is based on the use of a ligation
detection reaction coupled to a universal array. Probes were designed for detecting 19 cyanobacterial groups
including Anabaena/Aphanizomenon, Calothrix, Cylindrospermopsis, Cylindrospermum, Gloeothece, halotolerants,
Leptolyngbya, Palau Lyngbya, Microcystis, Nodularia, Nostoc, Planktothrix, Antarctic Phormidium,
Prochlorococ-cus, Spirulina, SynechococProchlorococ-cus, Synechocystis, Trichodesmium, and Woronichinia. These groups were identified
based on an alignment of over 300 cyanobacterial 16S rRNA sequences. For validation of the microarrays, 95
samples (24 axenic strains from culture collections, 27 isolated strains, and 44 cloned fragments recovered
from environmental samples) were tested. The results demonstrated a high discriminative power and
sensi-tivity to 1 fmol of the PCR-amplified 16S rRNA gene. Accurate identification of target strains was also achieved
with unbalanced mixes of PCR amplicons from different cyanobacteria and an environmental sample. Our
universal array method shows great potential for rapid and reliable identification of cyanobacteria. It can be
easily adapted to future development and could thus be applied both in research and environmental
monitoring.
The cyanobacteria are photosynthetic prokaryotes that form
a monophyletic group among the eubacteria (29). They are
primary producers (3) and a rich source of bioactive
com-pounds (1), and thus, they are ecologically and
biotechnologi-cally significant organisms. The cyanobacteria are distributed
over a wide range of habitats. In eutrophic fresh and brackish
waters, cyanobacteria frequently form toxic water blooms (23)
that constitute high potential risks for animal and human
health (13).
Traditionally, the identification of cyanobacteria has relied
on morphological, physiological, and ecological characteristics
that can vary under different environmental or growth
condi-tions (3). Currently, the classification of cyanobacteria is based
on a polyphasic approach that considers different phenotypic
and genotypic features (29, 30). The molecular classification of
cyanobacteria is based on 16S rRNA gene sequences obtained
from pure cultures (30). Using this molecular information,
several techniques can be employed to determine the
cya-nobacterial composition of an environmental sample. One of
the most informative methods is based on amplification,
clon-ing, sequencclon-ing, and phylogenetic reconstruction based on the
entire 16S rRNA gene (8, 10). This strategy is very
time-consuming and is therefore not suitable for large-scale
screen-ings. Denaturing gradient gel electrophoresis (DGGE) and
temperature gradient gel electrophoresis have been widely
ap-plied to molecular ecological research (18). However, band
excision, reamplification, and sequencing are necessary to
identify community members.
Therefore, new approaches to the genetic analysis of
com-plex cyanobacterial communities are needed. Recently,
oligo-nucleotide microarrays (microchips) have been used widely in
molecular biological studies and have shown great potential for
environmental diagnostics. DNA microarray technology has
already been applied for the detection of microbial diversity.
Microarrays were used for analysis of cultured nitrifying
bac-* Corresponding author. Mailing address: Istituto di Tecnologie
Biomediche, Consiglio Nazionale delle Ricerche, Via Cervi 93, 20090
Segrate (Mi), Italy. Phone: 39 02 26422764. Fax: 39 02 26422770.
E-mail: [email protected].
teria (11) and for the direct detection of 16S rRNA in
unpu-rified soil extracts (24), indicating their applicability for
envi-ronmental studies. Loy and coworkers (15) and Wu and
coworkers (32) tested the microarray method for actual
envi-ronmental samples, the former for sulfate-reducing
pro-karyotes and the latter for functional genes of the nitrogen
cycle. An oligonucleotide microarray method was also
devel-oped for the detection of 20 predominant human intestinal
FIG. 1. Main features of LDR method coupled with a universal microarray. After hybridization of a discriminating probe and a common probe
to the target sequence (16S rRNA gene), ligation occurs only if there is perfect complementarity between the two probes and the template (A).
The reaction is thermally cycled, generating single-stranded DNA fragments bearing a 5
⬘ Cy3 fluorescent moiety and a 3⬘ czip code sequence. The
cycling allows more common probe (and the corresponding czip code) to ligate to the discriminating probe, given a fixed amount of PCR target.
(B) The LDR product is hybridized to a universal microarray, where unique zip code sequences have been spotted.
bacterial species (28). Wilson and coworkers (31) used a
method based on Affymetrix GeneChip technology to study
pure bacterial cultures.
The use of microarrays to specifically characterize
cyanobac-terial diversity is quite recent. Rudi and coworkers (21)
de-signed a small cyanobacterium-specific microarray for the
gen-era Microcystis, Planktothrix, Anabaena, Aphanizomenon,
Nostoc, and Phormidium. Using this assay, the compositions of
cyanobacteria in eight lake communities were determined. The
DNA microarray and the magnetic-capture hybridization
tech-nique have been combined to form a new technology named
MAG microarray. Bacterial magnetic particles on a MAG
mi-croarray were used for the identification of cyanobacterial
DNA (17). Genus-specific oligonucleotide probes for the
de-tection of Anabaena spp., Microcystis spp., Nostoc spp.,
Oscil-latoria spp., and Synechococcus spp. have been designed from
the variable region of the cyanobacterial 16S rRNA gene of
148 strains. All five cyanobacterial genera were successfully
discriminated by using both axenic strains and unknown
cul-tured cyanobacteria.
We applied a universal DNA array method to discriminate
some groups of bacteria (2). This procedure is based on the
discriminative properties of the DNA ligation detection
reac-tion (LDR) and requires two probes specific for each target
sequence, as described by Gerry et al. (7). A fluorescent label
is coupled to one of the probes, and a complementary zip code
TABLE 1. Cyanobacterial strains used to validate the LDR procedure
Group Strain Geographic origin
Anabaena/Aphanizomenon
Anabaena cylindrica PCC 7122
Pond water, Cambridge, England
Anabaena sp. strain PCC 73105
Pond water, Cambridge, England
Anabaena sp. strain PCC 7108
Intertidal zone, Moss Beach, Calif.
Anabaena sp. strain 90
Lake Vesija
¨rvi, Lahti, Finland
Anabaena sp. strain 202A1
Lake Vesija
¨rvi, Lahti, Finland
Aphanizomenon sp. strain 202
Lake Vesija
¨rvi, Lahti, Finland
Aphanizomenon sp. strain PCC 7905
Lake Brielse Meer, The Netherlands
Nostoc
Nostoc sp. strain PCC 7107
Shallow pond, Point Reyes, Calif.
Nostoc sp. strain PCC 8114
Water bloom, Lake Hepetcon, Morris Co., N.J.
Nostoc punctiforme Hegewald 1971-108
Fish pond, Babat, Hungary
Nostoc linckia Hegewald 1971-144
Fish pond, Szeged, Feher-to
´, Hungary
Nostoc sp. strain 152
Lake Sa
¨aksja
¨rvi, Iitti, Finland
Microcystis
Microcystis aeruginosa PCC 9354
Little Rideau Lake, Ontario, Canada
Microcystis sp. strain PCC 7005
Lake Mendota, Wis.
Microcystis aeruginosa 1BB38S07
Bubano Basin, Imola, Italy
Microcystis aeruginosa 0BF29S03
Finissaggio Basin, Imola, Italy
Microcystis sp. strain 0BB35S01
Bubano Basin, Imola, Italy
Microcystis ichthyoblabe 0BB39S02
Bubano Basin, Imola, Italy
Microcystis wesenbergii NIES104
Freshwater lake, Chiyoda-ku, Tokyo, Japan
Synechococcus
Synechococcus sp. strain Hegewald 1974-30
Lake Kuusja
¨rvi, Saukkolahti, Finland
Synechococcus sp. strain 0BB26S03
Bubano Basin, Imola, Italy
Synechococcus sp. strain WH 7803
Sargasso Sea
Synechococcus sp. strain WH 8103
Sargasso Sea
Synechococcus sp. strain 0BB42S04
Bubano Basin, Imola, Italy
Prochlorococcus marinus
Prochlorococcus marinus SS120
Sargasso Sea
Prochlorococcus marinus PCC 9511
Mediterranean Sea
Planktothrix
Planktothrix sp. strain 1LT27S08
Trasimeno Lake, Italy
Planktothrix sp. strain 2
Lake Markusbo
¨lefja
¨rden, Åland Islands, Finland
Planktothrix sp. strain 28
Lake Markusbo
¨lefja
¨rden, Åland Islands, Finland
Planktothrix sp. strain NIVA-CYA 126
Lake La
¨ngsjo
¨n, Åland Islands, Finland
Oscillatoria amphibia AGARDH Bai 1971-60
Pond Kakasszeg-to
´, Hungary
Spirulina
Spirulina major PCC 6313
Brackish water, Berkeley, Calif.
Spirulina major 0BB22S09
Bubano Basin, Imola, Italy
Spirulina major 0BB36S18
Bubano Basin, Imola, Italy
Halotolerants
Cyanothece sp. strain PCC 7418
Solar Lake, Israel
Nodularia
Nodularia sp. strain PCC 73104/1
Alkaline soil, Spotted Lake, British Columbia, Canada
Nodularia sp. strain BY1
Baltic Sea
Nodularia sp. strain NSPI-05
Coastal water, Peel Inlet, Australia
Nodularia sp. strain HKVV
Baltic Sea
Nodularia sp. strain NSOR-12
Coastal water, Oriental Lagoon, Tasmania, Australia
Cylindrospermum
Cylindrospermum stagnale PCC 7417
Soil, greenhouse, Stockholm, Sweden
Synechocystis
Synechocystis sp. strain PCC 6905
Low-salinity brine pond, Newark, Calif.
Synechocystis sp. strain PCC 7008
Shallow pond, Point Reyes Peninsula, Calif.
Calothrix
Calothrix sp. strain PCC 7714
Small pool, Aldabra Atoll, India
Calothrix marchica LEMM. Bai 1971-96.
Pond Belso
¨-to
´, Tihany, Hungary
Leptolyngbya
Leptolyngbya sp. strain 0BB24S04
Bubano Basin, Imola, Italy
Leptolyngbya sp. strain 0BB30S02
Bubano Basin, Imola, Italy
Leptolyngbya sp. strain 0BB19S12
Bubano Basin, Imola, Italy
Leptolyngbya sp. strain 0BB32S02
Bubano Basin, Imola, Italy
Leptolyngbya sp. strain SCHMIDLE Bai 1971-66
Fish pond, Szeged, Feher-to
´, Hungary
(czip code) is coupled to the other. When the proper template
is present, the two probes are ligated by the activity of a DNA
ligase and are hybridized to the microarray spot that contains
the corresponding zip code (Fig. 1). Such an array is called
universal, because these zip code pairs could be used with any
other probe set.
Here we present the universal DNA array method applied to
the detection of cyanobacterial diversity. We designed probes
specific for 19 different cyanobacterial groups identified from a
phylogenetic tree built with the ARB program (16). The
mi-croarrays were validated with axenic and nonaxenic strains of
cyanobacteria and an environmental sample.
MATERIALS AND METHODS
All chemicals and solvents were purchased from Sigma-Aldrich (Milan, Italy) and used without further purification. The oligonucleotides were purchased from Thermo Electron GmbH (Ulm, Germany).
DNA samples.The samples used to validate the probes included axenic strains
kept in our culture collections, strains isolated from European lakes and a reservoir during this study (Table 1), and clones of environmental DNA libraries obtained from Lake Esch-sur-Suˆre (Luxembourg) and Lake Tuusulanja¨rvi (Fin-land) (Table 2). The 16S rRNA gene of the cultured strains and clones was sequenced (unpublished data). In addition, the array was tested with an envi-ronmental DNA sample (Lake Tuusulanja¨rvi), which was isolated by the hot-phenol method (9). To verify the microarray results, the same environmental sample was analyzed by DGGE and cloning of the 16S rRNA gene.
Ligation probe design.For the LDR, we designed specific probes for the 16S
rRNA gene sequences of 19 different cyanobacterial groups. These groups were identified by using a cyanobacterial 16S rRNA gene alignment built with ARB software, version Beta 011107 (16). The alignment contained 281 sequences from public databases and 57 from this study in addition to the out-group Escherichia coli. All of these sequences were longer than 1,400 bp, except the two sequences of Antarctic Phormidium (about 1,350 bp) and 21 (of 42) sequences of Prochlo-rococcus marinus (about 1,250 bp). All sequences were aligned with CLUSTAL W (26) and ARB. The sequence alignment is available upon request. The phylogenetic analysis was performed with ARB by using the neighbor-joining (NJ) algorithm (22). From the sequence alignment, group-specific consensus sequences were obtained with a cutoff percentage of 75%. If a base at a given position occurred at a lower frequency than the cutoff percentage, it was replaced by an appropriate International Union of Pure and Applied Chemistry ambiguity code in the consensus sequence. The group-specific consensus sequences were imported to GCG Omiga, version 2.0 (Oxford Molecular Ltd.), for group-specific probe design. The probes were designed by following the LDR approach. After hybridization of a discriminating probe and a common probe to the target sequence, ligation occurs only if there is perfect complementarity between the two probes and the template, in this case, an amplified fragment of the 16S rRNA gene (Fig. 1). For this reason, the discriminating probes were designed to have 3⬘ ends unique to each of the 19 cyanobacterial groups. The common probes were located immediately after the discriminating probes according to the group-specific consensus sequences. An example of selection is shown in Fig. 2. To discard potentially unspecific probe pairs, we checked each probe pair (dis-criminating probe and common probe) by using the probe match tool of the ARB program. We also designed a probe pair (named UNICYANO) to detect the presence of any cyanobacteria in the sample. No significant self-annealing of the probe sequences was detected by computer analysis (data not shown). All probes were designed to have a theoretical melting temperature (Tm) between 63 and
68°C, calculated by using the Oligonucleotide Properties Calculator program (http://www.basic.nwu.edu/biotools/oligocalc.html).
We randomly selected 21 czip code sequences from those described by Gerry et al. (7) and Chen et al. (4). These czip codes were randomly assigned to the UNICYANO probe pair, the 19 group-specific probe pairs, and a positive control for the hybridization reaction. The latter was a Cy3-labeled czip code that has its own corresponding zip code in the universal array. As a negative control for the hybridization and LDR, double-distilled water was used instead of genomic DNA as the PCR template. The discriminating probes were labeled with Cy3 at the 5⬘ end. The common probes were phosphorylated at the 5⬘ end and carried the czip code at the 3⬘ end. When a probe sequence contained an ambiguity code, this base was replaced with inosine during oligonucleotide synthesis.
Universal array preparation. The microarrays were prepared by using
CodeLink slides (Amersham Biosciences, Piscataway, N.J.), designed to co-valently immobilize amino (NH2)-modified oligonucleotides. The 5⬘ NH2
-mod-ified zip code oligonucleotides, carrying an additional poly(dA)10tail at their 5⬘
ends, were diluted to 25M in 100 mM phosphate buffer (pH 8.5). Spotting was performed by using a contact-dispensing system (MicroGrid II; BioRobotics, Huntingdon, United Kingdom). The printed slides were processed according to the manufacturer’s protocols. Eight arrays per slide were generated. Quality control of the printed surfaces was performed by sampling one slide from each deposition batch. This slide was hybridized with 1M 5⬘ Cy3-labeled poly(dT)10
in a solution containing 5⫻ SSC (1⫻ SSC is 0.15 M NaCl plus 0.015 M sodium citrate) and 0.1 mg of salmon sperm DNA/ml at room temperature for 2 h and then washed for 15 min in 1⫻ SSC. The fluorescent signal was controlled by laser scanning, as described below.
PCR amplifications from DNA samples.The 16S rRNA gene and the internal
transcribed spacer region were amplified with universal primer 16S27F (5⬘-AG AGTTTGATCMTGGCTCAG-3⬘) (6) and cyanobacterium-specific primer 23S30R (5⬘-CCTCGCCTCTGTGTGCCTAGGT-3⬘) (14, 25). The PCR ampli-fications were performed with a GeneAmp PCR system 9700 thermal cycler (Applied Biosystems, Foster City, Calif.). The reaction mixtures included 500 nM concentrations of each primer, 200M concentrations of each deoxynucleoside triphosphate, 10 mM Tris-HCl (pH 8.8), 1.5 mM MgCl2, 50 mM KCl, 0.1%
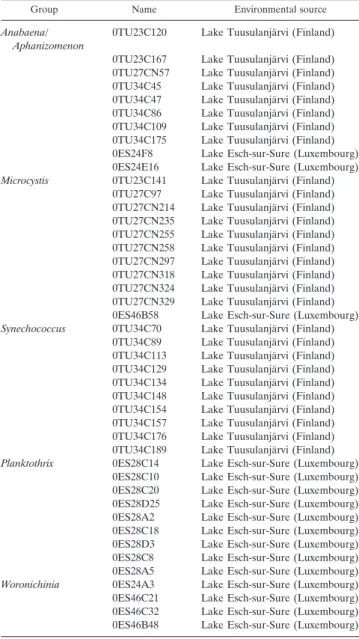
TABLE 2. Clones of 16S rRNA gene libraries obtained from
environmental samples and used for validating the LDR
Group Name Environmental source
Anabaena/ Aphanizomenon
0TU23C120 Lake Tuusulanja¨rvi (Finland)
0TU23C167 Lake Tuusulanja¨rvi (Finland) 0TU27CN57 Lake Tuusulanja¨rvi (Finland) 0TU34C45 Lake Tuusulanja¨rvi (Finland) 0TU34C47 Lake Tuusulanja¨rvi (Finland) 0TU34C86 Lake Tuusulanja¨rvi (Finland) 0TU34C109 Lake Tuusulanja¨rvi (Finland) 0TU34C175 Lake Tuusulanja¨rvi (Finland) 0ES24F8 Lake Esch-sur-Sure (Luxembourg) 0ES24E16 Lake Esch-sur-Sure (Luxembourg) Microcystis 0TU23C141 Lake Tuusulanja¨rvi (Finland)
0TU27C97 Lake Tuusulanja¨rvi (Finland) 0TU27CN214 Lake Tuusulanja¨rvi (Finland) 0TU27CN235 Lake Tuusulanja¨rvi (Finland) 0TU27CN255 Lake Tuusulanja¨rvi (Finland) 0TU27CN258 Lake Tuusulanja¨rvi (Finland) 0TU27CN297 Lake Tuusulanja¨rvi (Finland) 0TU27CN318 Lake Tuusulanja¨rvi (Finland) 0TU27CN324 Lake Tuusulanja¨rvi (Finland) 0TU27CN329 Lake Tuusulanja¨rvi (Finland) 0ES46B58 Lake Esch-sur-Sure (Luxembourg) Synechococcus 0TU34C70 Lake Tuusulanja¨rvi (Finland)
0TU34C89 Lake Tuusulanja¨rvi (Finland) 0TU34C113 Lake Tuusulanja¨rvi (Finland) 0TU34C129 Lake Tuusulanja¨rvi (Finland) 0TU34C134 Lake Tuusulanja¨rvi (Finland) 0TU34C148 Lake Tuusulanja¨rvi (Finland) 0TU34C154 Lake Tuusulanja¨rvi (Finland) 0TU34C157 Lake Tuusulanja¨rvi (Finland) 0TU34C176 Lake Tuusulanja¨rvi (Finland) 0TU34C189 Lake Tuusulanja¨rvi (Finland) Planktothrix 0ES28C14 Lake Esch-sur-Sure (Luxembourg)
0ES28C10 Lake Esch-sur-Sure (Luxembourg) 0ES28C20 Lake Esch-sur-Sure (Luxembourg) 0ES28D25 Lake Esch-sur-Sure (Luxembourg) 0ES28A2 Lake Esch-sur-Sure (Luxembourg) 0ES28C18 Lake Esch-sur-Sure (Luxembourg) 0ES28D3 Lake Esch-sur-Sure (Luxembourg) 0ES28C8 Lake Esch-sur-Sure (Luxembourg) 0ES28A5 Lake Esch-sur-Sure (Luxembourg) Woronichinia 0ES24A3 Lake Esch-sur-Sure (Luxembourg) 0ES46C21 Lake Esch-sur-Sure (Luxembourg) 0ES46C32 Lake Esch-sur-Sure (Luxembourg) 0ES46B48 Lake Esch-sur-Sure (Luxembourg)
(wt/vol) Triton X-100, 1 U of DyNAzyme DNA polymerase II (Finnzymes, Espoo, Finland), and 5 to 8 ng of genomic DNA in a final volume of 50l. Prior to amplification, the DNA was denatured for 5 min at 95°C. Amplification consisted of 30 cycles at 94°C for 45 s, 57°C for 45 s, and 72°C for 2 min. After the cycles, an extension step (10 min at 72°C) was performed. The PCR products were purified by using a GFX PCR DNA purification kit (Amersham), eluted in 50l of autoclaved water, and quantified with a BioAnalyzer 2100 (Agilent Technologies, Palo Alto, Calif.).
LDR.The LDR was carried out in a final volume of 20l containing 20 mM Tris-HCl (pH 7.5), 20 mM KCl, 10 mM MgCl2,0.1% NP-40, 0.01 mM ATP, 1
mM dithiothreitol, 250 fmol of each discriminating probe, 250 fmol of each common probe, 10 fmol of the hybridization control, and from 0.5 to 100 fmol of purified PCR products. After the reaction mixture was preheated for 2 min at 94°C and centrifuged for 1 min, 4 U of Pfu DNA ligase (Stratagene, La Jolla, Calif.) was added. The LDR was cycled for 30 rounds at 90°C for 30 s and at 60°C for 4 min in a GeneAmp PCR system 9700 thermal cycler.
Array hybridization, detection, and data analysis.The hybridization mixture
had a total volume of 65l and contained 20 l of LDR mixture, 5⫻ SSC, and 0.1 mg of salmon sperm DNA/ml. After heating at 94°C for 2 min and chilling on ice, the hybridization mixture was applied to the slide, on which the eight arrays were separated by Press-To-Seal silicone isolators (1.0⫻ 9 mm; Schleicher & Schuell BioScience, Dassel, Germany). Hybridization was carried out in a cham-ber in the dark at 65°C for 1 h in a temperature-controlled water bath. After hybridization, the slide was washed at 65°C for 15 min in prewarmed 1⫻ SSC and 0.1% sodium dodecyl sulfate. Finally, the slide was dried by spinning at 80⫻ g for 3 min. The fluorescent signals were acquired at a 5-m resolution by using a ScanArray 4000 laser-scanning system (PerkinElmer Life and Analytical Sci-ences, Boston, Mass.) with a green laser for Cy3 dye (ex, 543 nm;em, 570 nm).
Both the laser and the photomultiplier (PMT) tube power were set between 70 and 95%, depending on the signal intensities. QuantArray quantitative microar-ray analysis software (PerkinElmer) was used to quantitate the fluorescent in-tensity of the spots. The fluorescent inin-tensity values obtained from the replicated spots (four replicate spots for each group-specific probe and eight replicates for the universal probe) and replicated experiment sets (three separate LDR-uni-versal array experiments) were analyzed, and the means and standard deviations were calculated.
Concerning the method used to calculate nonspecific hybridization values, data analysis for each target was performed as follows: (i) the hybridization fluorescent intensities from nonspecific zip codes were calculated and averaged; (ii) the mean of these nonspecific hybridization values was compared with that of the expected positive zip code.
RESULTS
Sequence analysis of cyanobacterial 16S rRNA genes and
design of ligation probes.
The cyanobacterial groups identified
with ARB by using the NJ alghorithm (as described in
Mate-rials and Methods) were named after the genus designations of
their components: Anabaena/Aphanizomenon, Calothrix,
Cylin-drospermopsis, Cylindrospermum, Gloeothece, halotolerants,
Leptolyngbya, Palau Lyngbya, Microcystis, Nodularia, Nostoc,
Planktothrix, Antarctic Phormidium, P. marinus, Spirulina,
Syn-echococcus, Synechocystis, Trichodesmium, and Woronichinia
(Fig. 3). The list of strains present in each group is available
at http://www.ulg.ac.be/cingprot/midichip/output/publications
/Castiglioni_Tree.htm. For all of these, a group-specific
con-sensus sequence was determined and used for probe design.
The probes were designed to be complementary to the
poly-morphic regions of the group-specific consensus sequence
alignment. We selected 19 group-specific probe pairs and a
universal control probe matching all of the cyanobacteria. All
of the probes had theoretical melting temperatures between 63
and 68°C. Table 3 lists all of the selected group-specific and
universal probes and randomly chosen czip code sequences.
Although DNA samples for some of the 19 selected groups
(Gloeothece, Antarctic Phormidium, Trichodesmium, and
Cy-lindrospermopsis) were not available, they were included to
allow future applications of this cyanobacterial microarray.
Validation of universal array designed for cyanobacteria.
(i) Specificity of probes.
In the presence of a proper DNA
template, only group-specific spots, universal spots, and those
spots corresponding to the hybridization control showed
pos-itive signals. Several examples of the results are shown in Fig.
4. The specificity of the probes for freshwater cyanobacterial
groups was tested by using PCR-amplified 16S rRNA genes
originating either from 52 cyanobacterial strains (both axenic
and isolated in this study) or from 44 clones. Three replicated
LDR-universal array experiments showed good reproducibility
of the results.
The intensities of signals of nonspecific hybridization for the
cyanobacterial groups examined never exceeded 6% with
re-spect to the expected positive signals (Table 4), and this value
FIG. 2. Partial alignment of group-specific consensus sequences and an example of probe selection for Microcystis. The discriminating probe
is indicated by light gray box, and the common probe is indicated by an unshaded box. The important base (A) at the 3
⬘ end of the discriminating
probe is underlined.
FIG.
3.
NJ
tree
based
on
16S
rRNA
gene
sequences
showing
the
19
cyanobacterial
groups.
The
probes
used
in
the
microarray
were
designed
according
to
thes
e
groups.
The
P.
marinus
group
is
embedded
in
the
large
Synechococcus
group.
The
tree
contained
338
cyanobacterial
16S
rRNA
gene
sequences.
This
phylogenetic
tree
stability
has
been
supported
by
bootstrap
analysis.
For
bootstrap
analysis,
500
resamplings
were
performed
by
using
the
NJ
algorithm
in
ARB.
The
bootstrap
tree
is
avail
able
at
http:
//www.ulg.ac.be/cingprot/midichip/output/publications/Castiglioni_Tree.htm.
was used as the lower limit for positive signals in subsequent
microarray analyses.
To evaluate the relative ligation efficiency of the probes, the
mean signal intensity values of the group-specific spots for
each target were measured and normalized with respect to the
signal intensity values of the universal spot. The hybridization
intensities of the probes differed and ranged from 92 to 155%
(Table 4).
A negative control of the entire process was performed by
using double-distilled water instead of genomic DNA as the
PCR template. Following hybridization on the universal chip,
no signal was detected even after setting the PMT and laser to
95% power (data not shown).
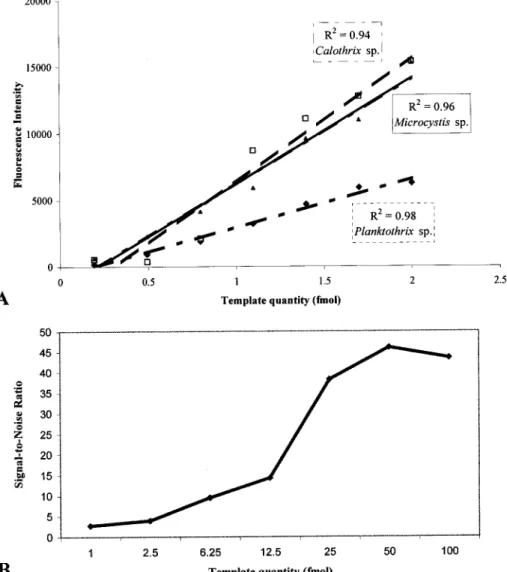
(ii) LDR sensitivity.
To establish the detection limit of the
method and the correlation between signal intensity and
tem-plate concentration, we tested various temtem-plate concentrations
(0.5 to 100 fmol) in the LDR. The PCR products originated
from the strains Planktothrix sp. strain 1LT27S08, Calothrix sp.
strain PCC 7714, and Microcystis aeruginosa PCC 9354. The
detected signals progressively decreased, and signal was
de-tectable in up to 1 fmol of the PCR product, corresponding to
1 ng of amplified DNA. No signals were detected with 0.5 fmol
of the PCR product, even after setting the PMT and laser to
95% power (data not shown). We found a linear correlation
(R
2⫽ 0.98, 0.94, and 0.96, respectively) between signal
inten-sity and template concentration (Fig. 5A). Nevertheless, the
signal-to-noise ratio also decreased with gradually reducing
template concentration (Fig. 5B). This ratio was obtained from
the signal intensities of the target-specific spots divided by the
mean signal intensity of the nonspecific spots. The
signal-to-noise ratio was clearly higher at template quantities above 25
fmol than at lower quantities (Fig. 5B). Essentially the same
results were obtained with similar concentrations of PCR
prod-ucts derived from Calothrix sp. strain PCC 7714 and M.
aerugi-nosa PCC 9354 as the LDR substrate (data not shown).
There-fore, the target concentration of 25 fmol of each strain or clone
was used in the LDR.
Use of artificial mixes of PCR products from different
strains.
To determine the efficiency of the LDR method in the
presence of complex molecular targets, we used artificial mixes
with unequal amounts of PCR products derived from the
fol-lowing cyanobacterial strains: M. aeruginosa PCC 9354,
Apha-nizomenon sp. strain 202, Planktothrix sp. strain 1LT27S08,
Spirulina major sp. strain PCC 6313, and Calothrix sp. strain
PCC 7714. After separate PCRs, the amplified fragments were
pooled in the unbalanced mixes. In all of these experiments,
the unbalanced mixes were 5 fmol of both S. major and
Calo-thrix versus 100 fmol of both Aphanizomenon and Microcystis or
Planktothrix. After hybridization of the LDR products on the
universal array, all of the expected signals were detected and
easily discriminated from the nonspecific signals. An example
of these experiments is shown in Fig. 6A. The amplicon
con-centrations were reflected in the signal intensities (Fig. 6A).
LDR detection on universal array of the 16S rRNA gene
from an environmental sample.
The 16S rRNA gene from a
sample collected from Lake Tuusulanja
¨rvi was analyzed to
evaluate the DNA microarray applicability for environmental
studies. Microarray hybridization patterns showed the
pres-ence of Microcystis, Anabaena/Aphanizomenon, and
Woronichi-nia spp. (Fig. 6B). In DGGE, the following cyanobacterial
TABLE
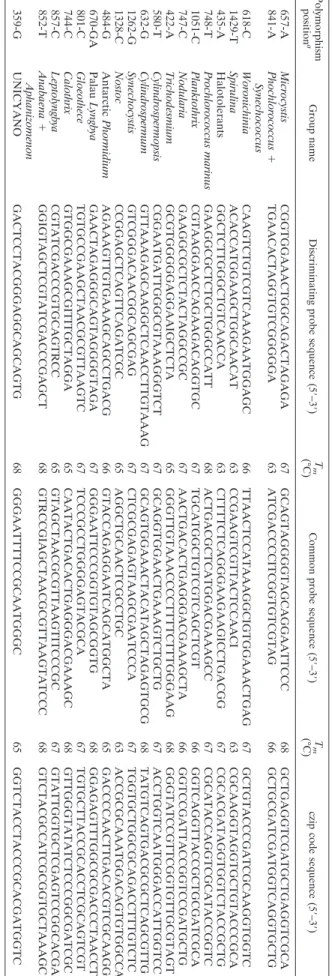
3.
List
of
group-specific
probes
and
corresponding
czip
codes
Polymorphism position a Group name Discriminating probe sequence (5 ⬘–3 ⬘) T m (°C) Common probe sequence (5 ⬘–3 ⬘) T m (°C) czip code sequence (5 ⬘–3 ⬘) 657-A Microcystis CGGTGGAAACTGGCAGACTAGAGA 67 GCAGTAGGGGTAGCAGGAATTCCC 68 GCTGAGGTCGATGCTGAGGTCGCA 841-A Phochlorococcus ⫹ Synechococcus TGAACACTAGGTGTCGGGGGA 63 ATCGACCCCITCGGTGTCGTAG 66 GCTGCGATCGATGGTCAGGTGCTG 618-C Woronichinia CAAGTCTGTCGTCAAAGAATGGAGC 66 TTAACTCCATAAAGGCIGTGGAAACTGAG 67 GCTGTACCCGATCGCAAGGTGGTC 1429-T Spirulina ACACCATGGAAGCTGGCAACAT 63 CCGAAGTCGTTACTCCAACI 63 CGCAAGGTAGGTGCTGTACCCGCA 435-A Halotolerants GGCTCTTGGGCTGTCAACCA 63 CTTTTCTCAGGGAAGAAGICCTGACGG 67 CGCACGATAGGTGGTCTACCGCTG 748-T Prochlorococcus marinus GAAGGCGCTCTGCTGGGCCATT 68 ACTGACGCTCATGGACGAAAGCC 67 CGCATACCAGGTCGCATACCGGTC 1051-C Planktothrix CGTAAGGAACCAGAAGACAGGTGC 67 TGCATGGCTGTCGTCAGCTCGT 66 GGTCAGGTTACCGCTGCGATCGCA 747-C Nodularia GAAGGCGCTCTACTAGGCCGC 67 AACTGACACTGAGGGACGAAAGCTA 66 GGTCCGATTACCGGTCCGATGCTG 422-A Trichodesmium GCGTGGGGGAGGAAIGCTCTA 65 GGGTTGTAAACCCCTTTTCTTTGGGAAG 68 GGGTATCCGTTCGGTGTTGCGTAGT 580-T Cylindrospermopsis CGGAATGATTGGGCGTAAAGGGTCT 67 GCAGGTGGAACTGAAAGTCTGCTG 67 ACCTGGTCAATGGGACCATTGGTCC 632-G Cylindrospermum GTTAAAGAGCAAGGCTCAACCTTGTAAAG 67 GCAGTGGAAACTACATAGCTAGAGTGCG 68 TATGTCAGTGACGCGCTCAGCGTTG 1262-G Synechocystis GTCGGGACAACGGCAGCGAG 67 CTCGCGAGAGTAAGCGAATCCCA 67 TGGTGCTGGCGCAGACCTTTGTCTC 1328-C Nostoc CCGGAGCTCAGTTCAGATCGC 65 AGGCTGCAACTCGCCTGC 63 ACCGCGCAAATGGACAGTGTGGCCA 484-G Antarctic Phormidium AGAAAGTTGTGAAAGCAGCCTGACG 66 GTACCAGAGGAATCAGCATGGCTA 65 GACCCCAACTTGACACGTCGCAAGG 670-GA Palau Lyngbya GAACTAGAGGGCAGTAGGGGTAGA 67 GGGAATTCCCGGTGTAGCGGTG 68 GGAGAGTTTGGCGCGACCCTAACCT 801-C Gloeothece TGTGCCGAAGCTAACGCGTTAAGTC 67 TCCCGCCTGGGGAGTACGCA 67 TGTGCTTACCGCACCTCGCAGTCGT 744-C Calothrix GTGGCGAAAGCGITITGCTAGGA 65 CAATACTGACACTGAGGGACGAAAGC 68 GTTGGGTATATCTCCCGGCGATCGC 857-C Leptolyngbya CGTATCGACCCGTGCAGTRCC 65 GTAGCTAACGCGTTAAGTITCCCGC 67 GTATTGGTGCTCGAGTCCGGCACGA 852-T Anabaena ⫹ Aphanizomenon GGIGTAGCTCGTATCGACCCGAGCT 68 GTRCCGIAGCTAACGCGTTAAGTATCCC 68 GTCTACGCCATCGCGGTGCTAAAGC 359-G UNICYANO GACTCCTACGGGAGGCAGCAGTG 68 GGGAATTTTCCGCAATGGGC 65 GGTCTACCTACCCGCACGATGGTC a With respect to E. coli , used as a reference sequence.groups were detected: Microcystis, Snowella, and Anabaena/
Aphanizomenon. Cloning revealed the following groups:
Mi-crocystis (the most abundant group, 62% of the cyanobacterial
clones), Anabaena/Aphanizomenon (18%), and Snowella
(15%) (A. Rantala, P. Rajaniemi, and K. Sivonen, unpublished
data).
DISCUSSION
Studies in environmental microbiology are often limited by
difficulties in identifying the diversity of natural populations
because isolation and cultivation of microorganisms from
nat-ural environments are sometimes impossible. Molecular
ap-proaches are intended to overcome this problem. We designed
and tested a microarray-based method for detection of
cya-nobacterial diversity. The method was based on our previous
experience with a bacterial universal array (2). In that study,
we developed and evaluated a molecular strategy based on
amplification of the cyanobacterial 16S rRNA gene region and
its molecular discrimination with the LDR-universal array
ap-proach. Using the universal array, we overcame one of the
major limitations of DNA microarray approaches based on
hybridization. Optimal hybridization conditions are difficult to
determine for large sets of different probes, which need to be
hybridized on a DNA chip at the same time (15, 21). In the
universal array-based approach, the optimization of
hybridiza-tion condihybridiza-tions for each probe set is not required. New probe
pairs can be added to the array without further optimization,
thus reducing costs and setup time. Furthermore, problems
due to secondary structures of the target DNA or steric
hin-drances of differently sized nucleic acid hybrids formed on the
microarrays after hybridization (20) are minimized. However,
this method requires an extra step (the ligation) with respect to
DNA microarray approaches based on hybridization.
In the present study, all of the LDR probes selected were
designed to have high theoretical melting temperatures to
per-form the ligation reaction at 60°C, which prevented problems
caused by secondary structures of the target DNA.
Addition-ally, the ligated products were sterically similar. In the LDR,
the specificity of the hybridization probes and the selectivity of
the ligation reaction are combined to increase the
discrimina-tion power. Furthermore, with the LDR it is possible to target
several PCR amplicons at the same time in a single ligation
reaction (multiplexing).
As described by Consolandi et al. (5), up to 54 different
FIG. 4. Deposition scheme and several examples of LDR-universal array results. On the figure, the slide with eight arrays (top left corner), the
deposition scheme of an array (top right corner), and a table specifying the cyanobacterial groups and the corresponding zip codes (bottom right
corner) are shown. The hybridization-positive control is indicated by light gray shading, and the UNICYANO probe is indicated by boldface type.
Each cyanobacterial group has four replicate spots. Hybridization results of the amplified 16S rRNA gene from the strains are shown in the bottom
left corner. (A) Aphanizomenon sp. strain 202; (B) Calothrix sp. strain PCC 7714; (C) M. aeruginosa strain PCC 9354; (D) Plankthotrix sp. strain
1LT27S08; (E) S. major strain PCC 6313; (F) Synechococcus sp. strain Hegewald 74-30.
discriminating probes can be used in such a multiplex ligation
reaction without affecting the efficiency of the method.
We employed semi-cyanobacterium-specific PCR primers,
16S27F-23S30R (14, 25), instead of the universal primer pair,
16S27F-16S1492R (6), to eliminate the diversity of
microor-ganisms other than cyanobacteria. The use of more specific
cyanobacterial primers, such as CYA359F and CYA781R (19),
which amplify only about 400 bp, would have limited the
phy-logenetic resolution.
We designed the probes based on a large number of
cya-nobacterial sequences (338) covering 19 major groups of
planktonic cyanobacteria, which is more than in previous
stud-ies (17, 21). To allow for wider applicability of the array in
future diversity studies, we also included groups not present in
lakes, such as Trichodesmium.
Probe design can be considered a crucial point in the LDR
approach. During definition of the group-specific consensus
sequences, we set the cutoff value to preserve as much
se-quence information as possible. This sometimes required the
inclusion of some degenerated positions in the probe
se-quences. A maximum of two inosine residues was included per
probe (Table 3).
We evaluated our array by testing 95 samples of known 16S
rRNA gene sequences: 51 strains belonging to 14 phylogenetic
lineages and 44 cloned fragments from lake samples. We found
perfect correspondence between the expected and actual LDR
results. In fact, all samples yielded the positive signals expected
without ambiguity. Nonspecific signals were always below 6%
of the total signal intensities. This excellent selectivity is
needed for testing complex environmental samples.
The relative probe efficiency was determined by normalizing
all specific signals to the corresponding universal
cyanobacte-rial probe. The normalized signal ranged from 92%
(Leptolyn-gbya) to 155% (Microcystis), demonstrating a sufficient level of
uniformity in the performance of the array.
Although the probes have theoretical melting temperatures
varying by 5°C, this variation does not seem to be related to the
relative probe efficiency.
The sensitivity of the method was investigated by using
dif-ferent concentrations of target DNA (amplicon of Planktothrix
sp. strain 1LT27S08). The log plot of the signal intensity versus
the total amount of amplicon showed a good linear
relation-ship (Fig. 5). Similar results were obtained with amplicons
from two other strains. The efficiency of the LDR method in
the presence of complex molecular targets was assessed by
means of artificial mixes composed of unbalanced amounts
(100:5 fmol) of PCR products. All of the signals expected were
detected and easily discriminated from nonspecific signals,
in-dicating that a reasonable association can be found between
the composition of the sample and the LDR-universal array
signals. However, it should be noted that the PCR is known to
introduce bias (27); therefore, caution should be taken when
assuming the results of PCR-LDR-universal array as
quantita-tive indicators of the original sample composition.
Finally, we evaluated this method by using an environmental
sample; the microarray hybridization pattern showed the
pres-ence of Microcystis, Anabaena/Aphanizomenon, and
Woronichi-nia spp. These results were compared with those of light
mi-croscopy
(morphotypes)
(L.
Lepisto
¨
and
P.
Kuuppo,
unpublished data) as well as cloning and DGGE analyses of
the same environmental sample (unpublished results).
Consis-tent with the microarray results, the presence of Microcystis
TABLE 4. Evaluation of probe specificity and efficiency
Group name Target
Signal intensity from nonspecific zip codes⫾ SDa Probe efficiency ⫾ SDb
Microcystis
M. aeruginosa 0BF29S03
1.45
⫾ 0.19
155.08
⫾ 5.09
Microcystis sp. strain PCC 9354
Prochlorococcus
⫹ Synechococcus
Synechococcus sp. strain Hegewald 74-30
0.97
⫾ 0.63
126.54
⫾ 4.18
Woronichinia
Woronichinia 0ES46C21 clone
2.11
⫾ 0.37
110.01
⫾ 10.38
Woronichinia 0ES46C32 clone
Spirulina
S. major PCC 6313
0.64
⫾ 0.58
151.23
⫾ 14.95
S. major 0BB22S09
Halotolerants
Cyanothece sp. strain PCC 7418
0.84
⫾ 0.25
124.62
⫾ 14.91
Planktothrix
Planktothrix sp. strain 1LT27508
3.56
⫾ 1.12
112.60
⫾ 1.82
Planktothrix sp. strain 2
Nodularia
Nodularia sp. strain PCC 73104/1
2.31
⫾ 1.62
123.57
⫾ 7.21
Synechocystis
Synechocystis sp. strain PCC 6905
1.38
⫾ 1.22
104.98
⫾ 6.48
Nostoc
Nostoc sp. strain 152
3.19
⫾ 2.58
93.90
⫾ 3.63
Nostoc sp. strain PCC 7107
Palau Lyngbya
Lyngbya sp. strain 0BB32S04
0.75
⫾ 0.49
136.61
⫾ 12.18
Calothrix
Calothrix sp. strain PCC 7714
2.85
⫾ 1.19
114.46
⫾ 9.28
Calothrix marchica LEMM Bai 71-96
Leptolyngbya
Leptolyngbya sp. strain 0BB19S12
3.37
⫾ 1.72
92.81
⫾ 16.15
Leptolyngbya sp. strain 0BB32S02
Anabaena
⫹ Aphanizomenon
Anabaena sp. strain PCC 7122
0.65
⫾ 0.97
125.68
⫾ 6.02
Aphanizomenon sp. strain 202
a
Probe specificity is the measurement of intensity values from nonspecific zip codes scaled to the signal intensity of the expected positive zip codes set to a value of 100. Each value represents the mean obtained from replicated spots (four replicate spots for each group, eight replicate spots for the universal) and from three replicate experiment sets.
b
Probe efficiency is the measurement of signal intensities of the group-specific spots for each substrate, normalized with respect to the signal intensities of the universal zip code. Each value represents the mean obtained from replicated spots (four replicate spots for each group, eight replicate spots for the universal) and from three replicate experiment sets.
and Anabaena/Aphanizomenon spp. was detected. In
addi-tion, the DGGE results showed the presence of Snowella but
did not detect Woronichinia spp. This discrepancy in results
can be discussed considering that the genera Snowella and
Woronichinia belong to the subfamily Gomphosphaerioideae
according to traditional botanic taxonomy (12); up to now,
sequences of strains belonging to this subfamily have not
been published. Recently, strains of genus Snowella were
successfully isolated and characterized phylogenetically
based on the 16S rRNA gene sequences (P. Rajaniemi,
M. A. Mugnai, A. Rantala, S. Turicchia, S. Ventura, J.
Komarkova, L. Lepisto
¨, and K. Sivonen, unpublished data).
The Snowella strains formed a highly supported cluster with
the Woronichinia strains in all phylogenetic analyses of the
16S rRNA gene sequences. So it is possible that DGGE and
microarray detect the same genotype that, lacking
addi-tional information, has been called Woronichinia on the
basis of the only two Woronichinia sequences obtained
dur-ing this work, which should be considered Snowella based on
these unpublished new data.
In conclusion, we demonstrated the feasibility of the
univer-sal array-based approach, combined with the LDR for the
identification of cyanobacteria. The method we established is
specific, yielding unequivocal identification of the
cyanobacte-ria, sensitive (down to 1 fmol can be detected), and amenable
to the analysis of complex environmental samples. This
method has wide potential for the monitoring of
cyanobacte-ria, e.g., by water authorities and companies. This technology
can be easily applied to the future study of other marker genes,
one of the most interesting of which would be the combination
of the array developed here with one that could detect
poten-tially toxic cyanobacteria. This would reveal the genetic
diver-sity of cyanobacteria as well as the presence of potentially toxic
genotypes in a sample.
FIG. 5. Testing of LDR sensitivity. (A) Correlation between signal intensity and template concentration. The effect of template concentration
on LDR was tested with PCR products of Planktothrix sp. strain 1LT27S08, Calothrix sp. strain PCC 7714, and M. aeruginosa strain PCC 9354,
ranging from 0.5 to 100 fmol. (B) Signal-to-noise ratio plotted against template quantity. Each data point represents the ratio between the mean
signal intensity of the target-specific zip codes and the mean signal intensity of nonspecific zip codes. PCR products from Planktothrix sp. strain
1LT27S08 (1 to 100 fmol) were used as a template. The signal-to-noise ratio increases with growing template concentrations.
ACKNOWLEDGMENTS
This work was performed as part of the MIDI-CHIP project (www
.ulg.ac.be/cingprot/midichip/index.htm) funded by the European
Union (contract EVK2-CT-1999-00026).
Several partners of the MIDI-CHIP project are acknowledged for
sharing their samples and expertise. We are grateful to E. Hegewald
and N. Jeeji-Bai (Forschungszentrum Ju
¨lich, Ju
¨lich, Germany) and
D. J. Scanlan (University of Warwick, Warwick, United Kingdom) for
DNA samples of their strains.
REFERENCES
1. Burja, A. M., B. Banaigs, E. Abou-Mansour, J. G. Burgess, and P. C. Wright. 2001. Marine cyanobacteria—a prolific source of natural products. Tetrahe-dron 57:9347–9377.
2. Busti, E., R. Bordoni, B. Castiglioni, P. Monciardini, M. Sosio, S. Donadio,
C. Consolandi, L. Rossi Bernardi, C. Battaglia, and G. De Bellis.2002.
Bacterial discrimination by means of a Universal Array approach mediated by LDR (ligase detection reaction). BMC Microbiol. 2:27.
3. Castenholz, R. W. 2001. Phylum BX. Cyanobacteria. Oxygenic photosyn-thetic bacteria, p. 473–599. In D. R. Boone and R. W. Castenholz (ed.), Bergey’s manual of systematic bacteriology, vol. 1. Springer-Verlag, New York, N.Y.
4. Chen, J., M. A. Iannone, M. S. Li, J. D. Taylor, P. Rivers, A. J. Nelsen, K. A.
Slentz-Kesler, A. Roses, and M. P. Weiner.2000. A microsphere-based assay
for multiplexed single nucleotide polymorphism analysis using single base chain extension. Genome Res. 10:549–557.
5. Consolandi, C., A. Frosini, C. Pera, G. B. Ferrara, R. Bordoni, B. Castigli-oni, E. Rizzi, A. Mezzelani, L. Rossi Bernardi, G. DeBellis, and C. Battaglia.
2004. Polymorphism analysis within the HLA-A locus by universal oligonu-cleotide array. Hum. Mutat. 24:428–434.
6. Edwards, U., T. Rogall, H. Blo¨cker, M. Emde, and E. C. Bo¨ttger.1989. Isolation and direct complete nucleotide determination of entire genes. Characterization of a gene coding for 16S ribosomal RNA. Nucleic Acids Res. 17:7843–7853.
7. Gerry, N. P., N. E. Witowski, J. Day, R. P. Hammer, G. Barany, and F.
Barany.1999. Universal DNA microarray method for multiplex detection of
low abundance point mutations. J. Mol. Biol. 292:251–262.
8. Giovannoni, S. J., S. Turner, G. J. Olsen, S. Barns, D. J. Lane, and N. R.
Pace.1988. Evolutionary relationships among cyanobacteria and green
chlo-roplasts. J. Bacteriol. 170:3584–3592.
9. Giovannoni, S. J., E. F. DeLong, T. M. Schmidt, and N. R. Pace. 1990. Tangential flow filtration and preliminary phylogenetic analysis of marine picoplankton. Appl. Environ. Microbiol. 56:2572–2575.
10. Gordon, D. A., J. Priscu, and S. Giovannoni. 2000. Origin and phylogeny of microbes living in permanent Antarctic lake ice. Microb. Ecol. 39:197–202. 11. Guschin, D. Y., B. K. Mobarry, D. Proudnikov, D. A. Stahl, B. E. Rittmann,
and A. D. Mirzabekov.1997. Oligonucleotide microchips as genosensors for
determinative and environmental studies in microbiology. Appl. Environ. Microbiol. 63:2397–2402.
12. Komarek, J., and K. Anagnostidis. 1999. Cyanoprokaryota. 1. Teil: Chroo-coccales, p. 136–224. In H. Ettl, G. Ga¨rtner, H. Heynig, and D. Mollenhauer (ed.), Su¨sswasserflora von Mitteleuropa. Band 19/1. Gustav Fisher Verl, Jena, Germany.
13. Kuiper-Goodman, T., I. Falconer, and J. Fitzgerald. 1999. Human health aspects, p. 113–153. In I. Chorus and J. Bertram (ed.), Toxic cyanobacteria in water: a guide to public health significance, monitoring and management. E & FN Spon, London, United Kingdom.
14. Lepere, C., A. Wilmotte, and B. Meyer. 2000. Molecular diversity of
Micro-FIG. 6. Microarray analyses of complex cyanobacterial samples. (A) The hybridization result of the unbalanced LDR mix shows how spot
intensity (left) and measured fluorescence intensity (right) correspond to the concentrations of targets. The LDR mix contained 100 fmol of the
PCR product from both M. aeruginosa strain PCC 9354 and Aphanizomenon sp. strain 202 and 5 fmol of the PCR product of both S. major strain
PCC 6313 and Calothrix sp. strain PCC 7714. (B) The environmental sample 0TU27 from Lake Tuusulanja
¨rvi (Finland) was analyzed with the
array. The hybridization pattern shows the presence of Microcystis, Anabaena/Aphanizomenon, and Woronichinia spp.
cystis strains (Cyanophyceae, Chroococcales) based on 16S rDNA sequences. Syst. Geogr. Plants 70:275–283.
15. Loy, A., A. Lehner, N. Lee, J. Adamczyk, H. Meier, J. Ernst, K. H. Schleifer,
and M. Wagner.2002. Oligonucleotide microarray for 16S rRNA gene-based
detection of all recognized lineages of sulfate-reducing prokaryotes in the environment. Appl. Environ. Microbiol. 68:5064–5081.
16. Ludwig, W., O. Strunk, R. Westram, L. Richter, H. Meier, Yadhukumar, A. Buchner, T. Lai, S. Steppi, G. Jobb, W. Forster, I. Brettske, S. Gerber, A. W. Ginhart, O. Gross, S. Grumann, S. Hermann, R. Jost, A. Konig, T. Liss, R. Lussmann, M. May, B. Nonhoff, B. Reichel, R. Strehlow, A. Stamatakis, N. Stuckmann, A. Vilbig, M. Lenke, T. Ludwig, A. Bode, and K. H. Schleifer. 2004. ARB: a software environment for sequence data. Nucleic Acids Res. 32:1363–1371.
17. Matsunaga, T., H. Nakayama, M. Okochi, and H. Takeyama. 2001. Fluores-cent detection of cyanobacterial DNA using bacterial magnetic particles on a MAG-microarray. Biotechnol. Bioeng. 73:400–405.
18. Muyzer, G. 1999. DGGE/TGGE a method for identifying genes from natural ecosystems. Curr. Opin. Microbiol. 2:317–322.
19. Nu¨bel, U., F. Garcia-Pichel, and G. Muyzer.1997. PCR primers to amplify 16S rRNA genes from cyanobacteria. Appl. Environ. Microbiol. 63:3327– 3332.
20. Peplies, J., F. O. Glockner, and R. Amann. 2003. Optimization strategies for DNA microarray-based detection of bacteria with 16S rRNA-targeting oli-gonucleotide probes. Appl. Environ. Microbiol. 69:1397–1407.
21. Rudi, K., O. M. Skulberg, R. Skulberg, and K. S. Jakobsen. 2000. Applica-tion of sequence-specific labeled 16S rRNA gene oligonucleotide probes for genetic profiling of cyanobacterial abundance and diversity by array hybrid-ization. Appl. Environ. Microbiol. 66:4004–4011.
22. Saitou, N., and M. Nei. 1987. The neighbor-joining method: a new method for reconstructing phylogenetic trees. Mol. Biol. Evol. 4:406–425. 23. Sivonen, K., and G. Jones. 1999. Cyanobacterial toxins, p. 41–111. In I.
Chorus and J. Bertram (ed.). Toxic cyanobacteria in water: a guide to public health significance, monitoring and management. E & FN Spon, London, United Kingdom.
24. Small, J., D. R. Call, F. J. Brockman, T. M. Straub, and D. P. Chandler. 2001. Direct detection of 16S rRNA in soil extracts by using oligonucleotide microarrays. Appl. Environ. Microbiol. 67:4708–4716.
25. Taton, A., S. Grubisic, E. Brambilla, R. De Wit, and A. Wilmotte. 2003. Cyanobacterial diversity in natural and artificial microbial mats of Lake Fryxell (McMurdo Dry Valleys, Antarctica): a morphological and molecular approach. Appl. Environ. Microbiol. 69:5157–5169.
26. Thompson, J. D., D. G. Higgins, and T. J. Gibson. 1994. CLUSTAL W: improving the sensitivity of progressive multiple sequence alignment through sequence weighting, position-specific gap penalties and weight matrix choice. Nucleic Acids Res. 22:4673–4680.
27. von Wintzingerode, F., U. B. Gobel, and E. Stackebrandt. 1997. Determina-tion of microbial diversity in environmental samples: pitfalls of PCR-based rRNA analysis. FEMS Microbiol. Rev. 21:213–229.
28. Wang, R. F., M. L. Beggs, L. H. Robertson, and C. E. Cerniglia. 2002. Design and evaluation of oligonucleotide-microarray method for the detection of human intestinal bacteria in fecal samples. FEMS Microbiol. Lett. 213:175– 182.
29. Wilmotte, A. 1994. Molecular evolution and taxonomy of the cyanobacteria, p. 1–25. In D. A. Bryant (ed.), The molecular biology of cyanobacteria. Kluwer Academic Publishers, Dordrecht, The Netherlands.
30. Wilmotte, A., and M. Herdmann. 2001. Phylogenetic relationships among cyanobacteria based on 16S rRNA sequences, p. 487–493. In D. R. Boone and R. W. Castenholz (ed.), Bergey’s manual of systematic bacteriology, vol. 1. Springer, New York, N.Y.
31. Wilson, K. H., W. J. Wilson, J. L. Radosevich, T. Z. DeSantis, V. S.
Viswanathan, T. A. Kuczmarski, and G. L. Andersen.2002. High-density
microarray of small-subunit ribosomal DNA probes. Appl. Environ. Micro-biol. 68:2535–2541.
32. Wu, L., D. K. Thompson, G. Li, R. A. Hurt, J. M. Tiedje, and J. Zhou. 2001. Development and evaluation of functional gene arrays for detection of se-lected genes in the environment. Appl. Environ. Microbiol. 67:5780–5790.