HAL Id: hal-02528594
https://hal.archives-ouvertes.fr/hal-02528594
Submitted on 1 Apr 2020HAL is a multi-disciplinary open access
archive for the deposit and dissemination of sci-entific research documents, whether they are pub-lished or not. The documents may come from teaching and research institutions in France or abroad, or from public or private research centers.
L’archive ouverte pluridisciplinaire HAL, est destinée au dépôt et à la diffusion de documents scientifiques de niveau recherche, publiés ou non, émanant des établissements d’enseignement et de recherche français ou étrangers, des laboratoires publics ou privés.
DRIVES
Stanislaw Abramik, Wojciech Sleszynski, Janusz Nieznanski, Hubert Piquet
To cite this version:
Stanislaw Abramik, Wojciech Sleszynski, Janusz Nieznanski, Hubert Piquet. A DIAGNOSTIC METHOD FOR ON-LINE FAULT DETECTION AND LOCALIZATION IN VSI-FED AC DRIVES. 10th European Conference on Power Electronics and Applications, EPE’2003, Sep 2003, Toulouse, France. �hal-02528594�
A DIAGNOSTIC METHOD FOR ON-LINE FAULT DETECTION
AND LOCALIZATION IN VSI-FED AC DRIVES
Stanislaw Abramik(*), Wojciech Sleszynski(*), Janusz Nieznanski (*), Hubert Piquet (**)
(*) Department of Electrical and Control Engineering, Gdansk University of Technology
ul. Narutowicza 11, 80-952 Gdansk, Poland, Tel.: +48 58 347 16 75, Fax: 341-08-80
sabram@ely.pg.gda.pl, wslesz@ely.pg.gda.pl, jniez@ely.pg.gda.pl
(**) Laboratoire d’Electrotechnique et d’Electronique Industrielle,
2 rue Camichel, 31071 Toulouse CEDEX, France
piquet@leei.enseehit.fr
Acknowledgments
This paper was in part financially supported by the Komitet Badan Naukowych within the project No. 4 10A 076 22
Keywords
Diagnostics, fault detection, fault localization, voltage-source inverters, AC motor drives.
Abstract
This paper describes a novel approach to the detection and localization of semiconductor faults in VSI-fed AC drives. We use the DC-to-fundamental motor current ratio as the diagnostic variable. The method has proved to reliably detect true faults, while not issuing false alarms under transient conditions. The method has been validated by both simulation and experiment.
Introduction
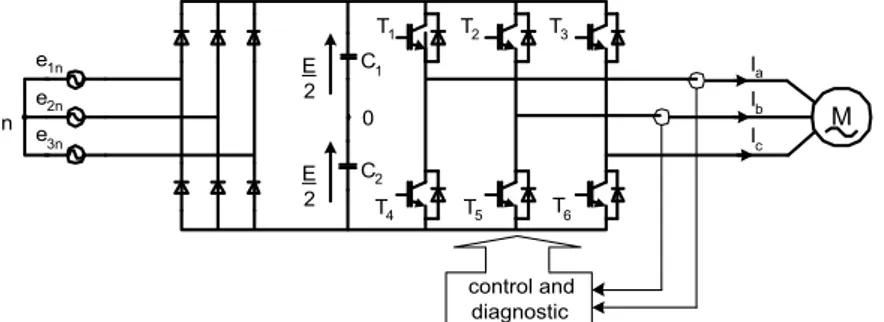
Numerous industrial applications and processes rely on variable-speed motor drives made of induction motors and voltage-source inverters (VSI). The inverters in such applications are often exposed to high stresses that can lead to inverter component failures. Unless sufficiently early detected, the failures may bring about serious damage and/or production losses. For instance, the DC component of the phase current caused by an open fault of a transistor produces a torque pulsation that is dangerous to both the rotor and the gear. An unbalanced current, in turn, may lead to excessive thermal stresses and, in consequence, to a short-circuit within the inverter [5, 6]. This paper presents a novel approach to the detection and localization of semiconductor open faults in VSI-fed AC drives. The proposed approach enjoys the freedom from false alarms under transients. This is achieved by appropriately constructing the diagnostic variable in order to make it largely independent of the operating conditions of the drive. The variable of choice is the ratio of the DC component to the fundamental component of the inverter output current. The drive under consideration consists of a DC supply, a PWM voltage source inverter worked in an open-loop V/f speed control strategy and an induction motor. The circuit schematic of the drive used in this study is given in Fig. 1.
e1n e2n e3n n T1 T2 T3 T6 T5 T4 Ia Ib Ic C1 C2 0 E 2 E 2 M control and diagnostic
Properties of inverter currents after an open-transistor fault
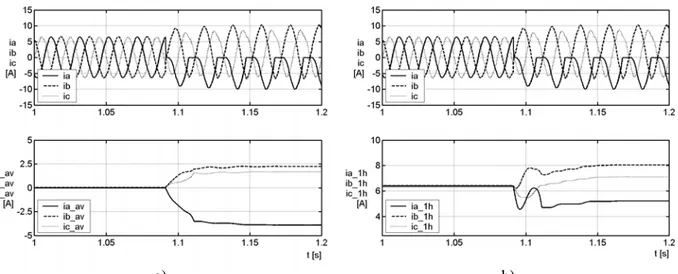
After an open-transistor fault, the output current of the faulty leg is no longer alternative. For instance, in the case of transistor T1 going open, the motor current Ia takes on a unidirectional flow with
negative polarity only (Fig. 2). Its DC value is no longer close to zero, but increases as depicted in Fig. 2a. The level ultimately reached by the DC value depends on the bus voltage and the stator resistance [1, 2]. Due to the motor symmetry, the DC current offset in the faulty phase is reflected in the other phases as well. The signs of the DC values depend on which transistor went faulty; the sign in the healthy phases is the opposite of that in the faulty phase.
a) b) Fig. 2: Current waveforms and their corresponding DC (a) and 1st harmonic (b) values
for the case of T1 open fault
The fundamental harmonic of the current in a faulty phase is smaller than before the failure (Fig. 2b). This decrease is compensated for by an increase in the fundamental components of the healthy phases. The above properties of current waveforms, before and after an open fault, are illustrated in terms of current spectra in Fig. 3.
0 1 2 3 4 5 6 7 8 9 0 1 2 3 4 5 6 7 8 [A]
Harmonic components of Ia current before a T1 open fault Harmonic components of Ia current after a T1 open fault
(a) 0 1 2 3 4 5 6 7 8 9 0 1 2 3 4 5 6 7 8 [A]
Harmonic components of Ib current before a T1 open fault Harmonic components of Ib current after a T1 open fault
(b)
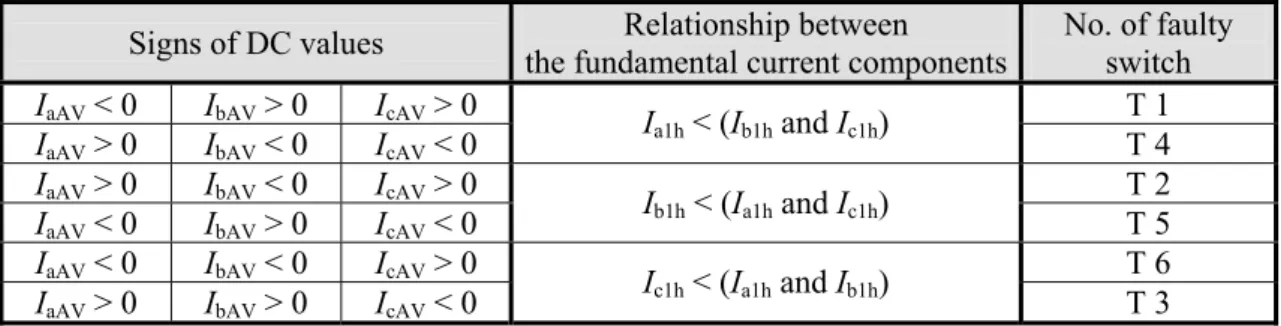
Fig. 3: Current spectra at normal and fault conditions: a) phase A, b) phase B (T1 open fault) These properties can be used to detect the fault and localize the faulty transistor in the inverter circuit. The relationships between the signs of DC values and the fundamental components of currents that are characteristic of each inoperative transistor are presented in Table I.
Table I – Signs of DC values of currents and relationships between the fundamental
current components depending on the location of the fault
Signs of DC values the fundamental current components Relationship between No. of faulty switch
IaAV < 0 IbAV > 0 IcAV > 0 T 1
IaAV > 0 IbAV < 0 IcAV < 0
Ia1h < (Ib1h and Ic1h) T 4
IaAV > 0 IbAV < 0 IcAV > 0 T 2
IaAV < 0 IbAV > 0 IcAV < 0 Ib1h < (Ia1h and Ic1h) T 5
IaAV < 0 IbAV < 0 IcAV > 0 T 6
IaAV > 0 IbAV > 0 IcAV < 0 Ic1h < (Ia1h and Ib1h) T 3
Diagnostic medium
The DC components of load currents have been suggested in the literature [2, 7, 8] as simple carriers of diagnostic information on inverter transistor faults. Unfortunately, the fault detection based on the DC components tends to be highly unreliable under varying operating conditions, notably under fast transients. The main problem is the tendency to issue false alarms, which results from misinterpreting the transient current evolutions as large DC components. A possible work-around might be to adapt the detection thresholds to the operating conditions and increasing them under transients. However, this would necessitate some method for the detection of transients, which is a non-trivial problem in its own right. Here, the solution is sought by relating the DC component (IAV) to a normalizing quantity
that conveys the necessary information about the operating conditions of the drive. A good choice for the latter is the fundamental component of the load currents (I1h), leading to the following definition of
the diagnostic variable:
h 1 AV variable diagnostic I I = (1)
The above variable enjoys the following features:
• under normal conditions the diagnostic variable is close to zero (because of very small values of the DC components),
• after a fault, the component increases sizably and takes on a negative or positive sign, depending on which transistor went faulty,
• a constant detection threshold set on this variable is equivalent to a self-adapting absolute DC threshold.
These proprieties allow simplifying the detection algorithm by introducing a constant detection threshold. The open transistor fault might in principle be detected and recognized by simply comparing the above-defined diagnostic variables against fixed thresholds. As a practical matter, however, the reliability of the diagnosis is greatly enhanced by also using the signs of the variables.
Implementation of the diagnostic method
Generation of diagnostic signatures
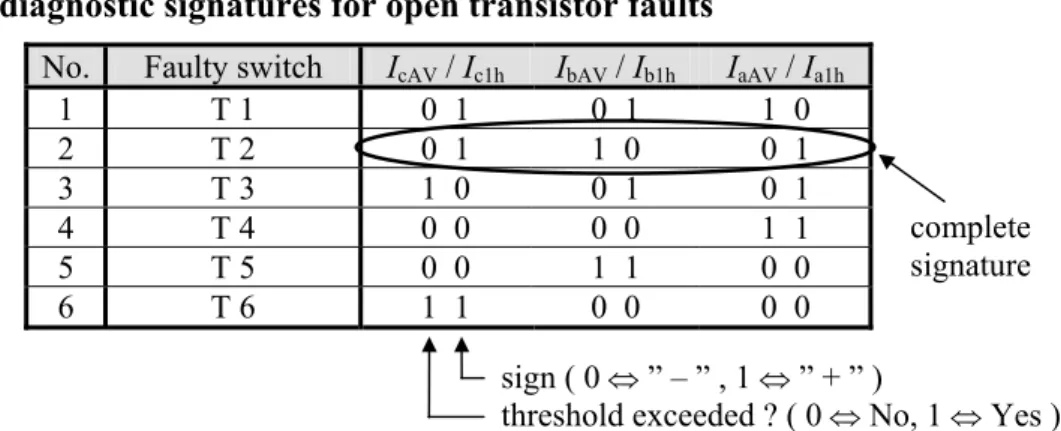
The proposed method is based on testing the levels and signs of the three diagnostic variables (normalized DC currents). A fault is detected when the threshold is exceeded in one phase, while the values in the other phases remain below the threshold and have the opposite signs. The output of the threshold detection, along with and the signs of diagnostic variables, are treated as a signature of the transistor open fault. This signature is coded by 6-bit binary vectors as illustrated in Table II. For each phase, two bits are used: one to represent the sign of IAV / I1h, the other representing the result of
comparing this ratio with the adopted detection threshold. The localization of a faulty transistor is performed by comparing the actual signature with the reference signatures in Table II.
Table II – The diagnostic signatures for open transistor faults
No. Faulty switch IcAV / Ic1h IbAV / Ib1h IaAV / Ia1h
1 T 1 0 1 0 1 1 0 2 T 2 0 1 1 0 0 1 3 T 3 1 0 0 1 0 1 4 T 4 0 0 0 0 1 1 5 T 5 0 0 1 1 0 0 6 T 6 1 1 0 0 0 0 complete signature sign ( 0 ⇔ ” – ” , 1 ⇔ ” + ” )
threshold exceeded ? ( 0 ⇔ No, 1 ⇔ Yes )
Recursive DFT algorithm
To ensure low computational burden of the proposed diagnostic functionality on the overall real-time control system, a simple recursive DFT (discrete Fourier transform) algorithm has been adopted to compute the fundamental current components [3, 4]. With the fundamental component of period T being given by:
( )
+
=
π
τ
π
τ
τ
k
T
b
k
T
a
k
i
1h 1cos
2
1sin
2
(2)(where τ = T/N is a sampling period, N is a total number of points per period and k = 0, 1, 2, …, N – 1), the coefficients a1 and b1 can recursively be computed as
( )
N k k i N a i N i kπ
τ
cos2 2 1 1∑
+ − = = (3)( )
N kn k i N b i N i kπ
τ
sin2 2 1 1∑
+ − = = (4)The proposed algorithm employs a sliding time window whose length equals the fundamental period. The window is right-shifted by one sample at every sample time. The DSP implementation utilizes the principle of circular buffer in order to compute the consecutive values in (3) and (4). The DC components are calculated for the same moving window according to the following equation:
(
∑
+ − = = i N i k AV i k N k i 1 1 ) (τ
τ
)
(5)Sampling scheme
To make the working of the diagnostic algorithm independent of the commanded fundamental frequency, the sliding window is automatically adapted to the fundamental period. The calculation method for the DC and fundamental component demands a constant number of uniformly spaced samples per fundamental period. This means that the sampling period should vary with the commanded frequency, while always remaining an integer sub-multiple of the fundamental period. This is equivalent to having the sampling times equally distributed in angle rather than time (as illustrated in Fig.4).
Consequently, in the considered implementation the sampling instants are timed using phase accumulation mechanism. The phase, conceived of as the integral of the commanded fundamental frequency, is accumulated modulo-2π/N, and the sampling instants are simply the instants of accumulator overflow. The experimental algorithm used N = 64 samples of currents per fundamental period.
ωvar φ 2 0 m 4 0 m 6 0 m 8 0 m 0 . 1 0. 12 0. 14 0. 16 0. 18 - 1. 5 -1 -0.5 0 0.5 1 Time 0 1 16 64 samples V
Fig. 4: The idea of the proposed sampling scheme
Simulation and experiment results
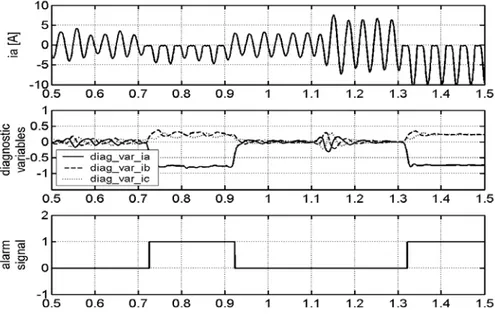
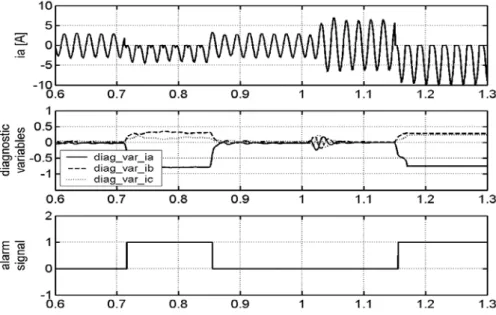
The proposed diagnostic approach was validated by simulation and experiment. For simulation purposes, a proprietary power electronic software platform TCad 7.0 has been used. Shown in Figs. 5 and 6 are example waveforms of phase-a current, the diagnostic variables and the ultimate alarm signal (i.e. a signal indicating the faulty transistor – here by the transistor number) for two fundamental frequencies: 30 Hz and 50 Hz. The waveforms were recorded for the case of transistor T1 open fault under no-load and rated load of the motor. The detection threshold for the tests was set to 0.45.
As seen in Figs.5-6, the diagnostic variable corresponding to the faulty phase stabilizes at a level that is approximately constant despite the changes in operating frequency and motor load. This level is close to – 0.7, whereas the value of diagnostic variables in the other phases is about 0.25. This configuration of values results in signature no. 1 (in Table II) being generated. In this manner, the inverter fault is correctly detected and localized. In general, the diagnostic delay is below one fundamental period under all conditions.
Fig. 5: Phase-a current, diagnostic variables and alarm signal for different load conditions and operating frequency 30Hz
Fig. 6: Phase-a current, diagnostic variables and alarm signal for different load conditions and operating frequency 50Hz
The algorithm enjoys high reliability under fast transients, e.g. sudden changes in the load torque. As seen in Figs. 5-6, such changes only cause small transient variations in the diagnostic variable, and have no effect on the diagnostic functionality.
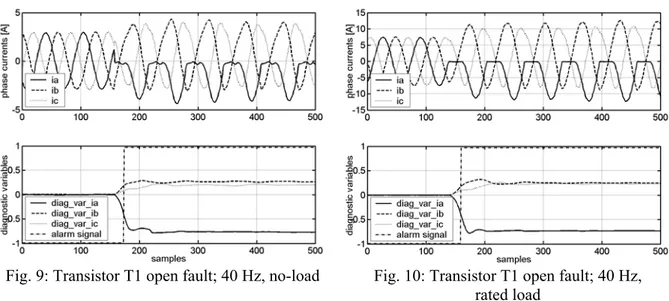
To verify the simulation results by laboratory experiments, a test setup was used comprising a 2.2 kW induction motor and an IGBT voltage source inverter. The mechanical load was provided by a DC generator feeding a variable resistor. The proposed diagnostic method was implemented for real-time operation on a DSP board with a TMS320C6711 floating-point device. This same board was used for all other control purposes (the proposed diagnostic approach does not entail any hardware overhead). Example experimental results are shown in Figs. 7-10. All waveforms were stored in the DSP-device memory using the sampling scheme as already discussed. The measurements were taken for two different inverter operating frequencies and two values of motor load torque: no-load and rated load.
Fig. 9: Transistor T1 open fault; 40 Hz, no-load Fig. 10: Transistor T1 open fault; 40 Hz, rated load
As was the case for the simulations, the diagnostic variables take on values close to – 0.7 in the faulty phase, and close to 0.25 in the healthy phases, independent of the working conditions of the drive. The detection threshold set to 0.45 proves to be a good choice for high reliability of the method. The detection delay, as easily predicted, depends on the instant the fault occurs. The shortest detection time (about 1/3 fundamental period) is obtained when the fault occurs during the rising of current in a switch (Figs. 9 and 10). For transistor faults occurring in the second quarter of the current waveform, the detection takes longer, that is, about one fundamental period (Figs. 7 and 8).
Conclusion
A novel approach has been suggested for detecting and localizing transistor faults in VSI motor drives. The essence of the approach lies in the use of normalized DC currents as diagnostic variables of choice, and in appropriate current sampling scheme. The DC components in the inverter phase currents are normalized to their corresponding fundamental components. This normalization permits the use of fixed detection thresholds, independent of the operating point of the drive, both under steady state and transients. The suggested sampling scheme makes the approach independent of the commanded operating frequency.
Discussed in this paper is only the case of single transistor faults. Nevertheless, the proposed approach has also proved adequate, after some minor modifications, for detecting simultaneous occurrence of two transistor faults.
References
[1] Chrzan P. : Selected Synthesis Issues of Vector-Controlled Induction Motor Drives. Zeszyty Naukowe Politechniki Gdanskiej Nr 571, Seria Elektryka nr 85. Wydawnictwo Politechniki Gdanskiej 1998. [2] Chrzan P.J., Szczesny R.: Fault Diagnostic of Voltage-fed Inverter for Induction Motor Drive. ISIE
Conference 1996, Vol. 2, pp. 1011-1016.
[3] Dölen M., Lorenz R.D.: An Industrially Useful Means for Decomposition and Differentiation of Harmonic Components of Periodic Waveforms. IEEE Industrial Application Society, Annual Meeting, Rome, Italy, October 8-12, 2000
[4] EI-Habrouk M., Darwish M.K.: Design and implementation of a modified Fourier analysis harmonic current computation technique for power active filters using DSPs. IEE Proc.-Electr. Power Appl., Vol. 148, No.1, January 2001. pp 21-28.
[5] Filippetti F.,Franceschini G.,Tassoni C. : Integrated Diagnostic System for Failure Identification in Power Converters. EPE 95, Sevilla 1995. pp 3.270 – 3.274.
[6] Kastha D., Bose B.K.: Investigation of Fault Modes of Voltage-Fed Inverter System for Induction Motor Drive. IEEE Transaction on Industry Application. Vol. 30, No. 4, July/August 1994.
[7] Mendes A. M. S., Marques Cardoso end E. S. Saraiva: Voltage Source Inverter Fault Diagnosis in Variable Speed AC Drives, by Park’s Vector Approach. Power Electronics and Variable Speed Drives, 21-23 September 1998, Conference Publication No. 456, IEE 1998
[8] Zhang L., Aris I. B., Hulley L. N.: A Knowledge-based System for On-Line Fault Diagnosis of Power Inverter Circuits for AC Machine Drive. EPE’95