Evaluating the quality of OSM roads and buildings in the
Québec Province
Mémoire
Milad Moradi
Maîtrise en sciences géomatiques - avec mémoire
Maître ès sciences (M. Sc.)
Evaluating the Quality of OSM Roads and Buildings in
the Québec Province
Mémoire
Milad Moradi
Sous la direction de :
Stéphane Roche, directeur de recherche
Mir Abolfazl Mostafavi, codirecteur de recherche
Résumé
Ces dernières années, de nouvelles méthodes de collecte de données géospatiales basées sur la contribution du public se sont développées. L’information géographique volontaire ou « Volunteered Geographic Information (VGI) » en anglais, renvoie à des contextes dans lesquels les citoyens génèrent volontairement du contenu géospatial et le partage avec le reste de la communauté. OpenStreetMap est l'un des projets VGI les plus réussis. Il vise à créer une carte du monde modifiable et gratuite. Les citoyens peuvent participer à ce projet en créant de nouvelles fonctionnalités, en modifiant celles existantes ou en ajoutant des valeurs d'attribut aux objets cartographiés. Les valeurs d'attribut sont stockées dans la base de données OSM sous forme de paires «clé = valeur». Il existe trois façons de participer à OSM: numériser des images aériennes, importer des coordonnées GPS ou importer un ensemble de données. Aucune expertise en géomatique ou SIG n'est requise pour participer au projet. De plus, il n'y a pas de règle prédéfinie pour le balisage et les participants OSM peuvent ajouter n'importe quelle clé ou valeur aux fonctionnalités. Par conséquent, il existe de réelles préoccupations concernant la qualité des données OSM. Cette recherche évalue la qualité de la base de données OSM sur la base des éléments de qualité mentionnés dans la norme ISO (ISO 19157: 2013). En raison de l'accès limité aux ensembles de données de référence, seules l'exhaustivité, la précision de la position, la précision des attributs et la précision de la forme géométrique sont évaluées dans cette recherche. Dans un premier temps, toutes les mesures proposées pour évaluer la qualité des données spatiales sont passées en revue. Ensuite, la qualité des bases de données des routes et des bâtiments OSM est évaluée à l'aide de ces mesures. Enfin, une analyse statistique est effectuée pour mesurer la corrélation entre les mesures de qualité et les indicateurs de qualité potentiels tels que la densité de la population, le niveau de revenu et la distance au centre de la ville. Ces indicateurs peuvent fournir un aperçu de la qualité des données OSM lorsqu'aucune donnée de référence n'est disponible.
Abstract
In the recent years, a new method of spatial data collection based on the public participation has emerged which is called Volunteered Geographic Information (VGI). In VGI projects, citizens voluntarily generate spatial content and share it with the rest of the community. OpenStreetMap is one of the most successful VGI projects that aims to create an editable, free map of the world. Citizens can participate in this project by creating new features, editing the existing ones or adding attribute values to the features. Attribute values are stored in OSM database as “key=value” pairs. There are three ways of participating in OSM: digitizing aerial images, importing GPS coordinates and importing a data set. No expertise in geomatics or GIS is required for participating in the project. Furthermore, there is no pre-defined rule for tagging and OSM participants can add any key or value to the features. Consequently, there are real concerns regarding the quality of OSM data. This research, propose to assesse the quality of OSM database based on the quality elements that are mentioned in ISO standard (ISO 19157:2013). Due to the limited access to reference data sets, only completeness, positional accuracy, attribute accuracy and shape accuracy are evaluated in this research. In the first step, all the measure that are proposed for assessing the quality of spatial data are reviewed. Then, the quality of OSM roads and buildings databases are assessed using these measures. Finally, the statistical analysis is done to measure the correlation between quality measures and potential quality indicators such as population density, incomelevel and the distance to the center of the city. These indicators can provide an insight into the quality of OSM data where no reference data is available.
Table des matières
Résumé ... ii
Abstract ... iii
Table des matières ... iv
Liste des Figures ... vii
Liste des Tableaux ... ix
Liste des abréviations, sigles, acronymes ... x
Remerciements ... xi
Introduction ... 1
Research Questions ... 2
Research Objectives ... 3
Steps of the research ... 4
Literature Review ... 7
Volunteered geographic information ... 7
VGI and related concepts ... 8
Different types of VGI ... 9
VGI Applications ... 10
Spatial Data Quality ... 10
VGI quality... 13
OpenStreetMap ... 15
OSM Data Structure ... 16
Motivation of Contributors ... 18
Tools to Edit or Work with OSM Data ... 19
OSM Data License ... 20
Humanitarian OSM ... 20
OSM data quality ... 20
The Quality of OSM Roads ... 23
The Quality of OSM Buildings ... 25
Evaluating the Quality of OSM Roads ... 29
Introduction ... 29
OpenStreetMap Quality Assessment ... 31
VGI Data Quality ... 32
OSM Data Quality ... 33
Quality Indicators ... 34
Materials and Methods ... 35
Evaluating Completeness ... 35
Evaluating Positional Accuracy ... 36
Evaluating Attribute Accuracy ... 39
Evaluating the Quality of OSM ... 40
Study Area ... 40 Data ... 40 Completeness ... 42 Positional Accuracy ... 44 Attribute Accuracy ... 51 Statistical Analysis ... 54 Conclusion ... 58
Evaluating the Quality of OSM Buildings ... 60
Introduction ... 60 Methodology ... 62 Feature Matching ... 62 Completeness ... 70 Positional accuracy ... 72 Shape accuracy ... 73 Attribute accuracy ... 75 Implementation ... 75 Study area ... 75 Data ... 78 Preprocessing ... 79 Feature Matching ... 82
Evaluating the completeness ... 82
Evaluating the positional accuracy ... 87
Evaluating the shape accuracy ... 90
Evaluating the attribute accuracy ... 96
Conclusion ... 105 Conclusion ... 106 Bibliographie ... 111
Liste des Figures
Figure 1. the steps of the research ... 6
Figure 1-1. The flow of information in Web 2.0 ... 7
Figure 1-2. Overview of the components of the geographic data quality ([7]) ... 11
Figure 1-3. OpenStreetMap website ... 15
Figure 1-4. The number of OSM registered users over the time (Source: [47]) ... 16
Figure 1-5. Distribution of values for the key "highway" (Source [54]) ... 18
Figure 1-6. Market share of each OSM editor tool ( Source: [13]) ... 19
Figure 2-1. average distance between the two lines (Source: [90]) ... 36
Figure 2-2. Hausdorff distance between two lines (inspired from: [90]) ... 37
Figure 2-3. The increasing buffer method (source: [64]) ... 38
Figure 2-4. Double buffer method (Source: [91]) ... 39
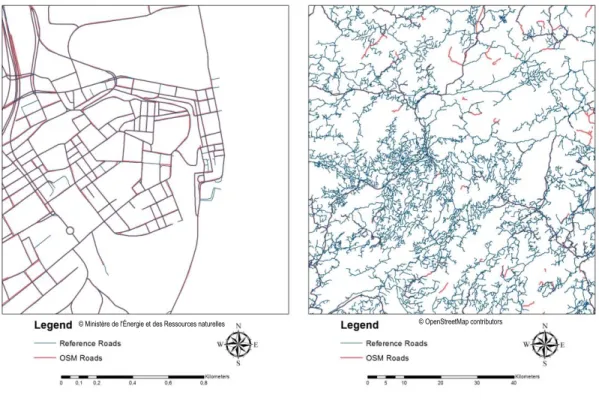
Figure 2-5. reference roads (left) and the OSM roads (right) [95] ... 41
Figure 2-6. The two data sets in the campus of Laval University [95] ... 42
Figure 2-7. The completeness of OSM road network. 1- Left: Old Québec 2- Right: outside urban areas ... 43
Figure 2-8. The completeness of OSM road network in the province of Québec [95], [97] ... 44
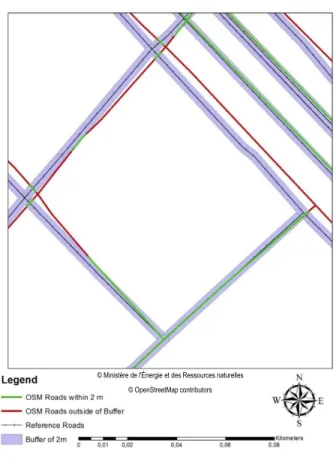
Figure 2-9. An example of increasing buffer method for the distance of 2 m ... 45
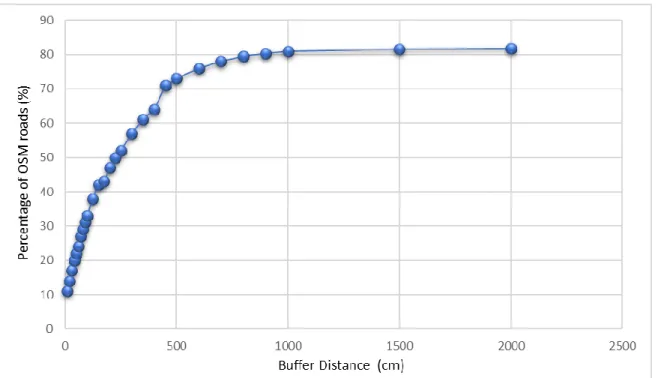
Figure 2-10. The positional accuracy of the OSM road network using increasing buffer method ... 46
Figure 2-11. The positional accuracy of each type of road ... 47
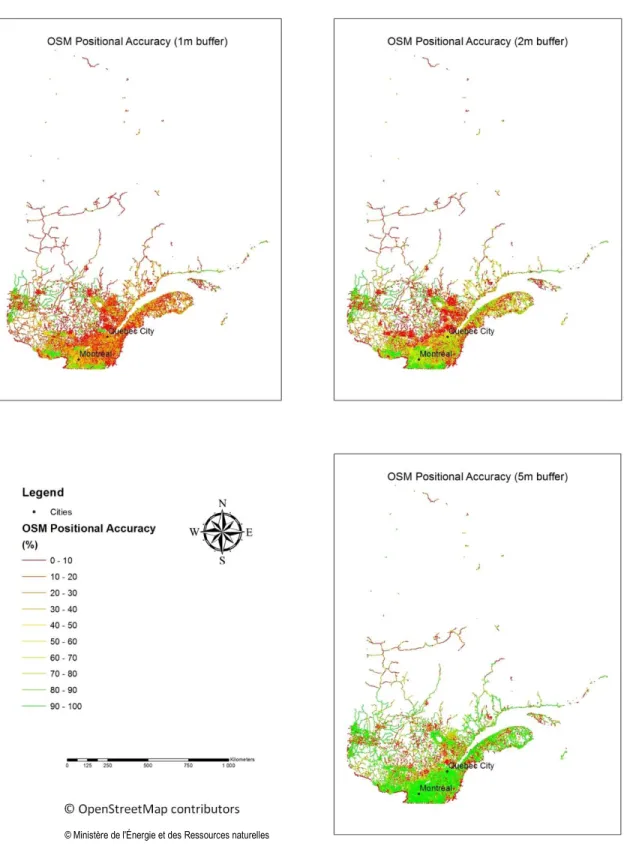
Figure 2-12. Positional accuracy of OSM roads calculated using IBM with 1m, 2m and 5m buffers ... 48
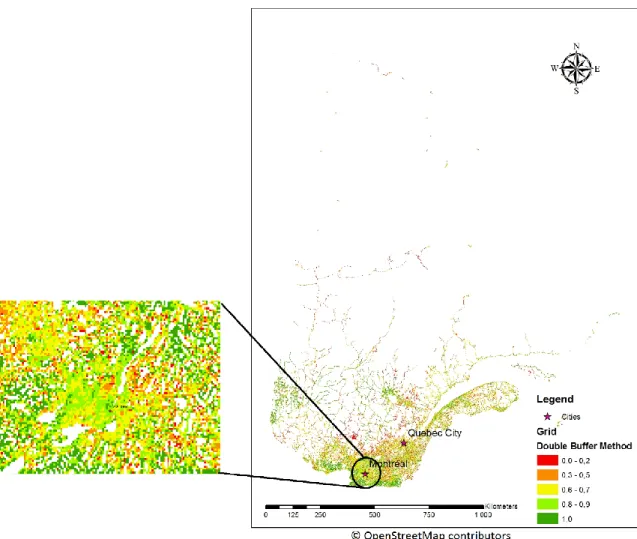
Figure 2-13. An example of double buffer method ... 49
Figure 2-14. Positional accuracy of the OSM roads calculated by double buffer method using 1m buffers ... 50
Figure 2-15. Value of Levenshtein distance for the whole province of Québec ... 52
Figure 2-16. The Levenshtein distance calculated for each grid ... 53
Figure 2-17. Levenshtein distance for each grid around Québec city ... 54
Figure 3-1. The issues regarding matching OSM building footprints with reference ones ... 65
Figure 3-2. The errors of matching OSM building footprints with reference ones ... 66
Figure 3-3. Polygon aggregation for feature matching ... 68
Figure 3-4. Proposed feature matching algorithm ... 69
Figure 3-5. The study area ... 77
Figure 3-6. Cities that are selected as case studies. ... 77
Figure 3-7. Distribution of OSM buildings in the province of Québec ... 80
Figure 3-8. Reference data and clipped OSM data in Québec City. ... 81
Figure 3-9. Reference data and OSM data on the campus of Laval University ... 81
Figure 3-10. The 5 measures of quality for each grid in Québec City ... 86
Figure 3-11 OSM buildings in and in the reference database with their centroids ... 87
Figure 3-12. Average distance between the centroid of the OSM buildings and their corresponding reference building (m) ... 88
Figure 3-13. Scatter diagrams of the displacement of the centroids of OSM buildings ... 89
Figure 3-14. Average positional accuracy for each grid cell in Québec City ... 90
Figure 3-15. Area ratio between the OSM buildings and their corresponding reference building ... 91
Figure 3-16. The compactness values for each city... 92
Figure 3-18. Average value of the average distance for each city (m) ... 94
Figure 3-19. Shape accuracy measures for the city of Longueuil ... 95
Figure 3-20. taginfo results for the tag "building=yes" (source: https://taginfo.openstreetmap.org/) ... 96
Liste des Tableaux
Table 2-1. The frequent errors that exist in the road names in the province of Québec ... 51
Table 2-2. Correlation coefficient between quality measures and potential quality indicators ... 55
Table 2-3. Result of Spearman’s correlation test between the quality measures and quality indicators ... 57
Table 3-1. Cities that are selected for the study area ... 76
Table 3-2. Links to the provider of the reference data for each city ... 78
Table 3-3. Unit-based completeness for the selected cities in the Québec Province ... 83
Table 3-4. Average area of the building footprints in OSM and in the reference databases ... 84
Table 3-5. The object-based completeness assessment for the cities of the province of Québec ... 85
Table 3-6. Spearman’s rank correlation between the quality measures and quality indicators ... 101
Table 3-7 Correlation between the size of the buildings' footprints and quality measures ... 103
Liste des abréviations, sigles, acronymes
GIS Geographic Information System VGI Volunteered Geographic Information IBM Increasing Buffer Method
DBM Double Buffer Method OSM OpenStreetMap NAD North American Datum ODbL Open Database License UGSC User Generated Spatial Content GDP Gross Domestic Product GPS Global Positioning System
Remerciements
Introduction
In the last two decades, Web 2.0 has changed the way people were interacting with the internet [1]. Before Web 2.0, the information came from the internet servers towards the people, while Web 2.0 technologies enabled people to produce content and send it back to the server [1]. Therefore, Web 2.0 enabled internet users to share content among themselves. This new technology is the basic concept behind many famous websites such as Wikipedia, Tweeter, and Facebook [2]. In the realm of spatial and geographic applications, Web 2.0 enabled users to share their geographic data or share their spatial knowledge about features and places. On the other hand, easy access to GPS-enabled devices such as cell phones facilitated the production of geographic content [3]. Therefore, volunteers can produce geographic content and share it over the internet with other citizens [3].
Volunteered Geographic Information (VGI) is a term introduced by Goodchild to address this new phenomenon [3]. In a VGI project, citizens contribute voluntarily in producing geographic content and sharing it with the rest of the citizens. OSM is an example of VGI where volunteers contribute to the project by digitizing new features from aerial imagery or by editing the semantic attributes of the existing features [4]. Every contributor can add, edit or remove features from the map. OSM does not ask its contributors to have a certain level of knowledge about geographic data [5]. Any non-expert person can join the project. Therefore, there is a debate about the quality of OSM data. Even some cases of vandalism (introducing error to map intentionally) have been detected by researchers [6].
The quality of spatial data is very important. Practically, it is impossible to use a database properly for an application without having knowledge about its quality. It is the quality of the data that determines whether it is fit for a purpose or not. ISO standard (19157) [7] mentions six elements of quality: 1) completeness, 2) positional accuracy 3) semantic accuracy, 4) logical consistency, 5) temporal accuracy and 6) fitness for use. This standard defines a unique way of understanding the quality of spatial data. Several quality measures are proposed to measure these elements of quality. There are different measures (e.g. shape, area, et.) for evaluating the positional accuracy of polygonal, linear, and other types of features. This research first finds different measures of quality proposed by previous researche works. Then, it evaluates the quality of OSM data in the province of Québec using these measures.
GenerallytThese measures of quality are calculated by comparing the OSM data to a reference database. This method of quality assessment cannot be used in the regions where no reference data is available (does not exist or is expensive). Thus, researchers proposed other indicators of quality [8] without using those meseurs. Indicators can describe the quality where no other method of quality assessment is available. Population [8], income [9] density of OSM buildings [10] can be used as indicators that have been proposed by previous
researches. The correlation between indicators and measures of quality is calculated in this research to provide knowledge about each indicator and their relations with the elemnets of data quality.
Research Questions
OSM data is freely available for users and they just must mention the source of the data. In addition, it is not possible to use geographic data properly in any application without having complete information describing the quality of the geographic data. The data of OSM is available, but the quality of this data is not very well investigated so far. The first question of this research is:
• How is the quality of OpenStreetMap road and building data in the province of Québec?
o How complete is the data?
o How is the attribute accuracy of the data?
o How is the positional accuracy of the data?
o How is the shape accuracy of the data?
To answer this question, we must evaluate different measures of the quality of OSM data in the province of Québec. Quality is not a clear concept and in different applications, it may be defined in different ways. In terms of spatial data quality, a standard is published by ISO, and this research follows this standard to evaluate the quality of OSM data.
Different quality measures are proposed by researches to evaluate different aspects of quality. Thus, it is necessary to do a literature review and find the most efficient measures proposed by the previous researches. The second question of this research is:
• Which measures of quality should be used to evaluate the quality of OSM roads and buildings?
The main objective of OSM is to provide a free and open map of the world for the places where authoritative data is not available, or it is not free. The traditional methods of quality evaluation compare the test database to a reference database, but these methods are not suitable for OSM quality assessment in the places where no authoritative data is available. Thus, researchers tried to find indicators that can describe the OSM data quality in those places. This research tries to expand these indicators and asses their correlation with quality measures in order to determine which indicator has a relationship with each quality measure. These quality indicators are extracted from the previous researches. However, previous researches did not evaluate the relationship (positive
or negative correlation) between each indicator and all quality measures. Thus, the knowledge in this area is not comelete. This research will fill the gaps of previous researches by doing a complete evaluation of the relationship between quality measures and quality indicators. For example, if a variable (such as population) is proved to have a positive association with a quality measure (such as completeness), this research investigates the following hypothesis: “This variable (quality indicator) has a positive correlation with other quality measures such as positional accuracy and attribute accuracy”. The variables that are proved to have a positive correlation with a quality measure, are called a quality indicator or a proxy for that measure. These quality indicators can potentially have a positive correlatyion with other measures of quality. Thus, the last question of this research tries to provide knowledge about the relationship between quality indicators and the quality measures that are not evaluated in the previous researches.
The third question of this research is:
• What is the relationship (correlation value) between the potential quality indicators and quality
measures?
The answer to this question provides insight into the use of quality indicators and their role in the quality assessment of the OSM database.
Research Objectives
The quality assessment of OSM is an important chalange that provides knowledge about the fitness of OSM roads and buildings data for different applications. Spatial data quality is not a well-defined concept and there is a debate about it. In addition, VGI (and especially OSM) is very common these days and a wide range of people contribute to VGI projects such as OSM. The data produced by these people cannot be used properly, unless we have a good understanding of the quality of this new data source. Therefore, it is very important that researchers develop methods that can provide knowledge about the quality of OSM. Hence, the first objective of this research is:
• Identifying measures proposed in the literature for evaluating the quality of OSM linear (roads)
and polygonal (buildings) data.
When the proposed methods are analyzed, the suitable ones will be selected to evaluate the quality of OSM roads and buildings data in the province of Québec. OSM project has a variety of active contributors in the province of Québec and it is important to evaluate the quality of this data in order to be able to use it in appropriate applications.
The second objective of this research is:
• Evaluating the quality of OSM roads and buildings data in the province of Québec using the
measures that are discussed in the previous step.
Considering the fact that the traditional methods of quality assessment that compares the OSM data with the reference data are not suitable for the places where no authoritative data is available, this research analyses the correlation between a number of potential quality indicators (such as population, income, distance from the center of the city, …) and quality measures. These correlations will provide information about the potential quality indicators. I call them potential quality indicators, because even though previous researches proved a positive correlation between them and a specific quality measure, they may or may not have a positive correlation with other quality measures. The results of the correlation analysis will tell us which indicator can better describe each quality measure. Which indicator is stronger or which one of these potential indicators are not suitable (if the correlation is low).
The third objective of this research is:
• Calculating the correlation between the quality measures and the potential quality indicators in
order to find out which one of these potential indicators can be used for describing the quality.
This step requires calculating the quality measures and quality indicators for each region of the case study. Then, calculating the correlation between these two groups of variables to understand the role of each of them in describing the quality.
Steps of the research
In this research, the first step is finding the previous researches that have been done about the quality assessment of OpenStreetMap data. The purpose of this literature review is to find out 1) which methods have been proposed for quality assessment and which quality measures are proposed to provide a quantitative evaluation of OSM data quality 2) which potential quality indicator is proposed by the previous researches. Therefore, the output of this step is two lists: 1) a list of measures of quality 2) a list of potential quality indicators.
In the next steps, the road data is downloaded from OSM and authoritative sources. The downloaded data is preprocessed to remove the road types that do not exist in the authoritative database (such as step ways). The preprocess step deletes the buildings that are smaller than 40 square meters because most probably they are garages and other small buildings that look like houses in aerial images. When the data from both sources is ready, feature matching algorithms are used to find corresponding features in order to enable comparison
between them. In the case of buildings, the authors proposed a new feature matching algorithm that is based on the percentage of overlap and shape similarity of the two polygons.
Next, the measures of quality that are listed in the previous step are calculated for OSM roads and buildings database. Completeness, attribute accuracy, shape accuracy and positional accuracy are the elements of the quality that are evaluated in this research. In the next step, the value of the potential quality indicators is calculated. This research takes into account 7 quality indicators: population, income, the density of OSM buildings, the density of OSM roads, the number of POIs, the distance to the center of the city, and the size of the buildings. The size of the buildings cannot be used for roads but the rest of the quality indicators are measured for both roads and buildings.
Finally, the correlation between the quality measures and quality indicators is evaluated to find out the relationship among them. A high correlation shows that the quality measure can be described with the indicators, while a low correlation shows that it is impossible to describe the behavior of the quality measures with the help of quality indicators.
Because roads are linear features and buildings are polygonal features, the author decided to separate these two different processes in two chapters. Thus, the rest of this research consists of these chapters: 1) literature review 2) quality assessment of roads 3) quality assessment of buildings 4) conclusion.
Literature Review
Volunteered geographic information
In recent decades, citizens are not only the users of the data, but they are also the providers of it [11]. By the advent of Web 2.0, which is also known as the participatory Web, the users of the Internet became able to produce content and participate in the flow of information [2]. Websites based on Web 2.0 allow their users to participate in the community and build a virtual community in which each member can produce and share content with other members [2]. Examples of this participation include tagging, writing a comment, sharing a video, and sharing a document [2]. In other words, before Web 2.0, the flow of information was from providers to users, but after Web 2.0, users also can produce and share content [3]. Figure 1-1 illustrates the flow of information in Web 2.0. Popular websites such as Wikipedia, Facebook, and Youtube are examples of Web 2.0 [2].
Figure 1-1. The flow of information in Web 2.0
This new concept of Web 2.0 revolutionized the traditional geographic information collection methods and enabled a phenomenon that is called VGI by Goodchild [3]. Goodchild believes that VGI can be considered as a democratization of GIS because it provides free access to spatial data for all citizens [12]. He argued that by the advent of Web 2.0, the flow of information between the user and server became a two-way road [3]. From the point of view of Goodchild, two main factors facilitated the growth of VGI over the recent years: 1) the facilitation to share geographic data, 2) the facilitation to collect geographic data [3]. The facilitation in sharing the geographic data happened by Web 2.0, while the facilitation to collect the geographic data happened due to the GPS devices and cameras [3]. Therefore, today citizens are able to use their cellphone to collect geographic
data and then use Web 2.0 to share it with others. The cellphones also enable users to collect photos, and thanks to the GPS devices, these photos can be tagged with geographic coordinates [3]. These geo-tagged photos are a source of geographic data that can be shared easily using Web 2.0 technologies. Overall, the new technologies allow human beings to act as sensors and collect geographic data in different forms and share it with others, a phenomena that Goodchild referred to it as “citizens as sensors” [3].
Therefore, in the domain of VGI, there are different concepts, such as citizen science, user-generated content, and public participatory GIS. These concepts will be discussed in detail in the next section.
VGI and related concepts
Citizen science
As discussed earlier, Goodchild introduced the concept of VGI, and explained that in recent years, thanks to the technological advances, humans can act as sensors and collect and share geographic information with other members of the community [3]. The term citizen science is then used to describe the act of any group of citizens who work as observers and collect data to solve any specific problem in the world [3]. Therefore, VGI can be related to citizen science because in VGI, citizens are observers, and they detect a specific phenomenon, and they report it to the rest of the community. For example, a GIS website that allows citizens to report information about a wildfire or specific animal’s nests are two examples of the application of VGI in citizen science. Another example can be a system that allows users to upload their trajectory and then use those trajectories to monitor the traffic. In fact, any geographic information that is collected by volunteers to study any specific issue is a case where VGI can be used in citizen sciences [13].
User-generated Content
User-generated content is referred to a content or information such as text, photo, or document that is shared by users of online platforms such as wikis [14]. The rise of user-generated content happened at the same time web 2.0 allowed users to share their content [14]. The social media are a good example of platforms where users produce content and share it over the web. Usually, there is a community where the users belong, and they publish their content to share with the rest of the members of the community [14]. Internet forums, blogs, and wikis are the most famous places where user-generated content is shared [14]. Usually, a pool of information is created in these communities [13]. The geographic data that contributors to OpenStreetMap produce is a good example of user-generated content in the GIS world [13]. Therefore, user-generated spatial content is a specific type of user-generated content that should be considered [1][13]. Some criticism of user-generated content, such as data quality, is even more serious in spatial applications because they have been collected by non-expert members of the community [13]. Considering the fact that user-generated content is collected by a variety of users, the produced content is not necessarily consistent [15]. Thus, an important effort should be made to
process the user-generated content before being able to use it properly [15]. [1] believes that in terms of VGI, user-generated content can provide us with the ability to supply information and update them on a regular basis for existing databases. [1] mentioned that the geotagged photos of Flickr are a good example of user-generated spatial content that can be a source of useful information for updating existing databases . In terms of VGI, the generated content and the order in which the content is generated (places that are mapped) can indicate the priorities and interests of the contributors [16].
Crowdsourcing
Based on Lexico’s dictionary (powered by Oxford), crowdsourcing is getting a task done by a variety of people either paid or not [17]. In fact, crowdsourcing is outsourcing a task or a series of tasks to the crowds of people who may do it as part of a contract or just as a volunteer service [18]. Wikipedia defines crowdsourcing as a model of sourcing in which some services or information or other kinds of products are delivered to a company or organization by using the ideas, expertise, and finances of a large group of people [19]. The major difference between outsourcing and crowdsourcing is that in crowdsourcing, the task is done by a large group of citizens, while in outsourcing, the task can be done by any individual [19]. Internet is usually used to distribute the task and information among the community, and as a consequence, crowdsourcing increased by the growth of the Internet and its accessibility [19]. One of the challenges of the crowdsourcing of spatial data is to collect different results and put them together to make a unique, consistent final product [20]. Crowdsourcing spatial data has been successfully applied in a number of domains, including disaster management, tourisem, and etc. [21].
Different types of VGI
VGI can be classified based on the type of information that it provides. From this point of view, there are three main classes, including text-based, image-based, and map-based VGI [22]. For example, geo-tagged microblogs such as geotagged tweets, geo-tagged images in Flickr, and similar services and geo-tagged videos are different types of VGI [22]. The online platforms that allow the contributors to draw map features and add attributes to them are considered as the map-based VGI [22], [23]. In map-based VGI, the contributors contribut directly to creat or modify the geographic features or add new attributes to existing features [22]. Thus, in map-based VGI, in general, the geographic part of the contribution is more considerable, and usually, the contributors are implicitly contributing to generating geographic content [22], [23]. In text-based VGI, however, the attributes or the geographic information is usually achieved by text mining methods or direct contribution of the citizens [22].
VGI data can be classified from different point of views. One of the differences between VGI and user-generated spatial content is that in the case of VGI, the participation of the user in the generation of the content should be voluntarily [24]. Therefore, the applications that collect the trajectory information from cellular phones without
the direct intention of the person may not be considered as VGI. Generally, VGI can be categorized in 2 different cases: explicitly volunteered and implicitly volunteered data [24]. A tweet that is an example of explicit volunteered information and the information that people add to OSM is explicitly volunteered information [24]. VGI can further be categorized into groups based on the fact that whether or not the geographic data is explicit or implicit. For example, a tweet that talks about a specific place is a geographically implicit information, while a tweet that is geo-tagged is an explicit information [24]. In VGI, human acts as a sensor, depending on active or passive sensing; the type of VGI can be categorized [24].
VGI Applications
Considering the fact that VGI provides an extensive amount of freely available geographic information, it can be used in a wide range of applications and improve the traditional tools and techniques. VGI has been successfully used for humanitarian purposes. In the case of earthquakes, OpenStreetMap data is used to help the search and rescue teams in the regions where no authoritative data were available [25]. In addition, VGI is used for disaster management [26]–[28] and intelligent transportation [29], [30]. VGI has been used to evaluate public opinion about the large scale projects [25]. It is also used for mapping mental and contagious diseases in urban areas [31]. VGI can be used as a way of studying global mobility patterns [32]. Map-based VGI can be used for a variety of purposes. Practically, all the purposes that need geographic data. For example, OSM data is used in urban planning [25]. Map-based VGI is also used for facilitating the routing of the people with motor disability [33]. In addition, VGI can be used for land-use modeling [34]. It can be concluded that VGI is a valuable source of information, even though extracting the useful information from the flow of VGI needs precise modeling and tools.
Spatial Data Quality
Lexico’s dictionary (powered by Oxford) defines quality as “The standard of something as measured against other things of a similar kind; the degree of excellence of something” [35]. Quality assessment is an essential part of any process. In terms of geographic data, various researches have been undertaken to define the quality of geographic data. Geographic data cannot be used properly in different applications unless its quality is measured in a standard and measurable way. Therefore, in the 1980s the discussion about the quality of geographic data increased in the US Federal Government and some other universities [18]. These discussions resulted in a consensus of the researchers over 5 principal elements of geographic data quality, including positional accuracy, attribute accuracy, logical consistency, completeness, and lineage [18]. The quality of geographic information should be described in a way that it can have the same meaning for all the producers and users of the data because if the quality is not expressed in a unique standard way, then it can make confusion. International Organization for Standardization (ISO) tried to address this need and published a
standard for the quality of geographic data [7]. Figure 1-2 describes the components of the spatial data quality based on ISO 19157:2013 standard. Based on this standard, there are six elements of quality, and for each report of quality, these six elements should be discussed [7].
Figure 1-2. Overview of the components of the geographic data quality ([7])
The elements of quality described by ISO 19157 standard are: completeness, logical consistency, positional accuracy, thematic accuracy, temporal quality and usability [7]. Completeness is an element that evaluates the
presence and absence of the geographic features or their attributes from the database [7]. If there are some extra features in the database, commissions are occured, while if there are some missing features, omissions happens in the database [7]. Completeness consists of two parts: data completeness and model completeness [36]. Data completeness refers to the relation between the features in the data set and the features in the real world, while model completeness refers to the degree to which the model that describes the application needs is complete [36].
Logical consistency evaluates whether or not the data is in line with the rules and structures [7]. Based on ISO 19157, standard logical consistency consists of four parts: conceptual consistency, domain consistency, format consistency, and topological consistency [7]. It describes how well attributes, relations, and features are in line with data specifications [36]. Evaluation of logical consistency depends on the data structures and models that describe the nature of the data [36].
Positional accuracy refers to the accuracy of the position of the features on the map in comparison to the reality [7]. Due to the fact that determining the position of the features on the surface of the Earth is done by a set of measurements, the calculated coordinates will never be exactly correct [18]. The positional accuracy of the features of the map is determined by equipment used, operator policy, digitization policy, and source material [36]. In order to evaluate positional accuracy, the position of the feature should be compared to its “true” position on the surface of the Earth [36]. Positional accuracy follows the rules of error propagation [36]. Numerical assessment of positional accuracy is easier than other quality elements because it is related to coordinates that are by nature numeric. Root mean square average is a frequently used method for evaluating the positional accuracy of features [36].
Thematic accuracy refers to the degree of correctness and accuracy of the attributes that describe geographic features [7]. In the ISO standard, temporal accuracy refers to the accuracy of the temporal attributes and the accuracy of the time measurements [7]. Temporal information describes the date of data acquisition, the time of the last update, and the period in which the data is considered valid [36]. Information about creation, modification, and deletion of features should be evaluated in temporal quality assessment [36].
ISO standard considers usability as the last element of data quality [7]. Usability is defined and measures based on the different needs and requirements of the user in each application [7]. Thus, usability is not defined for each dataset, but it is defined based on the application that the dataset is used for. In fact, this element of ISO standard refers to the concept that is called “fitness for use” by other researchers [37]. This concept is related to the fact that the quality of data should always be evaluated in relation to the application because a data set that is not qualified for one application may be qualified enough for another application. Thus, without considering the application, evaluating the quality is not complete.
There is another classification for spatial data quality that believes that there are two main categories of quality: internal quality and external quality [5], [37], [38]. External quality of the data refers to the “fitness for use” of data in the specific application that the data is going to be used [5]. On the other hand, internal quality assessment explores the degree to which the data is in line with the rules and predefined specifications [5]. In fact, ISO standard refers to 5 internal quality elements, and the sixth quality element is usability that refers to the external quality assessment. External assessment of quality depends on the application and requirements of the user, while internal quality is independent of application [37]. External quality also is referred to as “fitness for use” of the data set for a specific application [37]. Internal quality depends on the quality of measurement equipment, the degree to which the data meets the standards, and how well the data is in line with the data structures and other criteria [5].
VGI quality
As mentioned in the previous sections, the advent of Web 2.0 enabled the citizens to produce content and share it over the internet. An important part of this content has a geographic nature. In recent years, thanks to the growth of the internet and other technologies, citizens are more and more involved in the process of geographic content production [18]. Traditionally, geographic content is produced by organizations and governments that follow specific rules and guidelines [10]. Quality assurance in mapping organizations is enabled in two ways: quality control rules and procedures to ensure that measurement is precise, taking some samples from the produced maps, and comparing it to the reference sources [18]. However, these days a large percentage of geographic content is produced by the individuals who are not necessarily familiar with GIS and spatial data quality concepts [10]. Thus, a serious concern regarding VGI is the quality of the user generated content because the majority of VGI is generated by non-specialists who are not following any specific guidelines for quality control [39].
A percentage of VGI is simply created by digitizing aerial images with volunteers who are not even familiar with the neighborhood, a phenomenon that is called “armchair mapping” [4], [40], [41]. The fact that non-expert, armchair mappers are participating in VGI, causes a huge concern about how we can trust VGI and use it in different applications [10]. Therefore, various researches have been done to evaluate the quality and credibility of VGI data.
[18] proposed three main quality control mechanisms for VGI including crowdsourcing, social and geographic methods. These three mechanisms are not dealing with evaluating the quality of the generated content, but they are general ways to ensure that the production will work well. The reason that we need to develop new methods for evaluating the quality of VGI is that first, the production rate of VGI is so high, and traditional quality control
methods are not efficient. theirdly, there is a great difference in the nature of the methods of data production in VGI and in traditional ways of collecting geographic data.
Crowdsourcing means solving a problem by referring it to a vast number of volunteers [18]. Thus, we depend on the wisdom of the crowds to collect the information by sensing the environment [18]. The crowd can not only generate the information, but they can also detect the errors in the content [18]. This feature of the crowdsourcing is, by nature, a mechanism of quality control [18]. This phenomenon is a famous fact in computer science that expresses that if there are enough contributors to a citizen science project, the bugs and errors are automatically detected and corrected by the community memebers [42]. Therefore, crowdsourcing is both the mechanism of data collection and quality control [18]. In the case of OpenStreetMap, the contributors detect and correct the features or the parts of the map that they believe are wrong. If a great number of them work on the neighborhood of the map, it can be expected that the errors are detected and corrected by the contributors.
The second mechanism proposed by [18] for quality assurance of VGI is a social approach. This mechanism is also called the “hierarchy of trusted individuals” that control the content that is generated by others [18]. Based on this mechanism, a group of senior members of the community should supervise the procedures and the content that is produced by the other members [25]. Then, the data should be verified and accepted by the elite group before publishing it on the internet [18]. This method is applied in a number of online communities, such as Wikipedia and OSM [18]. This group of expert users can prevent the occurrence of errors and even vandalism [6].
The third mechanism of VGI data quality assurance is the geographic approach [18]. Based on the geographic approach, there are a set of rules and syntaxes that the geographic features follow [18]. Thus, by checking those rules in the generated content, we can ensure that errors are detected and removed from the database [18]. For example, a geographic rule about an island is that it should be surrounded by water. Therefore, these rules should be defined, and the validity of the new content should be verified by those rules. [43] used a spatial data mining approach to find the geographic rules inside the authoritative data sets. They used an automatic rule detection algorithm to find the topological relations and rules among different features of the map [43]. Then, they extracted the rules for forests, parks, and meadows to verify the newly generated content with the previous rules [43]. [43] is an example of using geographic mechanisms for validating the quality of VGI.
In addition, [11] believes that the credibility of VGI is an issue that needs extensive research because there is a lot of information about the traditional sources of spatial data, while about VGI data credibility, there are not enough research. In addition, [11] argues that considering that VGI is a new and relatively fast-changing market, there is a need to investigate the credibility of VGI. One possible definition for credibility is the accuracy of the information in its traditional meaning [11]. [11] believes that it is essential that the wisdom of academic crowds
be used for evaluating the credibility of the geographic data that is produced by the networks of volunteer citizens.
OpenStreetMap
OpenStreetMap is an online project that aims to provide the resources for volunteers to participate in the process of mapping the world and, in the end, to provide a freely accessible map of the world [44]. The purpose of this project is to provide free geographic data of the world that are updated with the help of the volunteers [44]. OpenStreetMap can be considered as a map-based geographically explicit type of VGI [44]. This project started in the University College London (UCL), where Steve Coast, the founder of OSM, studied [45]. OSM started its work in 2004, and since then, it is continuously growing in terms of the amount of information that is stored in its database [45]. OSM provides users with tools to edit the map and add and remove features [45].
Figure 1-3. OpenStreetMap website
The fact that Bill Clinton, former president of the USA, decided to provide free access to GPS data in 2000, improved the methods of data collection by GPS receivers [45]. OSM uses GPS receivers as a method of data collection. GPS trajectories can be used to map the roads. OSM has three main sources of data including: digitizing aerial images, processing GPS tracks, and import of geographic data from authoritative sources [46]. Yahoo has accepted to provide OSM with free base images that enable users to produce geographic content by digitizing the images [46]. Unfortunately, there is no way to understand how each geographic feature is added to the map (by digitizing, GPS, or upload of authoritative organizations) because OSM does not save this kind of information in its database [5].
Contributors of OSM join the project with different motivations. The number of OSM users has been almost constantly growing over time (2004-2020) except for a few occasions when a number of contributors decided to withdraw from the project because of different reasons [47]. [48] realized that events could affect withdrawal rates from the project. For example, when the British national mapping agency released geographic data of the country freely, it disappointed many contributors to the OSM project [48]. Another event that affected the withdrawal rate was the license change of OSM [48]. [48] estimated that almost 2000 contributors quit the project after the license changed.
Figure 1-4. The number of OSM registered users over the time (Source: [47])
[49] evaluated the behavior of the OSM project contributors. They evaluated factors such as the number of nodes, mean length and sinuosity values of the road network in OSM. By evaluating the data of OSM between 2007 and 2017, they realized that at the beginning, the contributors added the data of main roads such as highways and motorways. On the other hand, at the end of the period, the residential roads and pedestrian roads were added [49]. Thus, [49] concluded that the wider roads were mapped before the narrow ones. In addition, they realized most of the users tend to map short and straight roads rather than long ones [49].
OSM Data Structure
OSM data is used in a wide range of applications. Facebook, Foursquare, Mapquest and Seznam are some examples of users of OSM data and map [44]. Geographic features (roads, hospitals, …) in the OSM database
are stored using a geographic part and an attribute part [50]. The attributes, which are the characteristics of the objects in the real world, are stored in the database as tags [45], [50]. Each tag represents a characteristic of the object using key = value pairs. The geographic part consists of three main groups: nodes, ways, and relations [45], [50]. This model is not following the traditional methods of GIS, where points, lines, and polygons are used to represent the features [51]. Nodes are simply points that are stored using a pair of coordinates in the WGS84 reference system, and they are useful for storing features without size [5], [44]. On the other hand, ways are ordered sets of nodes that are used to store linear features (line and polyline if they are open and polygon if they are closed) in the OSM database [44], [52]. Relations are ordered sets of nodes and ways that are useful for storing the relations among the features of the map [5], [44], [52]. For example, OSM uses relations to store turn restrictions for road features in the database [44]. All edits that contributors are doing in the database of OSM are stored in a PostgreSQL database (which is an open-source database) with PostGIS extension [44]. PostGIS is an open-source extension for PostgreSQL that enables storing spatial data such as point lines and polygons. In addition, PostGIS provides a variety of functions for working with these spatial features.
OSM Tags
As mentioned earlier, tags in OSM are simply a “key=value” pairs that represent characteristics of an object in the real world [45], [50]. The metadata of OSM is stored in the tags [5]. Unlike the geometric part of the object, the tags can change very frequently [5]. The tags that are assigned to the features are accessible through the TagInfo (https://taginfo.openstreetmap.org/) service [25]. This service allows the users to find out the most frequent keys and values that are used in OSM [25].
OSM provides a list of possible key = value pairs for contributors to use in the tagging process of OpenStreetMap
(https://wiki.openstreetmap.org/wiki/Map_Features). This page describes what the difference is between basic
tags and suggests a set of unique tags to increase the uniformity of the map. For example, on this page, there are guidelines to differentiate between the value of different highway keys such as primary, secondary, tertiary and residential [50]. Considering the fact that the contributors do not follow these guidelines strictly, there is an uncertainty about the semantic information available in OSM [53]. For example, maybe one contributor adds “primary,” and the other one adds “secondary” as the value of the highway key.
Even though OSM provides a list of possible basic tags, the contributors can select any tag that they think is suitable for describing the object [51]. Thus, there is no restriction for using keys and values for tags in OSM [45], [51]. There is a huge debate about whether this method of tagging is efficient or not. This free-style tagging provides freedom for the contributors to add any information to the map. However, there is not enough control over the tags that contributors use in OSM [45]. [53] believes that this flexibility of the tagging process can cause a noise in the attributes of the features and an uncertainty about the semantic information of the map.
Sometimes one key (such as name) has more than one value. [53] believes that contributors disagreement, spelling errors, and lack of knowledge about the neighborhood can cause assign of more than one value to a single key. It is possible that a feature is edited by more than one contributor or more than once by a single contributor. In this case, if the number of edits on a single feature in OSM is more than a predefined threshold, the feature is called “heavily-edited feature” or “popular feature” [53]. The number of heavily edited features on the map is not considerable [53].
Using Taginfo, researchers can explore the tags and have information about the tag content of the OSM database. Figure 1-5 illustrates the distribution of values for the key “highway” in the whole database of OSM.
Figure 1-5. Distribution of values for the key "highway" (Source [54])
The majority of the features that are tagged by the key “highway” has the value of residential. It means that the most frequent tag in the database is “highway = residential”. “Service”, “Track” and “Unclassified” are the most frequent values in the database of OSM.
Motivation of Contributors
Openstreetmap is an online community where a number of citizens gather and contribute to achieving a common goal [48]. In these online communities, the success of the project depends largely on the contribution of the members [48]. These contributors have a variety of different reasons and motivations for contribution, and they
may withdraw from the community if they lose their motivation [48]. Different studies showed that people have different motivations to contribute to the OSM project. A number of examples of these motivations are being interested in providing free information for everyone (data democratization), feeling useful by being part of a community (OSM community) [45] or having some negative feelings for national mapping agencies who earn money by selling it to the citizens.
Tools to Edit or Work with OSM Data
Basically, there is no real difference between editing data in OSM or other online communities. However, considering the fact that OSM contains spatial data, it is necessary that it provides users with tools to create, edit, and delete spatial features [13]. For example, tools for digitizing roads from aerial images. Or tools to upload spatial data into the OSM database.
Figure 1-6. Market share of each OSM editor tool ( Source: [13])
Figure 1-6 illustrates the market share of each OSM editor tool. Based on this figure, Potlach and JOSM are the most frequently used editors on the market. There is not a huge difference among them, and contributors can select the editor based on personal preferences and the operating system that they use.
The second category of tools of OSM are the tools that are developed for working with OSM data. One of the most famous open-source tools to work with downloaded OSM data is Osm2postgresql
(https://wiki.openstreetmap.org/wiki/Osm2postgresql). This tool allows users to upload the downloaded OSM
data into a PostgreSQL database with PostGIS extension [56].
OSMPythonTools is an open-source Python library that allows manipulation of OSM data [56]. This library internally is built based on Pandas and Matplotlib python packages [56]. Moreover, there are a variety of tools based on R to explore OSM data. These packages include osmar, osmdata R Packages [56]. In addition, several
plugins are developed for QGIS, including QGIS OSM Plugin. This plugin can explore both spatial and attribute values of map features.
OSM Data License
OSM allows everyone to access, download, edit, and use its data freely because the data of OSM is under Open Database License (ODbL) [57]. This license allows any use of the data as long as it is mentioned that the data is downloaded from the OSM database, and also, the results of the work are released under Open Database License (ODbL) [57]. The license of OSM data was not ODbL since the beginning of the project. This license has changed because the previous license was not suitable for spatial data since it did not allow processing or combining it with other data [44]. Therefore, on 12 September 2012, the license of the OSM database changed to ODbL that allows any use of data when the source (OSM contributors) is cited [44].
Humanitarian OSM
OSM is not only a mapping project, but it has a social dimension [57]. For example, in 2010, when the earthquake happened in Haiti, a group of OSM contributors started to map Haiti [57]. The motivation of this group was to help search and rescue teams to have maps of Haiti [57]. Therefore, 600 contributors from across the world helped to provide a map of Haiti in a short time [57]. Finally, the Humanitarian OpenStreetMap Team (HOT) was created, and in 2013 it was registered as a non-profit organization in the U.S. [57].
OSM data quality
Assessing the quality of the geographic data is necessary before users can use the data in any application. However, describing the quality of the data is usually difficult and challenging [37]. Without understandable information about the quality of a data set, there is always a risk of misuse of data [37]. Therefore, one of the most important issues in quality assessment is assessing “fitness for use” [37]. [37] argues that there are two main meanings for the “data quality” in the literature. The first category tries to evaluate the quality by evaluating the presence of errors, which is called “internal quality” [37]. However, the second category tries to evaluate the quality of data by evaluating how good it answers the needs of the user (external quality) [37].
As mentioned earlier, most of OSM contributors are not necessarily experts in GIS or spatial data collection. Thus, there are serious concerns about both the internal and external quality of OSM data [58]. It is important to evaluate the quality of OSM before being able to use it in a specific application. In this section, a literature review of the research works that deal with the quality of OSM data is provided. Considering the fact that this research pays attention to the quality of data on roads and buildings, these two data layers are evaluated in separated subsections.
[55] proposed a model for evaluating the quality of OSM tags. They used Taginfo as a tool to execute queries about the tags of OSM. Taginfo can be considered as a tool that helps researchers to find out information about the tags that contributors have added to the OSM database [54]. In order to have some quantitative measures to evaluate the quality of tags, [55] proposed the six following quality measures: “completeness”, “compliance”, “consistence”, “granularity”, “richness” and “trust”. Regarding the tags describing businesses, they found that the tags describing the name of the business is far more complete than the tags describing the phone number or opening hours [55]. Regarding the road network, they realized tags describing the name are far more complete than tags describing “oneway” or “maxspeed” [55].
[59] proposed a model that uses the history of all edits on one feature and improve the positional accuracy of the feature. They use the full history of the OSM database [59]. The model offered by [59] finds all the versions of one feature, then filter the outliers [59]. In the next step, a method based on the Voronoi diagram is applied to find out the best position of the feature [59]. They found out that their method can increase the positional accuracy of the linear features by 14% [59]. The principal idea of this model was to find out the average position for each feature in all the versions available in the full history file of OSM.
[57] asked three different groups to import data into the OSM database. The three groups were students, local community members, and also OSM regular contributors [57]. They were asked to import the data. Then, their Spatio-temporal contribution were analyzed to see how this task can affect their behavior [57]. The results of the research showed that the contributors who had external motivations for contribution did not continue their contribution [57]. For example, most students stopped contributing after the deadline of the course [57]. However, the regular OSM contributors continued their contribution after it [57]. They found out that the import task could be useful for motivating new contributors in OSM [57].
[48] evaluated the life cycle of the contributors in the OSM project. They analyzed the history of all edits that have been done by any contributors to find out when a registered contributor quit the project [48]. They used time series analysis and survival analysis to analyze the behavior of the users of OSM [48]. They realized that the life cycle of the contributors could be divided into three phases [48]. The first phase is called “evaluation,” and it is related to the time that contributors are becoming familiar to the project [48]. The second phase is called “engagement,” and it refers to the duration that contributors continue to contribute after a large number of them quit the project [48]. The last phase is called “detachment,” and it refers to the duration that after a long period of contribution, even the dedicated contributors quit the project [48]. They used the full history dump file of OSM, and they extracted all the changesets. Then, they calculated a rectangle that all the edits of a changeset happened inside it [48]. After that, they extracted the local time of a contribution. Finally, they tried to explain the withdrawal of contributors based on the events that happened during the life of the OSM project [48]. The fact
that the contributions have been made in a very irregular way makes it difficult to find out if the contributor quit or he/she is waiting for a free time to contribute again [48].
The attributes in OSM are, in fact, the tags. These tags are “key = value” pairs that contributors use to describe the features of the map [60]. There is no rulebook or strict regulation for tagging processes. Therefore, contributors select the tags based on their own opinion [60]. One of the researches that tried to analyze the quality of the tags is [60]. [60] tried to answer this question: “to what extent the contributors to OSM follow the general guidelines of tagging” [60]. In order to have a better result, they selected 40 cities from all over the world [60]. They realized that, in most cases, the contributors do not follow the guidelines, and the tags do not comply with the rules of OSM [60]. They concluded that contributors in the 40 cities did not use the same level of annotation [60].
A number of researches tried to analyze the contribution patterns of OSM [61]. [61] found out that the majority of the data of OSM is added by a minority of the contributors, and other contributors did not play a role in data creation. Contribution inequality exists in all the online collaborative communities [61]. [61] tried to answer the following question “how the contribution patterns change during the life of the OSM project?”. They compared the behavior of the two groups of the contributors “the vocal minority” and “the silent majority” [61]. They realized that the size of “the silent majority” group is growing faster than other groups of contributors [61]. They realized that in Germany in 2007, 20% of the community added 95% of the data, while in 2014, just 5% of the members made the same contribution (95%) [61]. They differentiated between the behavior of the contributors in the countries with many imports and the countries with fewer imports such as Germany and France [61]. They concluded that contribution inequality is even higher in countries where a huge amount of data was imported to the OSM database [61].
[9] argued that the reliability of OSM data can be evaluated by measuring the completeness and speed of updates. Thus, they analyzed how complete OSM is and how fast the new information is added to the database [9]. In addition, they argued that people usually add information about the places that they know. Therefore, there should be more contribution in urban areas than in rural areas, and the OSM in urban areas should have higher completeness [9]. They tried to find out the relation between the population and income of a region and the completeness of that region in OSM. They also took into consideration the two following factors: 1) the number of contributors working in each region and 2) the number of days since the last update. They concluded that in the more populated areas, OSM has higher completeness and also it is updated faster [9].
[62] evaluated the completeness and positional accuracy of the point features of OSM in the United States. They used a two-step method to find the corresponding features in OSM and in an authoritative database [62]. In the
first step, they used a spatial join, and in the second step, they manually joined the remaining points [62]. Finally, they understood that the quality of the schools is acceptable and the error is spatially distributed [62].
[63] used a photogrammetric approach to evaluate the quality of linear objects of OSM. First, they used a vector adjustment model to calculate the coordinates of the points. Then they used the Root Mean Square Error (RMSE) to calculate the difference between the coordinates of the corresponding points [63].
Between October 2009 and July 2012, almost 200 OSM users were blocked because of suspicious activities [6]. These kinds of activities that add errors intentionally to the database are a big threat to the main objective of the project [6]. Therefore, [6] proposed a rule-based prototype to find out the potential vandalism activities in OSM [6]. They investigated the detected vandalism activities to discover the suspicious activities [6]. They also took into consideration the methods used in Wikipedia to detect vandalism [6].
The Quality of OSM Roads
Road data is an important part of OSM data, and it was the primary goal of the OSM project. The quality of roads is very important for routing applications or other uses of the data. There are many researches that tried to develop methods and tools to evaluate the quality of the OSM road network. [52] evaluated the quality of linear data in VGI. As [52] argued, the quality of linear data sets can be very important for many cases, such as routing applications. [52] proposed a seven-stage-model to find corresponding features between two linear databases because it is the first step in the quality assessment process. Finally, he used the buffer method proposed by [64] in order to evaluate the positional accuracy of the OSM road data. The main contribution of the thesis of [52] is combining descriptive and geometric information to find corresponding objects in the two databases.
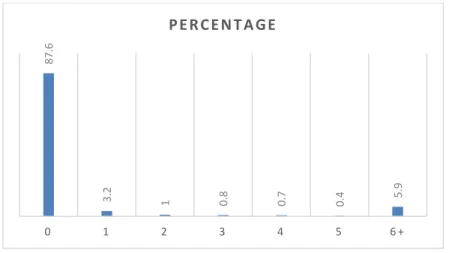
One of the first and most important researches on OSM road data has been done by [39]. He used the buffer method to evaluate the quality of OSM roads. Based on this method, the length of the OSM roads that fall within the buffer of X m around the reference object can be an indicator of the positional accuracy of the OSM roads [39]. He realized that almost 80% of the roads of OSM lie within 6m of the reference road network [39] In the UK in 2010. Moreover, he observed that nearly 30% of the roads of reference data are added to the OSM database in the first 4 years of the project. He found that almost half of the roads in the database of OSM are not named in 2010 [39].
[23] evaluated the quality of OSM roads and buildings in the Ottawa-Gatineau region. He used a buffer method to evaluate the positional accuracy of OSM roads [23]. In this area, in 2018, 70% of the roads were within a distance of 5m from the reference roads, while only 76% of the OSM roads were withing a distance of 10m from the reference roads [23]. He realized that there is no considerable difference between the positional accuracy of the major and minor roads [23]. [23] also evaluated the accuracy of geocoding information of OSM in
Ottawa-Gatineau, and he realized that 96% of this information matches the reference ones. He realized that in 2017, 93% of the reference roads exists in OSM database [23]. Moreover, he found out that there is a surplus of OSM roads in this city in some neighborhoods. This study used OSM full history file that allows investigation into all edits and changesets that exists in the history of OSM. In addition, this study calculated the completeness of buildings based on unit-based and object-based methods.
[65] did valuable research on the quality of the French OSM database. He evaluated geometric, attribute, temporal and semantic accuracy of OSM as well as completeness, lineage, and usage of the data. This research is one of the few researches that investigated almost all elements of data quality at the same time. In terms of the positional accuracy of point objects, he found that the positional error is mostly between 2.5m to 10m. He used Euclidean distance to measure the positional error of point objects. In terms of roads, the positional error was between 5m to 12m in 2010 in France [65]. [65] argues that the number of tags increases linearly with the increase of the number of contributors in each region of France in 2010. [65] observed that almost all of the tags and semantic information of primary roads in OSM French database are correct, while only half of the tags of secondary roads are correct. The mismatch between OSM road types and reference road types can be because of differences in the definition of the two types of the roads. For example, some residential roads may be considered as tertiary in OSM definition of road types. In addition, [65] argues that there is a clear positive correlation between the number of OSM contributors in a region and the number of objects on the map.
[5] evaluated the quality of Canadian road network in 2017. This research has two parts: in the first part the completeness, positional accuracy, and attribute accuracy are evaluated, and in the second part, a statistical analysis is done to measure the correlation between the editing history and the accuracy of OSM data [5]. He observed that 77% of the OSM roads in Canada in 2017 are within 5m of the reference roads, while only 5% of the roads are within the distance of 5m to 10m [5]. [5] observed that there is no significant difference between the positional accuracy of different types of the roads. In 2017, the primary and secondary Canadian roads had a lower tag presence in comparison to local roads [5]. [5] observed that the attribute accuracy of prefix, suffix, and street names is 87%, 71%, and 57%, respectively. [5] argued that only 39% of streets have a correct number of lanes in the OSM database. Moreover, this study found that urban areas received more contribution and more completeness. There is a positive relationship between population and the completeness of the roads. [5] found that there is not considerable relation between the OSM editing history and OSM accuracy.
[59] argued that the edit history of a feature in OSM could give us information about its exact place. Thus, they proposed a five-step algorithm to improve the positional accuracy of road networks of OSM. [59] proposed an algorithm that generates the Voronoi diagram of all versions of a feature in the history of OSM. Then, this Voronoi diagram is used to find the most probable position of the feature. [59] found that this method increases the
![Figure 1-2. Overview of the components of the geographic data quality ([7])](https://thumb-eu.123doks.com/thumbv2/123doknet/2898759.74524/23.918.143.818.254.923/figure-overview-components-geographic-data-quality.webp)
![Figure 1-4. The number of OSM registered users over the time (Source: [47])](https://thumb-eu.123doks.com/thumbv2/123doknet/2898759.74524/28.918.192.721.349.702/figure-number-osm-registered-users-time-source.webp)
![Figure 2-6. The two data sets in the campus of Laval University [95]](https://thumb-eu.123doks.com/thumbv2/123doknet/2898759.74524/54.918.257.664.125.682/figure-data-sets-campus-laval-university.webp)
![Figure 2-8. The completeness of OSM road network in the province of Québec [95], [97]](https://thumb-eu.123doks.com/thumbv2/123doknet/2898759.74524/56.918.251.660.123.677/figure-completeness-osm-road-network-province-québec.webp)