1
This is an Accepted Manuscript of an article published by
Taylor & Francis in Urban Geography on 19 April 2017,
available online:
http://www.tandfonline.com/10.1080/02723638.2017.13141
74
2 Last update: 24/03/2017
DRAFT NOT TO BE QUOTED WITHOUT WRITTEN PERMISSION OF THE AUTHORS
FIGURES AND TABLES AT THE END OF THE ARTICLE
Has the Oil Boom Generated New Problems of Housing Affordability in
Resource-Driven Agglomerations in Canada? A Case Study of St. John’s,
Saskatoon, Calgary, Edmonton, and Fort McMurray, 1991–2011
Sinikka Okkola, M.A. Candidate
Memorial University of Newfoundland
230 Elizabeth Ave, St. John’s, Newfoundland, A1B 3X9, Canada [email protected]
Cédric Brunelle, Assistant Professor1
Memorial University of Newfoundland
230 Elizabeth Ave, St. John’s, Newfoundland, A1B 3X9, Canada [email protected]
1 Corresponding author. Now research professor at Centre Urbanisation Culture Société, Institut National de
la Recherche Scientifique, 385 Sherbrooke Street East, Montréal, Québec, H2X 1E3, Canada,
3
Has the Oil Boom Generated New Problems of Housing Affordability in
Resource-Driven Agglomerations in Canada? A Case Study of St. John’s,
Saskatoon, Calgary, Edmonton, and Fort McMurray, 1991–2011
Abstract
Recent studies focused on Canadian metropolitan areas suggest that growing income inequality underlies problems of housing affordability for low and moderate income earners. This article investigates how unprecedented commodity-led economic growth between 1991 and 2011 has impacted housing affordability in five resource-driven agglomerations in Canada. Housing affordability is analyzed across income quintiles, looking at income, housing costs, tenure, housing quality, and housing debt. Using Statistics Canada Census micro data, we find that low to mid-income earners faced the fastest relative increase in housing costs between 1991 and 2011, combined with small income gains over that period. Homeowners in the lowest income quintiles seem
particularly vulnerable when carrying a mortgage, with economic volatility engendering greater risks of housing market contractions or job loss over time. Whereas previous literature has emphasized housing vulnerability in large metropolitan areas, the results highlight new patterns of risk-laden housing-related vulnerability in resource-driven regions in Canada.
4
Introduction
There is growing evidence that income inequality is correlated with heightened risk of housing affordability problems for lower income earners in Canada and elsewhere (Moore & Skaburskis, 2004; Walks, 2010). Resource booms can lead to increasing income
disparities because their rapid growth, combined with rent-seeking dynamics, generate new well-paying jobs which distort income levels within local labor markets (Goderis &
Malone, 2011). Resource workers’ increased disposable income exert inflationary pressure on housing prices, with the potential to generate new housing affordability problems for some segments of the local market. During the recent and unprecedented Canadian “oil boom”, urban regions such as St. John’s (Newfoundland and Labrador—NL), Saskatoon (Saskatchewan—SK), Calgary, Edmonton, and Fort McMurray (Alberta—AB), have been the scene of exceptional economic growth accompanied by sharply increasing housing prices between 2000 and 2014. These transformations made it increasingly difficult for low and median income earners to access adequate, suitable and affordable housing during this period.
Past research has addressed housing affordability issues in major metropolitan areas in Canada (e.g. Arnold & Skaburskis, 1989; Bunting, Walks & Filion, 2004; Skaburskis, 2004). However, less attention has been dedicated to smaller urban agglomerations that are characterized by resource-led growth. Yet, since Canada’s main exports shifted from manufactured goods towards petroleum and mineral production in the mid-2000s, urban agglomerations serving expanding extraction activities became the growth engines and epicenters of the Canadian economy. How have these rapid transformations impacted income distribution and housing-related socioeconomic dynamics in these agglomerations?
5 Housing affordability dynamics are not without consequences. Housing has a fundamental importance for the physical, social and economic well-being of individuals and families. Affordability problems are hence at risk of generating new vulnerabilities, with the specter of larger housing-related socioeconomic polarizations taking place over time (Walks, 2013, 2010).
This paper explores the evolution of housing affordability in five resource-driven urban agglomerations in Canada. Using Statistics Canada’s Census micro data, the article investigates the impacts of income and housing costs changes on housing affordability for different income groups. Housing affordability is analyzed across income quintiles for four dimensions between 1991 and 2011, namely housing tenure, cost to income ratio, housing quality, and housing debt. The paper provides empirical evidence that low to mid-income earners have faced the fastest relative increase in housing costs, combined with the smallest relative income gains over the period studied. Homeowners in the lowest income quintiles are particularly vulnerable when carrying a mortgage, with economic volatility engendering greater risk of housing market contractions or job loss over time. The paper concludes that resource booms are prone to generate new housing-related vulnerabilities for low to mid income segments of the population in extractive urban agglomerations.
The article is arranged as follows. The first section briefly discusses housing affordability in the context of resource-driven agglomerations in Canada and elsewhere. The next section describes the data and methodology used in the study. Results are then presented in three distinct subsections: (1) incomes, (2) housing costs, and (3) housing affordability. Finally, we conclude with a discussion of the relevance of these findings in the context of existing literature and policy.
6
Housing Affordability in Resource-Driven Agglomerations
Studies on extractive regions emphasize that economic booms linked to commodity prices engender rent-seeking dynamics and segmented labor markets characterized by unequal income distributions over time (Baland & Francois, 2000; Goderis & Malone, 2011). Increased income levels in resources and related support activities create rising regional demand for labor and, as such, housing. Booming resource regions are hence at greater risk of facing increasing housing costs over time, with differentiated effects among income groups. New vulnerabilities can further impact homeowners, especially the ones carrying a mortgage, as the possibility of a commodity-led economic downturn develops. While affordability problems can be interpreted as a result of income disparities taking place in the labor market, the differentiation of housing outcomes across income distributions also implies that processes of polarization may additionally take place within the housing market.
These dynamics are not entirely new. Resource-driven economic growth has previously been associated with rapidly rising housing prices in various countries around the world (Farren, 2014; Harris, Lloyd, McGuire & Newlands,1986; Randall & Ironside, 1996). Nevertheless, housing has seldom been a main topic of research for resource-driven urban agglomerations. Notable exceptions are papers on the interaction between the labor and housing markets in Aberdeen, Scotland (Lloyd & Newlands, 1990); studies on housing-related impacts of major resource developments in Darwin, Australia (Ennis, Finlayson & Speering, 2013); and other studies that focus on vulnerable populations in peripheral and rural areas, such as indigenous groups or people living on fixed incomes in resource communities (Haslam, McKenzie & Rowley, 2013; Ryser & Halseth, 2011). A
7 common finding is that resource-driven economic growth does not benefit all segments of the population, with housing affordability stress taking place among the unemployed, and low to middle income earners (Ennis, Finlayson & Speering, 2013). However, past research offers an incomplete picture, often limited to one dimension of the resource-related housing affordability problem. For instance, studies have so far provided only partial insights as to how affordability varies between renters, mortgaged homeowners, and across income groups. Prior research has also been fixed in time and has not looked beyond traditional measures of affordability. As a result, there are fundamental aspects currently lacking that would inform the discussions on housing policies in these agglomerations.
Several mechanisms underlie the affordability problem in extractive regions.
Resource booms generate sudden hikes in housing prices because local supply often cannot satisfy the quick increase in demand. Growing disposable income further exerts inflationary pressures on housing prices, with rising demand on real-estate properties positively
impacting rental prices and decreasing vacancy rates (Agnello & Schuknecht, 2011). This is also an ideal environment for speculative behaviors frequently associated with resource booms, with the greatest impacts taking place when housing markets cannot rapidly adjust to the sudden escalation of demand (Malpezzi & Wachter, 2005).
Although rising housing prices are partially counterbalanced by increased local income levels, the capital-intensive nature of resource industries often translates into limited employment opportunities. Resource extraction development in a region can add or alleviate existing income inequalities, depending on the previous circumstances in the region and what spillovers it generates (Fleming & Measham, 2015). Yet, it often
8 limited to a small segment of the population (Harris et al., 1986). Socioeconomic
polarizations can further arise from new gendered divisions, because most resource-related employment is for men (Randall & Ironside, 1989). In broad terms, resource-related economic growth tends to spill over into construction and technical services, and generates a higher demand for food, retail and accommodation services (Marchand, 2012). For instance, most of the new employment opportunities for women in Newfoundland in the 2000s—a period dominated by fisheries and oil developments—were created in the low-paying service sector (Cadigan, 2012). As a result, income gaps between unskilled service workers and those working in the resource sector make it difficult for low-income earners to be competitive in the local housing market.
In addition, recent general changes in the labor market and the social landscape impact household incomes, particularly in the low end of the income spectrum. As in many other countries, the Canadian labor market has gone through major restructurings.
Manufacturing and extraction industries have declined, while a precarious new flexible labor market dominated by highly paid skilled professionals and a low paid service sector has emerged (Walks, 2010). Unemployment and loss of manufacturing jobs have
contributed to widening income gaps (Bolton & Breau, 2012). Low income earners are the most affected because the federal government introduced cutbacks to social assistance programs, health care, education, and subsidized housing, downloading many of these responsibilities to the provinces in 1995 (Hulchanski, 2004b). Moreover, since the mid-1990s, the Canadian tax and transfer systems have not been able to redistribute incomes the way they did in the 1980s and the early 1990s (Frenette, Green & Milligan, 2009).
9 This study fills a knowledge gap by exploring temporal patterns of housing
affordability in resource-driven urban agglomerations that became the new epicenters of the Canadian economy during the past oil boom. We seek to find answers to the following research questions: 1) Are there specific trends in income and housing costs which
contribute to an increasing risk for housing affordability problems between 1991 and 2011? 2) If so, what patterns of housing-related vulnerability are emerging in these urban
agglomerations?
Housing is not only a basic human need. The lack of affordable housing has adverse effects on the livability of a community if lowly paid service sector employees cannot find housing they can afford (Ennis, Finlayson & Speering, 2013). A deficient supply of affordable housing influence population retention, and it has also been linked to a slowdown of employment growth (Chakrabarti & Chang, 2015). Recent research on housing affordability in resource-driven communities in Canada remains limited. This research therefore makes an important contribution by addressing a topical and under-researched contemporary concern.
Dimensions and Indicators of Housing Affordability
Housing affordability entails that a household is able to occupy an adequate and suitable dwelling and still have enough disposable income for non-housing necessities and savings. Researchers frequently use a shelter cost to household gross income ratio as a measure of housing affordability. Housing is considered affordable if this ratio is below a pre-defined threshold, usually set to 30% (Bogdon & Can, 1997). Although the ratio combines the two most important elements of housing affordability, namely income and housing costs, it
10 inevitably leaves out conditions that have a significant impact on housing affordability outcomes, such as remaining disposable income (Stone, 2006) and household structure (O’Dell, Smith & White, 2004). A household spending fewer than 30% of its income on housing may be burdened by its housing cost, whereas another household spending more than 30% or temporarily even 50% may still be able to pay for the non-housing necessities (Bogdon & Can, 1997; Rowley, Ong & Haffner, 2015). Yet, most scholars rely on the housing cost to income ratio because it is simple to calculate and offers a comparable indicator over time and in various contexts (Hulchanski, 1995). It also has a long history both in the social sciences and as a policy tool, with some authors arguing there is no better alternative (Heylen & Haffner, 2013).
However, housing affordability is too complex a concept to be expressed only as a cost to income ratio. In the literature, this ratio has often been coupled with overcrowding and structural adequacy of the dwelling. Furthermore, housing affordability for
homeowners involves additional dimensions not present for renters. Housing value (or market price) to income ratios link residential property market outcomes to those of the local labor market, while providing a long-term perspective on housing affordability (Gan & Hill, 2009). Most homeowners need to fund their house purchase by contracting a
mortgage at a given rate, with the ability of doing so known as “purchase affordability” and debt service known as “repayment affordability” (Gan & Hill, 2009). Although repayment affordability can be compared to renters’ housing affordability, indicators for mortgage debt and housing equity provide a more complete assessment of housing affordability for homeowners. Therefore, what housing affordability means, and how it is measured, is contingent on housing tenure.
11 Housing tenure choice is constrained by household savings, income level and credit history, the lack of which preclude a transition to homeownership. The main alternative to homeownership is private rental tenancy. The rental market is dominated by low and moderate income earners who are more likely to be burdened by their housing costs than homeowners (Hulchanski, 2004a). Meanwhile, those who cannot afford paying market rents will be confined to a small social housing sector in decline. This sector is comprised of government subsidized social housing, non-profits, and cooperative housing
(Hulchanski, 2004a). Housing affordability in the social housing sector is often warranted by asking rents that are geared to income.
Ownership occupancy is associated with perceived benefits, but also real
obligations and different risks than those of renters. Homeownership provides a sense of social, economic and physical security (Smith, 2015). Moreover, a housing purchase is not only about acquiring a home; it is also an investment and a safety net to secure one’s retirement (Yates & Bradbury, 2010). However, scholars have started questioning if homeownership has been correctly identified as the source of all the social and financial benefits it has hitherto been associated with. Debt service is not the only housing cost for homeowners. There are also property holding costs such as taxes, insurance, utilities, maintenance costs and emergency repairs. While transition to homeownership is generally regarded as a gateway to improved wealth and social status, homeowners in low or
moderate income brackets are more likely to be burdened by their housing costs, and less likely to reap financial and social benefits from homeownership than their wealthy counterparts (Foster & Kleit, 2014). Therefore, policy attempts to make homeownership
12 accessible for low-income earners can be misguided if the sustainability of this tenure for these individual households is not considered (Drew, 2013).
Both housing affordability and tenure choices are affected by policies. Current tax incentives and financial deregulation in Canada encourage supply and demand of housing for ownership occupancy, providing scant support to the rental housing sector. As a result, there has been very little rental housing development in all of Canada since the 1990s, when federal regulations made it more profitable to invest in condominium development than private rentals (Drummond, 2004). Much of the existing rental stock has been demolished, rehabilitated for more high-end use or converted into condominiums. Meanwhile, prospective homeowners can access mortgage funding at low interest rates. Some of them will purchase overly large homes because of the popularity of housing as an investment. Growing numbers of low and moderate income earners also wants to become homeowners, and they all contribute to rising housing prices (Gan & Hill, 2009).
Increasing house prices lead to higher levels of indebtedness. Young people and low income earners often carry a disproportional share of this debt (Walks, 2013). They run a risk of experiencing mortgage payment stress or even default if household income decreases or interest rates rise (Smith, 2015). In Canada, one out of five indebted households have less than $5,000 in savings to handle unexpected costs (Alexander & Jacobson, 2015). This is particularly risky in resource-driven economies, which are prone to reflect the cyclic variation of commodity prices, with economic downturns and rising unemployment following periods of prosperity. The market value of houses can also decrease (Smith, 2015), and the negative equity can make homeowners unable to move elsewhere to search for employment (Chan, 2001).
13 Meanwhile, housing affordability has replaced housing quality as the main focus of housing research because housing affordability has deteriorated while housing quality has improved (Bogdon & Can, 1997; O’Dell, Smith & White, 2004). Yet, housing quality problems still exist. For example, research has found negative health outcomes associated with housing quality problems such as dampness and mold, lack of insulation, improper heating, ventilation, and overcrowding. Furthermore, housing quality research can overlap with poverty research because spatial concentration of low-income populations tends to create disadvantaged neighborhoods. A serious consequence of the lack of affordable housing is that low and moderate earners may be able to afford their housing only by compromising in quality, amount of space, and proximity to amenities.
Data and Methodological Approach
In this study, housing affordability is approached through interrelated dimensions of income, housing costs, the type of tenure, housing quality, and housing debt. Income earned in the labor market impact housing tenure choices and housing quality, while also influencing housing costs and debt. Each of these four dimensions constitutes a potential source of housing-related vulnerability, and each of them has been linked to a risk of increasing socioeconomic polarizations, as indicated in the literature review.
The research relies on the use of Statistics Canada’s quinquennial census microdata files (1991–2006) and National Household Survey 20112. In our analysis, we use
households as basic units because a household, by definition, is a group of people who occupy the same dwelling (Statistics Canada, 2016). These are limited to non-farm
14 households living in private dwellings because shelter costs for farm households cannot be separated from those of the agricultural operations (Statistics Canada, 2016). Collective housing (such as lodging houses, institutions and hotels) and band housing were also excluded because they provide no data that are comparable to renters and owners in private dwellings.
Uncertainty concerning the quality of the NHS 2011 data should be taken into account3. The change of name from Census to the National Household Survey in 2011
reflects a crucial difference between the respective datasets. Statistics Canada had an established practice of conducting a detailed national census every five years, and this mandatory questionnaire provided extensive and representative socioeconomic data on the Canadian population until the government replaced it with a voluntary National Household Survey in 2010. Unfortunately, there is no study on potential effects of this change and Statistics Canada has advised caution when using NHS 2011 data for longitudinal analysis (Statistics Canada, 2016). Various scholars argue that a bias was introduced because non-respondents are not likely to be a similar population as those responding to the survey (Green & Milligan, 2010). Although the data quality of NHS 2011 is criticized by social scientists and economists, they are still the most recent census scale data available after the census of 2006. However, the direction of potential non-response bias should be anticipated in longitudinal analyses. It is reasonable to assume that the results for 2011 display
increasing real income levels, in accordance with the previous comparisons between tax filler and NHS data (Hulchanski, Murdie, Walks & Bourne, 2013). Unfortunately, this
3 Statistics Canada estimates that a non-response bias leads to an underrepresentation of lower income groups
in the non-mandatory 2011 NHS as compared to previous Census years that are mandatory. Prior periods to 2011 offer more robust estimations of real changes, while there could be a potential underrepresentation bias among lower income groups in 2011.
15 increase is likely to be overstated for low-income earners and understated for high income earners (Green & Milligan, 2010), which result in seemingly lower income disparities. In this analysis, trends are hence provided for all years, but results are interpreted with the potential directionality of this bias in mind.
Trends and patterns of housing affordability are analyzed by income quintiles within the selected urban agglomerations. The sum of total gross incomes of all members of a household is used to rank and aggregate individual households into five income quintiles, excluding households with income lower than $1,000. We review income evolution and all indicators of interest for each income quintile separately because this methodology, unlike aggregated average and median values, exposes the particular impacts in different positions of the income spectrum. All dollar amounts are adjusted for inflation using Bank of Canada rates to 2005 dollars. Thereby the real purchasing power of households is anchored to the 2006 data of the last mandatory census before it was replaced with a voluntary national household survey.
The Census and National Household Survey datasets provide housing costs as gross rent for renters and owner’s major payment for homeowners. In both cases, housing costs refer to the total average monthly payment to secure shelter, and includes electricity, oil, gas, coal, wood or other fuels, water and other municipal services, cash rent, and, where applicable, property taxes, mortgage payments, and condominium fees (Statistics Canada, 2016). Dimensions of housing affordability are operationalized as follows, based on census and NHS variables: (1) Tenure as the percentage of homeowners in each income quintile; (2) Housing cost to income ratio as the percentage of households using 30% or more of their gross income on housing; (3) Debt as the percentage of homeowners with a mortgage
16 and housing value-to-income ratio; and (4) Housing quality as the percentage of households occupying a dwelling that is in need of major repairs or too small for the size and structure of the residing household.
Description of Selected Resource-Driven Agglomerations
The late 2000s has seen an unparalleled commodity boom fueled by oil and gas and mineral extraction industries. This has pushed forward resource-driven urban agglomerations as the epicenters of economic growth in the Canadian economy. A prime example is St. John’s, Newfoundland, which ranks as the fifth fastest growing Census Metropolitan Area (CMA) for its GDP between 2001 and 2009 (Brown & Rispoli, 2014), thanks to its new role as a command and service center in a province that has recently experienced an offshore oil boom. Other urban agglomerations with expanding oil-based economies and serving a similar role during this period include the urban service area Fort McMurray in the regional municipality of Wood Buffalo (hereafter referred to as Fort McMurray) in Alberta, and the Albertan CMA Edmonton. Calgary, the oil capital, is added to represent a region devoid of extraction industries, but equipped with financial and other specialized service industries. These regions were all selected because of the prominent share of oil-related employment and royalties within their provincial economy.
Saskatoon is added to offer a perspective on resource-driven, but less oil-dependent mid-size CMA. Saskatoon has experienced a phenomenal growth related to its combined oil and potash commodity boom, with its GDP growth between 2001 and 2009 only second to Regina (Brown & Rispoli, 2014). Unlike Regina, Saskatoon experienced a large
17 between 2001 and 2009, very much like St. John’s did. The location of the five
agglomerations is provided in Figure 1.
INSERT FIGURE 1 HERE
These five urban agglomerations have different economic profiles (Table 1). Calgary and Edmonton are large metropolitan areas that are among the fastest growing in Canada, ranking 6th and 2nd among Canadian CMAs for GDP growth, with high population
increase between 2001 and 2009. Saskatoon is less than quarter of their size, but it is also facing significant population growth because of its strong economy. The smallest CMA, St. John’s, is one of the oldest English settlements in North America, although today it is a small metropolis challenged by its geographic location far away from major metropolitan areas. Despite important economic growth, its population increase is limited. The most important contributor to population growth in the St. John’s census metropolitan area comes from people moving from rural Newfoundland to the city. Fort McMurray, the epitome of a modern boomtown, is also remote, but lucrative employment opportunities kept attracting people during the oil boom, some of this occurring through fly-in, fly-out arrangements (Keogh, 2015; Storey, 2010).
Resource industries fuel economic growth in all five agglomerations. While Fort McMurray is a Census Agglomeration (CA), the others are Census Metropolitan Areas (CMA) ranking in the top six CMAs for their GDP in 2009 (Table 1). Fort McMurray is adjacent to resource industries in the Athabasca bituminous sands, while St. John’s is a
18 provincial hub of offshore oil extraction. Edmonton serves as a regional center for
petroleum industries and mining, as does Saskatoon for potash and oil. Calgary, on the other hand, has become an oil-related corporate city in which many head offices and
producer services are located, and as such it has experienced very strong growth in the form of capital investment, employment growth, and in-migration. Edmonton has a fairly
diversified economy, and its location—about a five-hour drive from the Athabasca
bituminous sands—has also made it the city of choice for many of those employed in Fort McMurray (Keogh, 2015).
INSERT TABLE 1 HERE
Patterns of Housing Affordability in Resource-Driven Economies Household incomes
For the purpose of this study, household income is defined as gross income before taxes, adjusted for inflation in 2005 constant dollars. For comparability purposes, patterns for the selected urban agglomerations are benchmarked against CMA and CAs outside Toronto, Montreal, and Vancouver—the three largest metropolitan areas in Canada which have distinct housing markets. The evolution of median incomes across the five areas shows that income levels and growth remained above the national benchmark for the entire period between 1991 and 2011, with the exception of St. John’s and Saskatoon, which only exceeded the Canadian average in 2011 (Figure 2). Median incomes in Calgary and
19 Edmonton exhibit significant gains after 1996, with Calgary moving from $57,248 to about $81,665 in 2011 and Edmonton from $51,937 to $78,683 over the period. However, the fastest increase by far has taken place in Fort McMurray, with incomes passing from $64,739 in 1991 to $160,856 in 2011—ending considerably above the median income of $61,521 found in the reference CMA/CAs. Saskatoon and St. John’s show a relatively modest increase until 2006, then they sharply increase to surpass the Canadian median reference income, with respectively $66,298 and $68,032 in 2011.
INSERT FIGURE 2 HERE
Figure 3 offers additional insights into the underlying changes in the distribution of income, looking at real income growth per income quintile, expressed as compound annual growth rates (CAGR). Trends between 1991 and 2011 are provided along additional decennial periods (1991–2001; 1996–2006; 2001–2011), keeping in mind the
aforementioned data limitations of the 2011 NHS4. Unsurprisingly, the results show that
revenues increased faster in the five agglomerations than in CMA/CAs outside Montreal, Toronto, and Vancouver—a trend shared across all income quintiles from 1996 onward. This supports the idea that resource-led GDP growth has translated into higher income gains in these agglomerations over the period. However, these trends are not homogenous
4 Statistics Canada estimates that a non-response bias leads to an underrepresentation of lower income groups
in the non-mandatory 2011 NHS as compared to previous Census years that are mandatory. Prior periods to 2011 offer more robust estimation of real changes, while there could be a potential underrepresentation bias among lower income groups in 2011.
20 across income quintiles. The fastest increase is systematically found for the top and mid-high income quintiles in almost all five agglomerations, especially in the earlier 1991–2001 and 1996–2006 periods when resource-led economic activity was developing—a result that may not be unrelated to possible non-response bias of the 2011 NHS data. Surprisingly, Fort McMurray displays a trend which diverges from other agglomerations and the national average, with the highest increase taking place in the lowest income quintiles. One
explanation may be the labor-intensive nature and scale of oil sands extraction activities, which rely on several trades’ jobs and a growing need for support service activities.
INSERT FIGURE 3 HERE
To account for the evolution of income disparities, income ratios are calculated based on median income of top to bottom and mid-high to mid-low income quintiles. Changes in these disparities between 1991 and 2011 are displayed in Figure 4. Consistent with income trends, these results show that mid-range income inequalities have decreased in Saskatoon and Edmonton. Mid-range income disparities have only increased in St. John’s and Calgary, which indicates a lack of well-paying employment in the lowest quintiles. Top to bottom disparities have also increased in Saskatoon and Edmonton, although only slightly. Greater economic diversity in these two agglomerations may offer an explanation for this outcome. Contrasts are found in Fort McMurray, with its large decrease in disparities, and St. John’s, with inequality increases over the period surpassing the national benchmark and other agglomerations. One explanation lies in the structure of
21 the oil sector in both agglomerations. Offshore oil in St. John’s is capital intensive,
requiring a limited number of highly skilled jobs, but bituminous sand extraction in Alberta is labor intensive. Saskatoon with its more diversified economy appears to provide
opportunities for different categories of workers, just as Edmonton does, partly due to its relative proximity to the Athabasca oil sands. Calgary exhibits major metropolitan
dynamics, with large income differences between quintiles, particularly for those with top incomes. Although levels of mid-range income disparities are on the national benchmark level or below for all these agglomerations, results show that the top to bottom disparities are still very high. Median income in the fifth quintile is 8.3 times higher than that for the first quintile in St. John’s (6.7 times in Fort McMurray), compared with a median income 8 times larger in other CMA/CAs outside the largest three metropolitan regions in Canada.
INSERT FIGURE 4 HERE
Housing Tenure
There are only two housing tenure forms in our research: owner occupancy and rental tenancy. To allow a better view of how homeownership rates vary across income distribution, we provide details of these indicators for the three lowest income quintiles, while also differentiating homeowners carrying a mortgage. The results are shown in Figure 5. Segmentation of ownership rates across income quintiles shows that the bottom 20% (Q1) systematically exhibit the lowest share of homeowners (35% in the Canadian benchmark in 2011), increasing in the mid-low (58%) and median quintiles
22 (74%). Ownership or rental rates in the five CMAs are similar to the Canadian benchmark, although there are important differences when looking at mortgaged ownership as a
proportion of homeowners, which are all exceeding the Canadian group of reference in 2011.
Looking at changes over time, the results show that homeownership rates have grown more steadily for the bottom 40% in Saskatoon, Calgary and Edmonton. There was a significant drop in the rate of homeownership in St. John’s in 1996 for the lowest income quintile. It has since slightly recovered but did not reach the 1991 level in 2011. Fort McMurray also had below national benchmark growth for the bottom 40%, while the homeownership rate has increased significantly in other agglomerations. Home ownership in the second income quintile has a high growth rate, ending above 60% in Calgary and Edmonton. St. John’s and Saskatoon remain below the national level when it comes to the homeownership rate in the bottom income quintile.
INSERT FIGURE 5 HERE
Despite slower growth rate for some income quintiles, the absolute number of mortgaged homeowners exceed the national benchmark in all resource-driven
agglomerations (Figure 6). For example, the median income quintile in Fort McMurray had 68% homeowners with mortgages and St. John’s 52%, whereas CMA/CAs outside
Montreal, Toronto, and Vancouver had an average of 45% in 2011. Fort McMurray shows the highest increase among all CMAs, significantly above the Canadian benchmark. Fort
23 McMurray is growing fast during periods of resource booms and the newcomer are likely to buy a house rather than settle for scarce and expensive rental housing, making established residents without mortgages a minority. High levels of rental costs are found in these agglomerations at times of resource booms, which is analyzed in the following section.
INSERT FIGURE 6 HERE
Housing Costs
Median housing costs in the five CMAs remained above the Canadian benchmark for both renters and mortgaged homeowners between 1991 and 2011, with few exceptions (Table 2). Renters had the fastest relative cost increase over the period, growing far beyond the
Canadian group of reference. The most striking example is Fort McMurray, which shows an incredible and sudden hike in housing costs after 2001, passing from a median monthly cost of $868 in 1991 to $2,638 in 2011 for mortgaged owners, and $570 to $2,120 for renters, respectively representing 204% and 272% growth over the period. In comparison, the CMA/CAs outside the three largest metropolitan areas in Canada had a 60% and 71% increase over the same period, with median monthly costs respectively of $1,282 and $898 in 2011. While situated below Fort McMurray, most other studied CMAs also exhibit costs and increase above mid-size Canadian CMA/CAs, with renters facing the highest
intensification over the period. St. John’s differs in that respect, with increases below the Canadian benchmark group between 1991 and 2001—an outcome associated with the local economic crisis fostered by the 1992 cod moratorium. Apart from St. John’s, these trends
24 provide a consistent explanation for the highest increase in homeownership rates in these agglomerations, as seen in Figure 6. High rental costs, it appears, have decreased the opportunity cost of acquiring a home in resource-driven urban agglomerations.
INSERT TABLE 2 HERE
Figure 7 provides additional details on changes in housing costs by income quintile between 1991 and 2011. Results show that housing costs for owners have increased
significantly faster in the bottom 40% income quintile than the rest of the population. This increase has been above the national benchmark in all agglomerations. However, we can see that most of the hike in housing prices has taken place between 1991 and 2006—the 2011 data possibly underestimating the hikes in costs due to the aforementioned limitations of the NHS. It also becomes evident that the top income earners have generally experienced the lowest increase in housing costs. Those who own their houses outright have much lower absolute housing costs than those with mortgages—a distinction not directly shown in Figure 7. However, housing costs still increase because other factors are weighted in, such as rises in energy prices or property taxes, which are adjusted for inflation over time. As such, increases in relative housing costs could, in some cases, be larger than that of mortgaged homeowners, whose housing cost increase was mitigated by drastically falling interest rates in the 2000s.
25 The evolution of rental costs across income quintiles shows a very similar pattern from that of owners, with Fort McMurray exhibiting a very high increase in contrast to other CMA/CAs (Figure 8). Renters in the lowest quintiles have systematically faced higher increases in housing costs in all resource-driven agglomerations. St. John’s is an exception with its relatively low increase. With the exception of St. John’s, the bottom 40% have had the highest rental cost increases, and the top income earners the lowest in the selected urban agglomerations. This pattern differs from that of Canada, with CMA/CAs outside the three largest metropolitan areas growing faster in the highest quintiles over the period.
INSERT FIGURE 8 HERE
Housing Affordability
Housing affordability is analyzed for the bottom 40% of the income distribution, looking at the prevalence of household spending 30% or more of their income on housing costs. The results indicate that about half of the low income earners were facing housing affordability problems over the period in resource-driven agglomerations, while this proportion was much lower in Canadian CMA/CAs outside Montreal, Toronto, and Vancouver
representing about 40% (Figure 9). However, it is difficult to discern trends taking place over time, as there appears to be a general decrease in the proportion of households facing affordability problems in 2011, which contrasts with a steady increase between 1991 and
26 2006. Fort McMurray shows the most volatility, followed by Calgary and Edmonton, although with a lower amplitude. In comparison, Saskatoon exhibits a growing trend that stagnates in 2006 before declining in 2011. In St. John’s, the significant drop from 2006 high levels to what is recorded in 2011 is remarkable.
One aspect to consider in these results is the possible directionality of the non-response bias in the 2011 NHS. Statistics Canada warns that lower-income households can be underrepresented within the population income distribution in the NHS, hence affecting longitudinal trends when compared with prior census years that do not suffer from non-response bias. However, while we can anticipate that problems of housing affordability may not be retracting as quickly as it appears in the data because of that limitation, there are several other factors that may help to explain the decrease observed in 2011. These may stem from the fact that these results include all types of tenures, hence they include several elements affecting results in different ways, such as by decreasing interest rates or
increasing heating or energy costs.
INSERT FIGURE 9 HERE
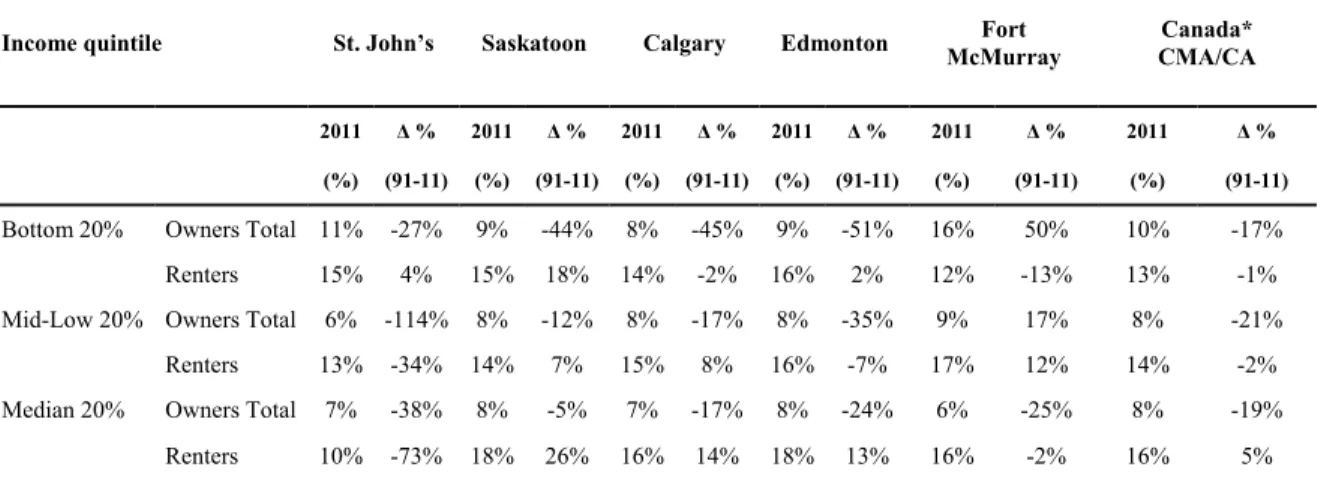
To get a more comprehensive picture of the variability in housing affordability, we provide the detailed shares of households for each type of tenure across the bottom three income quintiles in the final year 2011, also looking at changes in percentage over the
27 1991–2011 period (Table 3)5. Unsurprisingly, there is a much greater prevalence of
affordability problems within the lowest income quintiles, while the proportion of households facing this situation decreases as income distribution increases. The highest shares of households facing housing affordability problems are found among mortgaged homeowners in the bottom quintile, representing about 90% in this category—a result found in all CMAs and exceeding the national benchmark of 79% in 2011. These numbers are not trivial when considering the above-average increase in homeownership and given the greatest economic vulnerability in these agglomerations. About half of homeowners face a similar situation within the second income quintile, while this proportion decreases in the median quintile. Renters are the second most impacted by affordability problems, followed by homeowners without a mortgage.
We anticipated that renters were most impacted by affordability problems over time. However, increases in affordability problems remained limited for renters in the lowest quintile, with improvements taking place in St. John’s (-1%) and Fort McMurray (-6%), although there are important increases in all CMAs in the second lowest 20%, only St. John’s has a decrease in line with the Canadian benchmark CMA/CAs. Still, in the bottom quintile in 2011, 65% of renters in St. John’s, 76% in Saskatoon, 71% in Calgary, 75% in Edmonton, and 69% in Fort McMurray were dedicating 30% or more of their income to housing. For owners, the situation has become even more alarming, with an increasing number of owners experiencing a potential housing affordability problem in the two bottom income quintiles. This proportion increased by as much as 121% in Fort McMurray, with a
5 To explore the extent of the potential non-response bias from the 2011 NHS, the table was also produced
with 2006 as the end period (provided in Appendix). Although numbers are different, the overall conclusions about the relative shares and evolution are consistent between the two periods.
28 total of 65% of homeowners facing affordability problems in 2011. This can partly be explained by a growing number of mortgaged households. For some owners, increasing costs of energy, taxes, and other non-mortgage expenses add up to a significant share of total housing costs, with important implications for households on fixed income.
INSERT TABLE 3 HERE
In the median income quintile, practically all resource-driven economies have improving housing affordability outcomes, with the exception of renters in Saskatoon and Edmonton. Interestingly, the Canadian numbers for renters and owners are still showing a trend of deteriorating housing affordability. The favorable income development in
resource-driven agglomerations is a reason why the share of households using more than 30% of their income for housing decreases faster in resource-driven economies than it does for the Canadian average as income levels increase. In this income quintile, less than five percent of renters in these resource-driven urban agglomerations use 30 percent or more for housing, and the rest of the households doing so are homeowners.
Housing Quality
Unsurprisingly, housing quality problems are less prevalent than affordability problems and generally 15% or less of the low income earners were afflicted by housing quality problems over the period (Figure 10). Regardless of 2011, the trend appears to be towards a declining number of housing quality problems, with a particular decline
29 displayed by Fort McMurray. With the exception of Fort McMurray, all resource-driven urban agglomerations appear to have a level of housing quality problems that is below the national level. As with housing affordability, these results can be associated with a possible directionality of the non-response bias in the 2011 NHS. Lower income households are more likely to be afflicted by housing quality problems and may be underrepresented within the population income distribution in the NHS, hence affecting longitudinal trends when compared with prior census years that do not suffer from non-response bias.
INSERT FIGURE 10 HERE
Detailed shares and changes of owner and renter households across the bottom three income quintiles are provided in Table 46. Unsurprisingly, results show a greater prevalence
of housing quality problems for renters, and the proportion of households facing this situation generally remains the same as we move up the income distribution. In contrast, homeowners are less likely to deal with housing quality problems, and the likelihood of these problems decreases as their income increases.
INSERT TABLE 4 HERE
6 To explore the extent of the potential non-response bias from the 2011 NHS, the table was also produced
with 2006 as the end period (provided in Appendix). Although numbers are different, the overall conclusions about the relative shares and evolution are consistent between the two periods.
30 There are significant improvements in housing quality, particularly for St. John’s. However, while having similar or slightly better housing quality than the national
benchmark, the high prevalence of housing quality problems in resource-driven
agglomerations even to up to mid-income levels suggests that these problems are more widespread than expected. It is difficult to evaluate if households compromise their housing quality to improve their housing affordability, but the trends for the mid-low income
quintiles point in that direction. The ratio of the number of households with a cost problem only to the number of households with a quality problem only decreases drastically from the bottom income to mid-low income quintile. This is not necessarily because of a choice that renters make. Housing affordability also improves with increasing income level and renters may be constrained as to their access to adequate rental housing.
Debt and Housing Affordability
Resource-driven agglomerations face an increase of mortgaged homeowners that largely exceeds the Canadian average in the reference CMA/CAs. This suggests that household debt may become a growing issue in these locations. The house price to income ratio may not measure true indebtedness of a household, but its value show what debt to income ratios this household would face if the homeowner(s) were to buy their home today. This ratio is an established alternative measure of housing affordability, and when exceeding a threshold value (3.1) has housing stress implications for a household.
31 Looking at house value to income ratios for the median income quintile (Figure 11), we find that homeowners in resource-driven agglomerations have had a significantly higher increase in debt ratios than other Canadian CMA/CAs outside Montreal, Toronto, and Vancouver, with absolute values systematically above the critical threshold of 3 in 2011. In fact, most have seen this ratio increase between 2006 and 2011, which was the peak of resource-related economic development within the studied period. Albertan housing markets appear to have had the most severe increase in indebtedness, with Saskatoon and St. John’s also showing sharp increases exceeding the critical limit and national benchmark in 2011. If any, the directionality of the bias in the 2011 NHS is further likely to
underestimate these trends taking place over time. Not shown in the figure is the variability of indebtedness across income distribution. Lower income quintiles have significantly higher ratios, ranging from 9.3 (Fort McMurray and St. John’s) to 11.6 (Calgary). While median income earners may have some difficulty if they were to buy their homes again, it would be impossible for those within the lower income quintiles to qualify for a mortgage of this magnitude.
Looking at changes over time, we can see that housing values have increased faster than incomes everywhere (Figure 12). St. John’s, Saskatoon and Fort McMurray show particularly important escalation between 1991 and 2011, well above the national benchmark. There are also differences in the change in indebtedness levels taking place across income quintiles. The bottom and the mid-low income quintiles appear to have the largest increases in all locations, with Fort McMurray showing very high increases in indebtedness in the bottom 20% quintile. St. John’s and Calgary also exhibit an uneven
32 distribution of debt between quintiles, although other locations such as Saskatoon and Edmonton exhibit less variability.
INSERT FIGURE 12 HERE
Discussion
Housing affordability in general became a problem in Canada in the 1990s. The major metropolitan areas in Canada are well known for their unaffordable housing (Bunting et al., 2004), and thus have an impact on the aggregated national housing affordability. However, our research points out specific trends in affordability, looking at its evolution across specific dimensions of housing tenure, housing costs to income, and housing debt which all indicate that there are new patterns of housing affordability problems emerging in smaller, resource-driven economies. Levels of this vulnerability are not exactly the same, but they compare to the patterns described in larger city regions in Canada.
The results presented above show that housing affordability patterns in all selected urban agglomerations have been influenced by resource industries, as indicated by housing costs that have increased rapidly for both owners and renters. The most significant increase in housing costs has occurred in Fort McMurray, which is also the urban agglomeration with the greatest dependence on the oil industry among the studied agglomerations. Housing costs for both renters and owners have also increased in relatively higher
33 watershed between two very different positions in the affordability chart. Most household spending more than 30% of their income on housing in the bottom income quintiles are renters. However, a greater share of mortgaged low income earners can stay above that benchmark with their mortgage payments and other housing-related costs.
Housing prices have increased, but housing costs for homeowners are not only influenced by house prices; they’re also affected by various macroeconomic factors.
Owners with a mortgage initially experienced very high housing costs because of the record high inflation and interest rates in the 1980s which gradually decreased in the 1990s to the record low levels of the 2000s. In many cases, the real housing costs decreased until 2005 after which a combination of rising house prices and increased energy costs made them escalate. Only in Fort McMurray do we see extreme housing price increases that far
outpaced the mitigating effect of the decreasing interest rates, generating steadily escalating housing costs during this entire period. Costs also increased in 2006 and 2011 for those who own their houses outright, as energy costs went up. This illustrates the potential importance that energy costs can have on housing affordability. Rising housing prices further translate into higher property taxes and other costs. Increasing property taxes and heating costs can particularly affect homeowners living at fixed incomes (Ryser & Halseth, 2011).
Mortgaged homeownership is growing fast in resource-driven urban
agglomerations, where population growth adds to housing demand. Particularly, well-paid resource sector workers are likely to contract mortgages to purchase houses. However, low interest rates in combination with easy access to mortgage funding further enabled many
34 low income earners to make the transition to homeownership, as indicated by a large
increase in the percentage of owners with a mortgage between 2001 and 2006.
As shown above, a majority of mortgaged homeowners with low incomes have either moderate or severe housing affordability problems. For some of them, this problem occurs in combination with a housing quality problem, putting them at risk of not being able to pay for their non-housing consumption or leaving them without the necessary buffer to handle unexpected events (Alexander & Jacobson, 2015). If they cannot afford to do the necessary maintenance and repairs, they are also likely to face depreciation of their
property’s value. Considering that the housing cost data only includes mortgage payments, property taxes, fuel and utilities but no maintenance costs, it can be anticipated that a larger contingent of homeowners is likely to be burdened by their housing-related expenses than suggested by these results and less likely to reap the benefits of homeownership.
Those unable or unwilling to purchase a home are confined to the rental housing sector. During a resource boom, growing demand from new workers make rental housing costs increase faster in resource-driven urban agglomerations than in Canada as a whole. St. John’s is the only remarkable exception. St. John’s exhibits a very low real rental cost increase, or even decrease, while Canadian median values show a moderate increase. One explanation is that scarce new rentals combined with a high vacancy rate in St. John’s in the 1990s (CMHC, 2015). There was no real pressure on the rents until resource extraction activities started and generated increased demand for rental units. When rental costs started to rise, the increase was relatively high among low-income earners who had few other options. However, St. John’s housing market has also been able to absorb some of the impact of the rising demand in the rental market because of its social and secondary rental
35 housing sectors. Unfortunately, for the purpose of this research, it was generally not
possible to differentiate social housing tenancies from the private rental tenancy in the datasets before 2011. Social housing costs are normally geared to income which makes it affordable by definition, and the share of subsidized housing has even been used as an indicator of regional housing affordability by other researchers (Bogdon & Can, 1997). The size of the social housing sector is significant because it provides housing for some of the low-income earners and at the same time has an alleviating effect on the level of housing affordability in the region.
Housing quality and overcrowding are minor problems in comparison to housing costs to income burden. However, housing quality problems are not negligible, particularly for renters. We have used the only housing quality indicators available in the datasets, one for adequacy and another for suitability. While suitability can be assessed by calculating the crowding for each dwelling, adequacy is based on subjective evaluation by the resident. Hence it is reasonable to expect that housing quality problems are more prevalent than suggested by these results. Households can also be afflicted by other kinds of quality problems which are not covered by census data. Of particular concern are housing quality requirements of the elderly and disabled, as housing accessibility may become a priority in a region where the population is aging rapidly. Furthermore, without additional qualitative research we cannot conclude if households are selecting to live in a substandard housing to improve their housing affordability prospects, although we cannot exclude it either. Thus we conclude that housing quality problems exist and may be larger for some segments of the population (O’Dell, Smith & While, 2004).
36 The housing values to income ratios for homeowners confirm a deteriorating pattern of housing affordability. In 2011, this ratio exceeded the affordability limit for median income earners in all urban agglomerations. Not only has the affordability problem reached the mid-income earners, but housing has become severely unaffordable for the lowest income earners. Households are carrying an increasing mortgage debt burden (Alexander & Jacobson, 2015; Walks, 2013). This has particular implications for a society with a younger population at the stage of household formation as workers in Fort McMurray. This is contrasted by aging population in St. John′s many of whom are likely to have done paid off their mortgages.
Although growing housing costs relative to income is a problem, the rise in absolute housing costs is a new source of concern. Rapid increase in housing costs for low-income earners suggests that there is a smaller gap in the monthly housing expenses of bottom and top income groups. This has happened in all subgroups, renters, owners with or without a mortgage, in all selected urban agglomerations and at the national level. The gaps were already smaller in 1991 in the resource-driven economies than on the national level, and they have decreased further. Not only is there a rise of housing costs for low-income earners, but there is a decreasing presence of affordable housing in the market. Reliance on private developers and focus on homeownership drive the markets. Disincentives against rental housing development are particularly efficient in resource-driven economies, the cyclical nature of which impede developers from collecting steady profits. This works against the provision of diverse housing options for households with different needs and financial means.
37 One of our hypotheses was that increasing income inequalities in resource-driven economies underlies growing housing affordability problems. This analysis demonstrates that there are increasing income gaps between top and bottom income quintiles with two exceptions, Fort McMurray and Edmonton. The mid-range income inequalities either decreased or had a modest increase in all cases except in St. John’s, which had the highest income inequality increase for both top to bottom and the mid-range. This is consistent with the literature. Resource industries can alleviate existing income inequalities but they can also exacerbate them, contingent on the previous economic history and present
circumstances (Fleming & Measham, 2015). Furthermore, the effect may be transient particularly in Fort McMurray where the oil dependent regional economy provides scant other employment opportunities.
Resource industries can have a differential impact on the labor market. Calgary focus on financial and service industries generated more income disparities than the
diversified economies in Saskatoon and Edmonton. Particularly, the Athabasca bituminous sands provided numerous well-paying employment opportunities during the oil boom in the region (Keogh, 2015), but St. John’s is the hub of a capital-intensive offshore industry that does not create as many new well-paying jobs. Despite the spillover effects of resource industries to other labor market sectors between 2002 and 2011, there were steady 10 percent of Newfoundlanders who remained as permanent residents in the province but worked elsewhere, frequently in Fort McMurray (Morissette & Qiu, 2015). Newfoundland has remained a province with few sources of economic opportunities, as indicated by its rate of unemployment, which has never come down to the Canadian level. Nevertheless, the economic boom has had an impact on the local economy by creating some new well-paying
38 jobs in the resource sector, feeding the construction industry and generating many new jobs in the hospitality sector, while also exerting pressure to increase the salaries of those
working in the public sector.
However, a resource-related economic boom does not necessarily generate a demographic boom (Ennis, Finlayson & Speering, 2013). Newfoundland undoubtedly has experienced an economic boom since the beginning of the offshore oil extraction, but population growth in St. John’s has remained modest compared to the other selected urban agglomerations, and mostly consists of rural Newfoundlanders moving to the city. This may have spared St. John’s from some of the expected negative socioeconomic
consequences and larger housing affordability problems associated with commodity booms, because demand for housing and infrastructure increases in relation to population growth.
Furthermore, housing affordability is not without problems when the boom is over. When resource prices drop, there will be many jobs lost in the construction sector and oil-related employment, but also in the retail and hospitality sectors. Deficits can even cause cuts in the public sector, as seen in all agglomerations following the 2014 oil crisis. Contracting regional economy and decreasing income levels have an impact on the local housing market in different ways. While decreasing housing prices make it easier for first-time buyers to purchase a house, supply will also decrease because homeowners are unable or unwilling to sell their homes for lower price than the outstanding amount of their
mortgage.
Previous lucrative employment can lead some segments of the population to overspend on housing. A larger house means higher debt, higher heating and maintenance
39 costs, and higher property taxes. However, homeowners with low incomes and mortgages are the most vulnerable ones because they are already at the margin of what they can spend on housing. They may have already postponed necessary housing repairs, which can have a negative impact on the quality and the future value of their housing. Capital gains
associated with rising housing values may not become reality because housing prices can decline again when the booming phase is over (Lloyd & Newlands, 1990), making home ownership generally a riskier equity building vehicle in resource-driven economies. While this is most evident in regions affected by oil booms, the same tendencies are also seen in other resource-driven economies with sudden and significant economic growth as
exemplified by Saskatoon. When there is a decline in the resource sector, the regional economy—particularly employment—are affected. Incomes will also decline, and improvements achieved in income equality are likely to be lost. Negative equity can also hinder unemployed people from moving elsewhere in search of employment opportunities.
Conclusions
This study shows that new problems of housing affordability have taken place in resource-driven agglomerations central to the recent Canadian oil boom. In such agglomerations, the rapid increase in housing costs is not compensated by increasing income levels for all segments of the population. Growing numbers of low-income homeowners with mortgages are already burdened by their housing cost, but they are particularly vulnerable with their debt when facing an inevitable economic downturn. Problems of housing affordability are hence no longer confined to the bottom 40% of the income distribution. There is growing evidence that mid-income households are currently, or will soon be, affected by such problems. Mid-income earners have not had an ideal income evolution between 1991 and
40 2011, while their housing costs have increased, at times not in proportion to other parts of the income distribution. Housing affordability is still a major problem for renters with low incomes, but also increasingly so for low-income homeowners, particularly for those with mortgages. A decreasing gap between housing costs for bottom and top income groups indicates that there is a shortage of affordable housing in the market. The bottom 60% of homeowners are experiencing increasing housing costs to income burden, while the circumstances are improving slightly for renters over time.
In view of these findings, we contend that resource booms (or busts) are prone to generate housing affordability problems and housing-related vulnerability in low to mid-income earning segments of the population in extractive urban agglomerations. Growing housing demand leads to rapidly rising prices during resource booms, preventing some first-time buyers from entering the housing market, and adding to the housing cost burden for renters. Property taxes based on inflated house values can cause housing affordability problems for elderly homeowners living at fixed incomes who have paid off their
mortgages. When commodity prices drop, economic downturn is likely to cause unemployment and contracting incomes—as seen in the 2014 oil crash. Mortgaged homeowners experiencing decreasing income levels run a risk of not being able to make their payments. Consumer spending will decrease and public spending cuts further
contribute to the economic decline. House prices are also likely to decline, making it easier for some first-time buyers to purchase homes, but housing market may still slow down because homeowners with negative equity are not placing their houses at the market. Therefore, the extent of housing affordability problems may not be as high as in major metropolitan areas, but the associated risk is higher because of the volatility of
resource-41 driven economies. Whereas previous literature has emphasized housing vulnerability in large metropolitan areas, the results highlight new patterns of risk-laden housing-related vulnerability in resource-driven regions in Canada.
There are limitations to this research. The income data are not adjusted to household size or structure. We have no access to information about wealth, or level of debt. Housing costs to income data for homeowners can be considered understated because homeowners also have to do maintenance of their homes and these costs are not included in the owners’ housing costs. Furthermore, housing affordability is not only dependent on housing tenure and household income, but also on other socioeconomic characteristics of the households. At last, we have not revealed which household attributes other than income, tenure, and presence of a mortgage can be associated with increased risk of housing affordability problems. These limitations represent pertinent aspects that we feel should be investigated in future studies.
Acknowledgements
We thank the anonymous reviewers whose feedback greatly improved this article.
Furthermore, our gratitude goes to the staff at the University of New Brunswick Research Data Centre (UNB-RDC), and branch at Memorial University of Newfoundland (MUN-RDC). This research was supported by The Institute of Social and Economic Research, Faculty of Humanities and Social Sciences, of Memorial University of Newfoundland.
References
Agnello, L., & Schuknecht, L. (2011). Booms and busts in housing markets: Determinants and implications. Journal of Housing Economics, 20, 171–190.
42 Alexander, Craig, & Jacobson, P. (2015). Mortgaged to the Hilt: Risks from the
Distribution of Household Mortgage Debt.CD Howe Institute Commentary 441. Retrieved Feb 13, 2016 from www.cdhowe.org.
Arnold, E., & Skaburskis, A. (1989). Measuring Ontario increasing Housing Affordability Problem. Social Indicators Research.21, 501–515.
Baland, J. M., & Francois, P. (2000). Rent-seeking and resource booms. Journal of Development Economics, 61, 527–542.
Bogdon, A. S., & Can, A. (1997). Indicators of Local Housing Affordability: Comparative and Spatial Approaches. Real Estate Economics.25: 43–80.
Bolton, K., & Breau, S. (2012). Growing Unequal? Changes in the Distribution of Earnings across Canadian Cities. Urban Studies, 49, 1377–1396.
Brown, M. & Rispoli, L. 2014. Metropolitan Gross Domestic Products—Experimental Estmates, 2001–2009. Statistics Canada, Economic Insights (Catalogue number 11-626-X-No. 04). Retrieved March 24th, 2016 from
http://www.statcan.gc.ca/pub/11-626-x/11-626-x2014042-eng.pdf
Bunting, T., Walks, R. A., & Filion, P. (2004). The uneven geography of housing
affordability stress in Canadian metropolitan areas. Housing Studies, 19, 361–393. Cadigan, S. T. (2012). Boom, Bust and Bluster: Newfoundland and Labrador’s “Oil Boom”
and Its Impacts on Labor in John Peters (ed.), Boom, Bust and Crisis: Labor,
Corporate Power and Politics in Canada (pp. 68–83). Halifax: Fernwood Publishing. Chakrabarti, R., & Zhang, J. (2015). Unaffordable housing and local employment growth:
Evidence from California municipalities. Urban Studies, 52, 1134–1151.
Chan, S. (2001). Spatial lock-in: Do falling house prices constrain residential mobility? Journal of Urban Economics, 49, 567–586.
CMHC. (2015). Housing Market Indicators—St. John’s 1990–2014. Canadian Housing Observer. Retrieved March 24th, 2016 from
http://www.cmhc-schl.gc.ca/en/hoficlincl/homain/stda/data/data_001.cfm.
Drew, Rachel. B. (2013). Constructing Homeownership Policy: Social Constructions and the Design of the Low-Income Homeownership Policy Objective. Housing Studies. 28(4), 616–631.
Ennis, Gretchen, Finlayson, Mary, & Speering, Glen. (2013). Expecting A Boomtown? Exploring potential Housing—related Impacts of Large Scale Resource