For Peer Review Only
Seasonal contributions of water and pollutants to Lake St. Charles, a drinking water reservoir
Journal: Canadian Water Resources Journal Manuscript ID TCWR-2019-0028.R1
Manuscript Type: Original Paper Date Submitted by the
Author: n/a
Complete List of Authors: Narancic, Biljana; INRS, Eau-Terre Environnement Laurion, Isabelle; INRS, Eau-Terre Environnement
Wolfe, Brent B.; Wilfrid Laurier University, Geography and Environmental Studies
Behmel, Sonja; Association pour la protection de l’environnement du lac Saint-Charles et des Marais du Nord, Limnology
Rousseau, Alain; INRS, Eau-Terre Environnement
For Peer Review Only
1 Seasonal contributions of water and pollutants to Lake St. Charles, a
2 drinking water reservoir
3
4 Biljana Narancic1, Isabelle Laurion1, Brent B. Wolfe2, Sonja Behmel3 and Alain N.
5 Rousseau1
6
7 1 Centre Eau Terre Environnement, Institut national de la recherche scientifique, Québec,
8 QC G1K 9A9, Canada
9 2 Department of Geography and Environmental Studies, Wilfrid Laurier University,
10 Waterloo, ON N2L 3C5, Canada
11 3 Association pour la protection de l’environnement du lac Saint-Charles et des Marais du
12 Nord, Québec, QC G3G 1H4, Canada 13
14 Corresponding author: Biljana Narancic (now at Laboratoire de paléoécologie aquatique, 15 Centre d’études nordiques, Département de géographie, Université́ Laval, QC G1V 0A6, 16 Canada)
17 E-mail: [email protected] 18 ORCID ID: orcid.org/0000-0002-4986-6927 19
20 21 22
For Peer Review Only
23 Abstract
24 Surface waters are widely used as sources of drinking water in Canada. The identification 25 of the main sources of pollutants to surface waters, often associated with increasing 26 urbanization, is needed to improve management strategies. We used stable water isotopes 27 (δ18O and δD), and nutrient and fecal coliform mass fluxes to estimate the seasonal
28 contributions of water and pollutants of different inflows to Lake St. Charles (LSC). Our 29 results indicate that out of six identified LSC water sources, groundwater (GW), Hurons 30 River(HR) and small stream tributaries (SSTs) represent the major contributors (in terms 31 of water volume). The three other water sources, including two wastewater treatment 32 plants (WWTPs), Delage Lake (DL) and precipitation (rain and snow), represent smaller 33 seasonal contributions. During the high-flow seasons (spring and fall), LSC receives 34 water mainly from SSTs and HR, while during the low-flow season (summer), the lake 35 relies mainly on GW inflows. Estimates of point source (WWTPs) versus non-point 36 source (primarily septic installations) concentrations of nutrients and fecal coliforms 37 show that the latter represents a seasonally variable and greater source of pollutants (5 % 38 WWTPs vs. 95 % septic installations). HR and SSTs, draining densely occupied areas of 39 single housing units with individual septic installations, are categorized as non-point 40 sources, and as such are considered major nutrient and fecal coliform contributors. The 41 higher precipitation in spring and fall caused increased fluxes of nutrients and fecal 42 coliforms through higher stream discharge. Due to the seasonally variable and difficult to 43 predict discharge dynamics of SSTs and HR, these two sources represent a potentially 44 larger threat to LSC water quality. We advocate that improved management requires 45 reducing the number of individual septic installations in the LSC watershed.
For Peer Review Only
47 Résumé
48 Les eaux de surface sont largement utilisées comme sources d’eau potable au Canada. 49 L'identification des principales sources de polluants dans les eaux de surface, souvent 50 associées à une urbanisation croissante, est nécessaire pour élaborer des stratégies de 51 gestion améliorée. Nous avons utilisé des isotopes stables dans l’eau (δ18O et δD) et des
52 charges en nutriments et coliformes fécaux pour estimer les contributions saisonnières de 53 différents affluents vers le lac Saint-Charles (LSC). Nos résultats indiquent que parmi les 54 six sources d'eau identifiées, les eaux souterraines (GW), la rivière des Hurons (HR) et 55 les petits tributaires (SSTs) représentent les principaux contributeurs (en termes de 56 volume d'eau). Les trois autres sources d'eau, dont deux stations d'épuration d’eaux usées 57 (WWTPs), Lac Delage (DL) et les précipitations (pluie et neige), représentent une
58 contribution saisonnière moins importante. Pendant les saisons de fort débit (printemps et 59 automne), LSC reçoit de l’eau principalement des SSTs et HR, tandis que pendant la 60 saison de faible débit (été), le lac dépend principalement de GW pour maintenir son 61 niveau d’eau. Les estimations des sources ponctuelles (WWTPs) par rapport aux sources 62 non ponctuelles (principalement des installations septiques) de nutriments et coliformes 63 fécaux ont démontré que cette dernière source représente une contribution saisonnière 64 variable, mais plus importante de polluants (5% des WWTPs contre 95% des installations 65 septiques). HR et SSTs qui drainent les zones densément occupées par des maisons avec 66 des installations septiques privées, sont classées comme des sources non ponctuelles et, à 67 ce titre, sont considérées comme des contributeurs majeurs en nutriments et coliformes 68 fécaux. Les précipitations plus abondantes au printemps et à l'automne ont entraîné une 69 augmentation des flux de nutriments et coliformes fécaux en raison du débit plus élevé.
For Peer Review Only
71 menace potentiellement plus grande pour la qualité de l'eau du LSC que d'autres sources. 72 Nous préconisons que l'amélioration de la gestion nécessite de réduire le nombre
73 d'installations septiques privées dans le bassin versant du LSC. 74
75 Keywords: Quebec; stables isotopes; nutrients; fecal coliforms; septic installations; 76 wastewater treatment plants;
For Peer Review Only
78 Introduction
79 In Canada, two-thirds of the population depend on surface waters from lakes, rivers and 80 reservoirs for their drinking water supply (Statistics Canada 2011). In southern Quebec, 81 surface waters provide more than 75 % of the drinking water (MDDEP 2008).
82 Increasingly, people are moving out of city centers, because of lower housing prices, and 83 developers are quickly converting forested areas and floodplains into building lots to 84 respond to this growing demand, and as a consequence replacing land cover serving as 85 natural filters (Ritchot et al. 1994)). The accelerated urbanization, often not connected to 86 sewer systems, particularly in the urban-rural fringe areas, is viewed as a major threat to 87 long-term sustainability in water quality and quantity and represents a major challenge 88 for water managers.
89 Lake St. Charles (LSC) is the main drinking water reservoir of Quebec City 90 providing drinking water to 300,000 inhabitants and is located in the urban-rural fringe 91 area. There is increasing evidence that the lake water quality is undergoing accelerated 92 degradation associated with increased urbanization (Tremblay et al. 2002; Tremblay and 93 Pienitz 2015; APEL 2014b and 2019). Based on APEL reports (Association pour la 94 protection de l’environnement du lac Saint-Charles et des Marais du Nord; 2012, 2014a, 95 2014b), a non-profit lake steward organization, urban development is increasing faster
96 than the infrastructure capacity (e.g., the capacity of the two wastewater treatment plants
97 upstream from Lake St. Charles in addition to the increasing number of housing on septic
98 installations), and regulations are needed to control diffuse (non-point) and point sources
99 of pollution from domestic waste water sources. Residential development and increased 100 discharge of domestic wastewaters into the lake have substantially increased during the
For Peer Review Only
101 past 50 years (APEL 2019). These land cover changes have accelerated the lake 102 eutrophication process and ensuing degradation rate, which is already perceptible by 103 occurrences of cyanobacterial blooms occurrence, aquatic plant proliferation and 104 increased water salinity (Légaré 1997, 1998; APEL 2012, 2014a). Indeed, the lake was 105 classified as mesotrophic when considering both nutrient and algal biomass (APEL 106 2014b). Within the lake watershed, there are two wastewater treatment plants (WWTPs) 107 serving close to 5 000 people. WWTPs are permanent point sources of nutrients and 108 pollutants. In addition, approximately 3 000, single housing units with on-site septic 109 installations composed of a sedimentation tank and purification field, viewed as
non-110 point sources of pollution, are also located within the LSC watershed.
111 Several studies have observed that septic installation failure contributes to water
112 quality degradation, but even a properly working septic installation, which has a working
113 life expectancy between 10 to 20 years, does not handle all pollutants effectively and is
114 likely insufficient to prevent pollution of downstream waterbodies and groundwaters
115 (Aravena et al. 1992; Wilhelm et al. 1996; Ptacek 1998; Robertson et al. 1998; Wernick 116 et al. 1998; Arnade 1999; Moore et al. 2003). To our knowledge, there are no studies that 117 have focused on the efficiency of septic installations and contributing pollution to LSC 118 based on geochemical proxies, and the same can be said for the two WWTP effluents 119 located within its drainage area. The study of Wernick et al. (1998) advocates that 120 individual septic installations are one of the main non-point sources of nitrogen pollution 121 in stream waters. In their comparison between lakes with houses connected to a central 122 sewer system and those surrounded by houses with individual septic installations, Moore
For Peer Review Only
123 et al. (2003) concluded that the latter had higher levels of phosphorous and chlorophyll-a 124 concentrations.
125 The two municipalities located within the LSC watershed, are considering the 126 possibility of connecting individual septic installations to their local sewer systems 127 (modernised WWTPs) and/or diverting their domestic wastewaters to WWPT located in 128 Quebec City, that is beyond the lake watershed. Therefore, there is a need to identify the 129 dominant pollutant sources in order to prioritize investments. To provide municipalities 130 with this knowledge, we assessed and compared intra- and inter-annual contributions of
131 point (WWTPs) and non-point sources (septic installations drained by small stream 132 tributaries) of waters, nutrients and fecal coliforms located within the LSC watreshed. We 133 used water stable isotopes (δ18O and δD) to partition water sources to LSC, and
134 limnological tracers (mass fluxes, that is loadings, of phosphorus, nitrogen and fecal 135 coliform) to assess the transport of pollutants to LSC over a two-year period. Stable 136 isotope analysis is often used to determine the relative contribution of different water 137 sources, but also about the evaporation effects, precipitation patterns and groundwater 138 recharge (Clark and Fritz 1997; Turner et al. 2010; Tondu et al. 2013; Narancic et al. 139 2017). Moreover, water stable isotopes are considered water management tools (Tondu et 140 al. 2013). Here we used a linear mixing model for partitioning six lake water sources 141 using δ18O and δD. The isotopic similarity of LSC waters to individual water sources is
142 used to estimate their relative contribution to the lake water balance.
143 The estimation of nutrient and fecal coliform mass fluxes to the lake is paramount 144 in assessing the sustainability of LSC water quality. The characterization of the mass 145 fluxes through our applied hydro-limnological approach will inform governance
For Peer Review Only
146 strategies to improve or avoid further degradation of lake water quality. The results can 147 also serve to improve the hydrological modelling through a more complete description of 148 seasonal changes in limnological conditions, and to make projections linked to climate 149 change, which is especially critical for this municipal source of drinking water.
150
151 Materials and Methods
152 Study site
153 LSC (46°55' N, 71°22' W), located 20 km northwest of Quebec City (Canada), is a 154 medium-size lake reservoir (3.6 km2) with a deeper northern (up the lake) basin
155 (maximum depth = 17.5 m) and shallower southern basin (towards the lake outlet; 156 maximum depth = 4.5 m; Figure 1). The drainage area of the watershed is 198 km2,
157 transgressing the administrative boundaries of five neighbouring municipalities: 158 Stoneham-and-Tewkesbury, City of Lac Delage, Quebec City,
Saint-Gabriel-de-159 Valcartier and Lac Beauport (Figure 1). Based on previous studies, the main sources of 160 water to LSC come from the Hurons River, Delage Lake, and 34 small streams,
161 respectively draining 82 %, 4 % and 11 % of the watershed. Diffuse runoff from lake 162 hillslopes were estimated to drain the remaining 3 % of the watershed (APEL 2014b). 163 LSC discharges into the St. Charles River via a dam that separates the lake and the river. 164 The dam was built in 1934 to create the drinking water reservoir for Quebec City (APEL 165 2014a; APEL 2019), and is now a run-of-the-river type dam since 2012. The short water 166 residence time, ca. 23 days for the northern basin and ca. 8 days for the southern basin, 167 characterises LSC as a fluvial lake system (Légaré 1998; Tremblay et al. 2002). [Figure 1 168 near here]
For Peer Review Only
169 LSC is located on the Canadian Shield in an ancient glacial valley surrounded by steep 170 hills with altitudes varying between 150-450 m (the highest peak is at 750 m; Tremblay 171 et al. 2002). Surface deposits are thin with outcrops (APEL 1981). Upstream surface 172 water has naturally low ionic charge, and thus, low conductivity and pH (78.6 μS/cm and 173 6.7 pH). Approximately, 70 % of the lake watershed is covered by dense forests,
174 dominated by deciduous and mixed wood stands. Significant macrophyte growth occurs 175 in shallow areas along the lake shores. Since 2012, macrophyte growth has been
176 extensive and tends to cover 55 % of the southern basin area and 36 % of the northern 177 basin area (APEL 2014b).
178 Today, approximately 13 000 people live in the lake watershed, with more than 4 179 000 housing units located close to the shores (i.e. at less than 500 m; APEL 2014b). More 180 than half of these housing units have on-site individual septic installations. Given the 181 1960 population growth in the lake watershed, some of these septic installations are more 182 than 50 years old (APEL 2019 and references therein). In 1990, two WWTPs were built 183 for the towns of Stoneham-and-Tewkesbury and City of Lac Delage. Both WWTPs have 184 aerated lagoons. Since 2017, the Stoneham-and-Tewkesbury WWTP uses tertiary
185 treatment of sewage discharge and treated waters are directly flushed out through an 186 underground pipe system into Hurons River, ca. 4 km upstream of LSC. City of Lac 187 Delage WWTP provides alum-based coagulation to treat the wastewaters, and treated 188 waters are discharged into marshes (Northern Marshes) upstream of LSC (Figure 1). 189 According to the 1981–2010 climate normal from the closest Environment and
190 Climate Change Canada meteorological station (Jean-Lesage airport, Station ID
For Peer Review Only
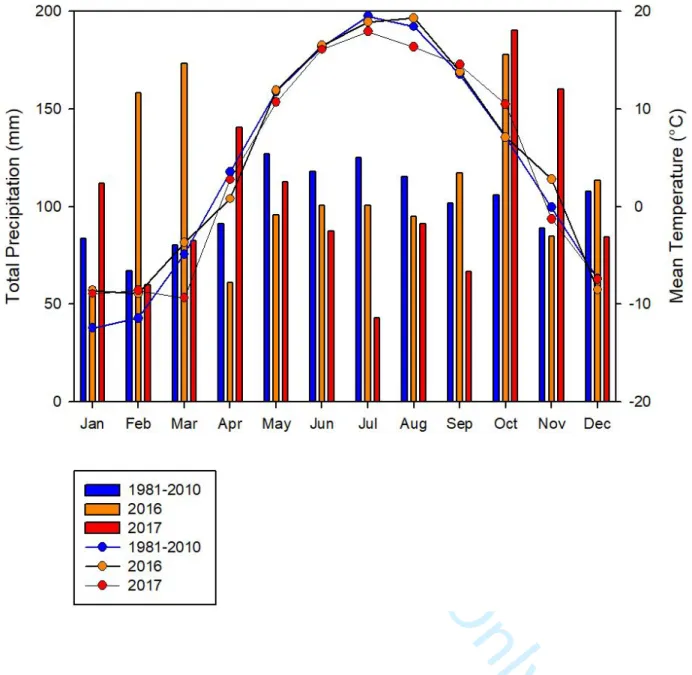
192 respectively (Environment Canada 2017). Most of the precipitation (ca. 75%) falls as 193 rain. The lake is covered by ice from December to April. Annual precipitation for 2016 (1 194 337 mm) and 2017 (1 231 mm) were slightly above the 1981-2010 climate normal. Both 195 years had exceptionally wet conditions during the spring and fall (710 mm = 2016; 753 196 mm = 2017; compared to 595 mm = 30-year climate average) and drier than normal 197 conditions during the summer (297 mm = 2016; 222 = 2017; compared to 358 mm = 30-198 year climate average; Figure 2). The temperature for both years were generally similar to 199 the 30-year climate average, with slightly warmer winter temperatures for the months of 200 January (-8.6°C = 2016; -8.9°C = 2017; compared to -12.8°C = 30-year climate average) 201 and February (-8.9°C = 2016; -8.6°C = 2017; compared to -10.6°C = 30-year climate 202 average) and colder summer temperatures for the month of July (18.9°C = 2016; 17.9°C 203 = 2017; compared to 19.5°C = 30-year climate average; Figure 2). [Figure 2 near here] 204
205 Field sampling and analysis
206 Waters from LSC were sampled at five different locations (stations C03, C04 and C05 in 207 the pelagic zone; stations SCE and SCA in the littoral zone; Table 1). Hurons River (HR), 208 Delage Lake (DL), WWTP effluents of Stoneham-and-Tewkesbury (WWTP-ST), City of 209 Lac Delage (WWTP-LD), and 28 small stream tributaries (SSTs; DD, CC, BB, AA, FF, 210 W, Z, GG, U, T, HH, S, R, Q, P, CPLSC18, M, KK, L, K, J, E, OO, H, C, F, G and PP) 211 were sampled at only one location. All sites were sampled every other week from June to 212 October 2016 and an additional six SSTs (IID, IIB, LL, NN, N and A) were sampled 213 from April to October 2017. The HR, DL, WWTP-ST, WWTP-LD and four SSTs (AA, 214 S, K and OO) were sampled once a month from January to March 2017. Groundwater
For Peer Review Only
215 (GW) in private drinking water wells was sampled at five different locations near the 216 shoreline of LSC (GW1, 2, 3, 4 and 5), once in fall 2016 and four times during the period 217 of January-October 2017. At least one precipitation sample per month from June 2016 to 218 October 2017, except for the months of December and January 2017, was taken at the 219 lake outlet; that is at the aforementioned dam location (Figure 1).
220 Six environmental variables were used to estimate the seasonal contributions of 221 the main water sources (SSTs, HR, DL and WWTPs) to LSC: in-situ measured discharge, 222 water oxygen (δ18O) and hydrogen (δD) stable isotope composition, total nitrogen (TN),
223 total phosphorus (TP) and fecal coliforms (Fc). Water stable isotopes were also used to 224 estimate the seasonal contribution of GW and precipitation to LSC.
225
226 Discharge
227 The discharge (n = 50) was measured once a month by different methods logistically 228 constrained by flow strength, water depth, stream bed types or pipe configuration. For 229 most stations, it was not possible to use a single method because the flow was too
230 variable from one visit to another. The velocity–area method for the determination of the 231 stream flow of HR and discharge of DL consisted of measuring depth, distance and 232 stream velocity between different cross-sections of the river. The velocity was
233 measured using a current meter (Swoffer model 2100) and the average was obtained for 234 each cross-section. The discharge rate was then derived from the sum of the product of 235 mean velocity, depth and width between cross-sections. When the water level and flow 236 velocity were too low to use a current meter, we used the speed–area method with floats. 237 The velocity was first calculated by measuring the time the float took to travel a fixed
For Peer Review Only
238 distance, and after the area of that river section was measured. The discharge was then 239 calculated by multiplying the section area by the velocity. When water flow was
240 extremely low, we used the volumetric method. This method consisted of calculating the 241 discharge from the time needed to fill a container of known volume. These latter two 242 methods were used to measure discharge from the SSTs.
243
244 Water stable isotope composition
245 Water samples were collected in 30-ml, high-density polyethylene bottles at each
246 sampling site (Figure 1). In total, 105 (2016) and 339 (2017) surface water samples, and 4 247 (2016) and 17 (2017) GW samples were collected. Samples of rain and snow were
248 obtained when precipitation events occurred. Rainwater was collected in a plastic pan 249 until enough water was gathered to fill the 30-ml bottles. This took 2 hours or less. Snow 250 samples were collected in Ziploc® bags and once completely melted, the meltwater was 251 transferred into the 30-ml bottles. Samples were stored at 4°C prior to analysis at the 252 University of Waterloo Environmental Isotope Laboratory by Off-Axis Integrated Cavity 253 Output Spectroscopy (Berman et al., 2013).
254 Isotope compositions are expressed as δ-values relative to the Vienna Standard 255 Mean Ocean Water (VSMOW) in per mil (‰), such that δsample = (Rsample - RVSMOW)
256 /RVSMOW × 1000, where Rsample and RVSMOW are the ratio
18
O/16O or D/1H in the sample 257 and VSMOW, respectively. Results of δ18O and δD analysis are normalized to 55.5 ‰ 258 and 428 ‰, respectively, for Standard Light Antarctic Precipitation (SLAP; Coplen 259 1996). Analytical uncertainties are ± 0.2 ‰ for δ18O, and ± 0.8 ‰ for δD.
For Peer Review Only
261 LSC water source partitioning
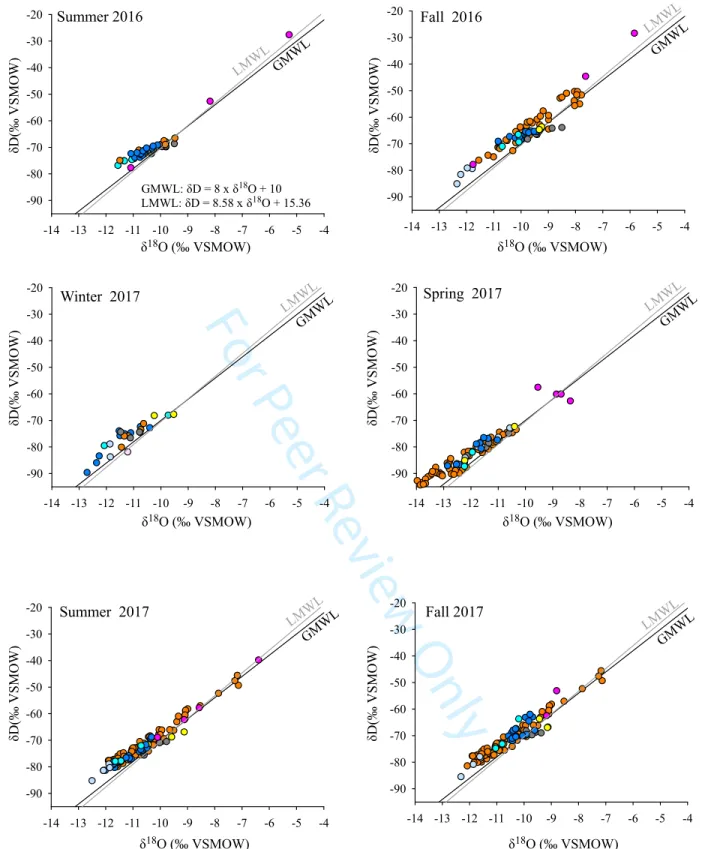
262 LSC and its source water isotope compositions were first evaluated in δ18O-δD space
263 including the Local and Global Meteoric Water Line (LMWL and GMWL) for 264 references. The LMWL (δD = 8.58 × δ18O + 15.36) and GMWL (δD = 8 × δ18O + 10;
265 Craig, 1961) respectively expresses the local and global linear relationships between the 266 oxygen and hydrogen isotope compositions of precipitation. The δ18O and δD values for
267 precipitation typically fall along the GMWL (or LMWL), and their position reflects 268 variability in spatial and seasonal trajectory of the atmospheric vapor contributing to local 269 precipitation (Rozanski et al. 1993). This normally leads to isotopically-depleted winter 270 precipitation and isotopically enriched summer precipitation (Dansgaard 1964).
271 As shown in Figure 3, LSC does not display substantial evidence of evaporative 272 isotopic enrichment. Lake water isotope composition will usually plot along another 273 linear trend called Local Evaporation Line (LEL: Yi et al. 2008; Turner et al. 2010). The 274 LEL typically has a lower slope than the LMWL and GMWL. Lake water isotope 275 compositions in our study plot along and above the GMWL and LMWL, as expected 276 given the fluvial setting. With the absence of evaporation, it is assumed that the measured 277 lake water isotope composition is a straightforward reflection of the varying
278 combinations of water sources. Prior to proceeding with source partitioning, seasonal 279 isotopic ratios for the lake and its water sources (HR, DL, SSTs, WWTPs) were weighted 280 by the discharge. Each δ18O(and δD) value wasmultiplied by the corresponding
281 discharge, and their sum divided by the sum of the total discharge during that season. For 282 GW and precipitation, the arithmetic mean of the isotope compositions was used.
For Peer Review Only
283 We applied the standard linear mixing model developed by Phillips and Gregg 284 (2003) to determine multiple combinations of multiple source proportions using the 285 IsoSource 1.3.1 program. This model is well suited when the number of contribution 286 sources to a mixture is too large to obtain a unique value, and thus an estimated range of 287 individual contributions (0%-100%) is provided. These ranges depend on the similarity 288 and position within the mixing polygons of source isotope composition in reference to a 289 mixture. In general, small mass balance tolerance (±0.1‰) of source proportions of a 290 mixture is considered to have feasible solutions, from which the frequency (histograms) 291 and range (%) of potential source contributions can be determined.
292 As a linear relationship exists between δ18O and δD (Craig 1961) in meteoric
293 water, we assumed that the water source partitioning is the same for both isotopes. We
294 supplied the IsoSource 1.3.1 program with the water isotope compositions of the lake and
295 its water sources, along with the desired source increment (± 1 %) and the mass balance
296 tolerance (± 0.1 ‰) in order to include all possible contributions. As described by 297 Phillips and Gregg (2003), the program repeatedly calculates each possible combination
298 of source proportions. The predicted isotope composition for the lake water was
299 computed as each combination was generated. These predicted lake water isotope
300 compositions were compared to observed values. If they were equal or within a
301 predetermined mass balance tolerance (± 0.1 ‰), they were considered to represent a
302 possible solution and, thus, included in the results. All combinations were represented by
303 histograms with descriptive statistics of the distributions for each source. Within the
304 drawn polygons in δ18O-δD space, we assumed that source waters falling closest to that
For Peer Review Only
306 partitioning solution for each water source to estimate the seasonal changes in source 307 contribution to LSC.
308
309 Nutrients and fecal coliforms
310 As previously mentioned, waters from LSC (n= 61), SSTs (n= 393), HR (n= 24), DL (n= 311 27) and WWTP effluents (n= 44) were sampled at week intervals during the two-312 year sampling period for the measurement of TN, TP and Fc (except Fc not measured in 313 LSC in 2016). The samples were collected in 250-ml high-density polyethylene bottles, 314 and immediately stored in a cooler before taking to the laboratory of Québec City on the 315 same day.
316 Total nitrogen (TN) was obtained by the catalytic oxidation method with a 317 Shimadzu TOC-VCPH NTM-1 instrument. Nitrogenous compounds were oxidized on a
318 platinum catalyzer at 680°C under pure oxygen atmosphere, the generated nitric oxide 319 reacted with ozone, and the product analysed by chemiluminescence (Nollet and De 320 Gelder. 2007). Total phosphorus (TP) analysis was conducted with a sensitive automated 321 colorimetric method for phosphate detection using a flow segmented Astoria analyzer. 322 Phosphorous compounds were first digested with persulfate in acidic conditions, and then 323 reacted with molybdophosphoric acid and ascorbic acid to form the molybdenum blue 324 color complex quantified by spectrophotometry (APHA, AWWA, WEF, 2005). The 325 detection limits for phosphorous and nitrogen are 0.08 mg N L-1 and 2 µgP L-1,
326 respectively.
327 The water discharge was used to calculate nutrients and Fc seasonal mass fluxes 328 to the LSC from the aforementioned sources (i.e., HR, DL, SSTs and WWTPs). The mass
For Peer Review Only
329 flux for each of water source was estimated using the averaging estimators’ method 330 explained in Quilbé et al. (2006). The mass flux was first calculated for each day where 331 both variables were measured by multiplying the concentration with the corresponding 332 discharge on a given day (discharge × concentration × 24h), and the mean monthly mass 333 flux was then calculated for each water source. For SSTs, the mass fluxes of 29 small 334 tributaries were summed over each month. When more than one mass flux was available 335 for any specific SST, the mean was calculated, and this value was then included in the 336 total SSTs monthly mass flux. Seasonal fluxes were obtained by weighting the mean 337 monthly flux (F) by the total number of days in a given season. For example, to obtain 338 the seasonal flux estimation over summer (June, July and August), the weighted summer 339 mass flux was determined as follows: (FJun × 30 + FJul × 31 + FAug × 31) / (30 + 31 + 31).
340
341 Results
342 Water isotope composition
343 LSC and its water source isotope compositions were plotted in δ18O-δ2H space to assess
344 the varying signatures of this hydrological system (Figure 3; Table 1). The isotope 345 composition of LSC and most of its water sources cluster along and above the
346 GMWL/LMWL, indicating the absence of any significant seasonal evaporative isotopic 347 enrichment. WWTP, DL, HR and GW display similar ranges in isotope composition, and 348 are also similar to the LSC signature. However, the isotope composition of SSTs and 349 precipitation span a greater range. Thus, both SSTs and precipitation water characteristics 350 vary from isotopically-enriched to isotopically-depleted lake water sources. The
For Peer Review Only
352 assess the relative contributions of individual sources, thus, a standard linear mixing 353 model was applied to provide mathematical solutions for partitioning these waters. This 354 required a seasonal estimation of the mean isotope composition for LSC water sources. 355 [Table 1 near here] [Figure 3 near here]
356 Water discharges of HR, DL, SSTs, WWTPs were also used to determine amount-357 weighted mean isotope values, while GW and precipitation mean isotope compositions 358 were determined arithmetically (Table 2). HR, SSTs and GW presented similar ranges, 359 while WWTPs, DL and rain had slightly more enriched values. Snow (only sampled 360 during winter 2017) had mean isotope values of -11.2 ‰ for δ18O and -81.9 ‰ for δD.
361 [Table 2 near here] 362
363 Source water partitioning
364 For most LSC water sources, results from IsoSource 1.3.1 program modelling generated 365 broad ranges of possible contributions (Figure 4). Figure 4 illustrates mixing polygons for
366 δ18O and δD signatures of the six LSC water sources. The histograms associated with
367 each source show the distribution of feasible contributions from each potential source to
368 LSC. Values shown in the boxes cover 1–99 percentile ranges for these distributions.
369 LSC isotope composition fell within the mixing polygons bounded by all sources, 370 indicating plausible contributions from all sources during any given season (although 371 only four sources were characterized for summer 2016).
372 In a first attempt to identify the dominant water sources to LSC, only source 373 contribution ranges exceeding 50% were considered (Figure 4). With this constraint, 374 water sources HR, GW and SSTs potentially accounted for more than 50% of LSC waters
For Peer Review Only
375 during three of the six-time intervals. The dominant contribution by HR occurred during 376 fall 2016 (0-72%) and winter 2017 (5-63%). The high contribution of HR in summer 377 2016 (43-91%) may be overestimated as only four sources were characterized during that 378 interval. GW exceeded the 50% contribution threshold during summer 2017 (36-67%), 379 winter 2017 (0-54%) and spring 2017 (0-52%), whereas SSTs exceeded 50% in fall 2016 380 (0-58%), fall 2017 (0-52%) and spring 2017 (16-59%). Overall, at least one of HR, GW 381 or SSTs was a dominant water source during any given season. DL and WWTP exceeded 382 50% only in spring 2017 (0-56% and 0-55%, respectively). Precipitation never exceeded 383 the 50% threshold as expected given the small ratio of the lake surface area to the lake 384 watershed area (1:55). [Figure 4 near here]
385 Using only the mean value from the possible range of solutions predicted by 386 IsoSource 1.3.1 program for each water source and season, we estimated seasonal 387 variability in water source contributions (Figure 5). To simplify to the four principal 388 seasons (out of six in this two-year study), we averaged summers 2016 and 2017, and 389 falls 2016 and 2017. The largest seasonal contribution of all sources was estimated for 390 GW, which ranged from 17% to 53%, with the largest contribution in summer (53%). 391 The second most important contributor was discharge from the HR, which ranged from 392 12% to 35%, with the highest contribution occurring in winter (35%) and fall (26%), 393 followed by SSTs, which ranged from 11% to 33%, with the highest contribution in 394 spring (33%). Other contributions were smaller, including those of DL (6-16%), WWTPs 395 (5-16%), rain (6-15%) and snow (8%), with a maximum contribution in spring for DL 396 (16%) and WWTPs (16%), and in fall for rain (15%). Based on these results, while 397 acknowledging only two years of study, we can rank in decreasing order the annual water
For Peer Review Only
398 source contributions to LSC as follows: GW > HR > SSTs > WWTP > DL > 399 Precipitation. [Figure 5 near here]
400
401 Contribution of pollutants to LSC
402 The distributions of nutrients and Fc in LSC and its sources are presented in Table 1 and 403 Figure 6. The largest nutrient concentrations were observed in WWTP effluents followed 404 by SST flows during all six seasons studied. The smallest nutrient concentrations were 405 measured in the HR followed by DL. The highest Fc concentrations were measured in 406 SST flows during all six seasons with the exception of spring 2017. The smallest Fc 407 concentrations were observed in DL. Despite some sources being relatively large in 408 nutrients (i.e. WWTPs) and Fc (i.e. SSTs), LSC waters have relatively small
409 concentrations in nutrients and Fc (on average 0.40 mg N L-1, 13.20 µgP L-1 and 13.30
410 CFU/100ml). [Figure 6 near here]
411 The calculated seasonal nutrient and fecal coliform mass fluxes are presented in 412 Table 3 and Figure 7. HR had the highest nutrient mass flux during all seasons (2 - 9 467 413 kg N d-1 and 46 - 662 kg P d-1) followed by SSTs (90 - 3 438 kg N d-1 and 11 - 76 kg P d
-414 1) with maximum values in fall 2016 (TP) or fall 2017 (TN). The WWTP-ST effluent
415 nutrient mass flux, which is discharged in the HR a few kilometers upstream, was also 416 important, particularly TN mass flux (120 - 992 kg N d-1 and 2.7 - 26 kg P d-1).
WWTP-417 LD effluent and DL had the smallest nutrient flux among LSC sources (WWTP-LD: 63 - 418 234 kg N d-1 and 1 - 13 kg P d-1; DL: 35 - 71 kg N d-1 and 1 - 3 kg P d-1). Fecal coliform
419 mass flux was the smallest for HR during three seasons (summer 2016, spring 2017 and 420 summer 2017; reaching up to 221 432 x109 CFU d-1) and for SSTs during two seasons
For Peer Review Only
421 (falls 2016 and 2017, up to 12 286 x109 CFU d-1). In general, WWTP effluents had lower
422 fecal coliform mass fluxes than HR and SSTs (WWTP-ST: 5-802 x109 CFU d-1;
WWTP-423 LD: 0.7-78 x109 CFU d-1), with maximum values reached in winter 2017 (WWTP-ST) or
424 spring 2017 (WWTP-LD). DL had the smallest fecal coliform mass flux (4-51 x109 CFU
425 d-1) during all seasons. [Table 3 near here]
426 [Figure 7 near here] 427
428 Discussion
429 A six-season snapshot of LSC and its water source isotope composition provides insights 430 into the hydrological regime of this lake. LSC and its water sources span a narrow range 431 of isotope compositions and do not display any evaporative enrichment, supporting the 432 known fluvial nature of this lake with a relatively short residence time. Some water 433 source isotope compositions plotted above the GMWL/LMWL, reflecting the importance 434 of precipitation from local moisture recycling (Clark and Fritz 1997; Froehlich et al. 435 2008; Wenling et al. 2017).
436 Using the mean values from the possible solution ranges and the threshold value 437 set at 50%, we were able to estimate that HR is not the only dominant water source as 438 previously evaluated (APEL 2014a and b). Water sources of LSC were dominated by 439 SSTs and HR during the spring and fall high flow season, and GW and HR during the 440 low flow periods of summer and winter (Figure 5). Moreover, the contribution of HR 441 might be overestimated; that is, it could even be lower considering that some sources 442 (e.g., GW) were not included in the estimate of summer 2016, and only four SSTs were 443 sampled in winter 2017 due to logistical constrains (Section 2). Our results also indicate
For Peer Review Only
444 that WWTPs, DL and precipitation never became dominant contributors of water to LSC. 445 Although their volumetric contributions were relatively stable throughout the year, their 446 relative contributions were in all likelihood largest during either spring (WWTPs and DL) 447 or fall (Rain; Figure 5). It is important to acknowledge that for most of the water sources, 448 only broad ranges of possible contributions to LSC could be determined. There are two 449 reasons for this outcome. First, there was a high degree of similarity between LSC and 450 water source isotopic signatures, making the mixing polygons very narrow (Figure 4). 451 This overlap is likely linked to the similar moisture source among waters, and to the 452 absence of any effects caused by variations in topography or surface water temperature 453 within the watershed. Second, the lake isotopic signature fell near the centre of the 454 polygons (e.g., in falls 2016 and 2017), and, thus, was apparently composed of
455 approximately equal contributions of these potential sources (e.g., more diffuse solutions) 456 as explained in Phillips and Gregg (2003).
457 Based on our results, the high GW contribution to LSC water budget in summer 458 must have played a significant role in buffering the evaporation and the lake water level 459 drawdown, as lake water isotope composition demonstrated negligible evaporative
460 enrichment. While Quebec City relies on the LSC during summer, the high-water demand 461 season, the lake relies on groundwater supply to maintain its water level. Thus, additional 462 investigations on this source are crucial to gain a comprehensive knowledge of
463 groundwater quantity, quality and seasonal discharge enabling a more sustainable 464 management of this drinking water reservoir in the coming years and in response to 465 climate change.
For Peer Review Only
466 Our results showed that SSTs are one of the three main contributors to the LSC 467 water budget (Figure 5) despite of their small drainage areas (Figure 1) and overall 468 discharge (Table 1). During spring, their contributions were twofold and relatively 469 greater when compared to other sources (Figure 5). Meanwhile, during the dry summer 470 and winter seasons, the contribution of SSTs decreased to less than about one-third of the 471 HR (winter 2017) and one-sixth of the GW (summer 2017). These results suggest that 472 SSTs are dominantly rain-fed, and that their discharge is in inherently governed by 473 fluctuations in precipitation amount, making them more variable on a seasonal basis, 474 unlike the steady and controlled discharge of WWTP effluents. It is noteworthy that 475 almost 200 single housing units with septic installations are drained by these small 476 streams, which makes them an important non-point source of pollutants to LSC, and 477 comparable to WWTPs as both are domestic wastewater sources to the lake (see below). 478 Therefore, the cumulative impact from changes in precipitation-driven discharge and 479 densification of the septic installations through housing development will likely influence 480 the water quality of these small streams and ultimately that of LSC (Moore et al. 2003). 481 To gauge the amplitude of these drivers, long-term monitoring of individual small 482 streams to gauge the amplitude of these drivers will be critically needed to assess, for 483 example, the impacts of deforestation, groundwater abstraction by sewage contraction or 484 housing development.
485 To reduce excessive nutrient mass loadings causing lake eutrophication, the 486 assessment of both non-point and point sources at the watershed scale is required (Moore 487 et al. 2003). Most of the phosphorus and nitrogen loading to LSC were transiting through 488 the HR (combined sources of WWTP-ST and septic installations) and SSTs, indicating
For Peer Review Only
489 the greater nutrient contributions from areas with higher number of individual septic 490 installations through diffuse runoff when compared to that from WWTP effluents (Figure 491 7). The relatively lower nutrient fluxes estimated for spring 2017 through SST flows 492 (approximately 4% of the seasonal budget) may be linked to the under-sampling of the 493 small tributaries (n=9) in April, which covered less than 43% of the SST watersheds. 494 Most of SSTs were still either frozen or were difficult to access. Most importantly, the 495 HR drains a large number of individual septic installations, approximately 2 700, septic
496 installations in the watershed of this large river. Therefore, our estimate of the relative 497 importance of individual septic installations draining domestic wastewaters through SSTs 498 is conservative.
499 The HR watershed is heavily impacted by human activities such as deforestation, 500 urbanization, erosion and recreational tourism (APEL 2014b). All of these activities have 501 the potential to contribute excessively to nutrient and fecal coliform fluxes (Smol 2008; 502 Wetzel 2011). Even though HR has nearly 10-fold mass fluxes of nutrients and fecal 503 coliforms than those of the WWTP-ST effluent, due to its higher discharge, the high fecal 504 coliform mass flux from WWTP-ST in winter 2017 (Figure 7) is not negligible. These 505 exceptionally large fecal coliform values could be linked to the recreational activities 506 occurring at the nearby upstream large ski resort over the winter period, which is 507 connected to the WWTP-ST, and the lower ambient temperature of the aerated lagoons 508 could be responsible for an insufficient treatment when compared to the performance 509 during the other seasons (Stein and Hook 2010). The seasonally-driven increase in
510 population within a watershed represents an important factor to consider when estimating 511 the overall source-specific nutrient and pollutant contributions.
For Peer Review Only
512 The DL (55 individual septic installations; Table 1) and WWTP-LD (connecting 513 600 inhabitants) showed the smallest nutrient and fecal coliform contributions to LSC. 514 The small community size and low discharge, with the occasional LSC inflow to DL 515 during high-flow seasons (waters flowing from LSC to DL instead of the normally 516 opposite flow direction), are the reasons why these two water sources make a small 517 contribution of pollutants (APEL 2014b), as compared to the WWTP-ST ( 5 000
518 inhabitants and close to 2 700 septic installations) and SSTs (ca. 200 septic installations). 519 Moreover, the WWTP-LD effluent runs into a marsh located in the northern basin of LSC 520 (Figure 1) that is most likely filtering excess nutrients and Fc (VeHRoeven and
521 Meuleman 1999; Knight et al. 2000; APEL 2014b). However, a more specific
522 investigation would be needed to evaluate the impact of the WWTP-LD during winter 523 and fall when filtration by senescent marsh plants is inefficient.
524 The largest nitrogen, phosphorous and fecal coliform mass fluxes from SST 525 runoff were detected during high-flow periods in the fall. The precipitation during fall of 526 both studied years were above the 1981-2010 normal (notably in October; Figure 2) and 527 are likely to have caused particularly high inputs of pollutants and nutrients over these 528 specific years. This seasonal increase in stream flow has been identified in other studies 529 (Nash and Gleick 1991; Rowe et al. 1994; Zhang et al. 2001; Barnett et al. 2005). On the 530 other hand, the higher precipitation during spring was not associated with exceptionally 531 high nutrient and fecal coliform mass fluxes (Figures 2 and 7). Spring flow depends on 532 water equivalent of the snowpack and on the local warming temperature rates that 533 directly influence lake ice-free conditions (Barnette et al. 2005; Ouranos 2015). Higher 534 winter temperatures, increasing precipitation, are inducing an earlier spring freshet and
For Peer Review Only
535 higher peak flow in recent years (Ouranos 2015). Winter temperatures were warmer 536 during our study period compared to the climate normal (January-February; Figure 2), 537 possibly shifting the spring SST flows earlier than anticipated for the sampling campaign. 538 Consequently, the peak spring flow might not have been entirely captured,
539 underestimating its importance in the overall budget. Changes in the seasonal
540 precipitation regime and temperature trends have important implications on stream flow 541 dynamics (IPCC 2014), and therefore on changes in the SST runoff and their mass flux 542 potentials. The urbanization of the SST watersheds, especially in the southern basin of 543 LSC, may have amplified the effects of increased runoff and ensuing contributions of 544 pollutants due to the associated rise in impermeable surfaces (e.g., asphalted). The SST 545 watersheds with higher urbanisation (HH, N, J, E, H, F, A, G and PP), indeed, had larger 546 concentrations of nutrients and Fc (Table 1).
547
548 Conclusion
549 Waters of Lake St. Charles (LSC) and its main water sources were sampled for two
550 consecutive years covering six seasons (summer 2016 - fall 2017). Oxygen and hydrogen
551 stable isotope signatures, and seasonal mass fluxes of nutrients and fecal coliforms, using
552 stream flow and concentration measurements, were used to estimate the seasonal
553 contributions of water to the lake. The contribution of the different water sources to LSC 554 varied seasonally, the most important being GW, HR and SSTs followed by WWTP, DL 555 and Precipitation (GW > HR > SSTs > WWTP > DL > Precipitation).
556 The major contributors of nutrients to LSC were HR, SSTs and WWTP-ST 557 effluents. During fall, nutrient and fecal coliform mass fluxes from SSTs were highly
For Peer Review Only
558 significant and triggered by large amounts of precipitation and increased stream flow. 559 Nearly 200 septic installations were included in the study, focusing on the area drained
560 by the SSTs (i.e., 34 small stream tributaries). The septic installations in the HR 561 watershed were not included in this study. These sources could potentially represent a
562 greater input of nutrients and fecal coliform loadings to LSC, depending on the efficiency 563 of natural degradation (i.e., of Fc) and sedimentation (P) along the hydrological pathways 564 and influenced by the transition time. WWTP effluents (ST and LD) remain an important 565 vector of pollutants when assessing lake water quality and sustainability (Vandenberg et 566 al. 2005). However, their contributions of pollutants remained less important compared to 567 those of individual septic installations within the lake watershed. The discharge of
568 WWTP effluents is relatively constant and controlled, unlike the naturally fluctuating 569 seasonal discharge of small stream flows.
570 Our results indicate that the management of this drinking water reservoir should 571 focus on controlling the excessive nutrients and fecal coliform loadings from the
572 widespread diffused runoff associated with individual septic installations within the LSC
573 hillslopes and sub-watersheds (i.e., SST watersheds). Given the fact that the LSC is 574 experiencing signs of eutrophication, HR and SST watersheds need to be regulated and 575 carefully managed as they have the potential to increase the current trophic state of the 576 lake. Management should deal with problems associated with residential area
577 development. The construction of a sewage network to connect old and new residential 578 and commercial buildings to the main Quebec City sewer system to minimize the effect 579 of diffuse runoff should be carefully considered. Changes in amount of seasonal
For Peer Review Only
581 urban-rural fringe have the potential to accelerate eutrophication of this already fragile 582 lake ecosystem. Mitigation strategies to eutrophication involve complex socioeconomic 583 issues, but a reduction at the source is clearly the best alternative for sustainable lake 584 management. This would unequivocally involve reducing the number of septic 585 installations within the LSC watershed by connecting these to the Quebec City sewer 586 networks and installing sewer systems in anticipation of future residential development. 587 This is likely to be socioeconomically beneficial in the long-term.
588
589 Acknowledgments
590 Many thanks to employees of APEL for water sampling, and to those of the Water
591 Quality Division of Quebec City for their assistance in the laboratory. A special thanks to 592 James Telford who helped with the stable isotope analyses. This work would not have 593 been possible without the shared financial support from a Mitacs Elevation Postdoctoral 594 Fellowship and APEL.
For Peer Review Only
595 References596 APEL (1981). Étude descriptive du bassin versant de Lac Saint-Charles, Association du
597 Lac Saint-Charles, 110 p.
598
599 APEL (2012). Rapport d’étape sur le suivi des cyanobactéries et de l'état trophique du
600 lac Saint- Charles en 2011, Association pour la protection de l’environnement du
601 lac Saint-Charles et des Marais du Nord, Québec, 143 p.
602
603 APEL (2014a). Diagnose du lac Saint-Charles, Mémoire. Association pour la protection
604 de l’environnement du lac Saint-Charles et des Marais du Nord, 43 p.
605
606 APEL (2014b). Diagnose du lac Saint-Charles, rapport final. Association pour la
607 protection de l’environnement du lac Saint-Charles et des Marais du Nord, 519 p.
608
609 APEL (2019) Diagnose du lac Saint-Charles – 2016. Association pour la protection de 610 l’environnement du lac Saint-Charles et des Marais du Nord, Québec, 377 pages. 611
612 APHA, AWWA & WEF (2005). Standard Methods for Examination of Water and
613 Wastewater, 21st ed. Washington D.C.
614
615• Aravena, R. Evans, M.L. & Cherry, J.A. (1992). Stable isotopes of oxygen and nitrogen
616 in source idetification of nitrate from septic systems. Ground water, 31(2): 180–186.
617 doi: 10.1111/j.1745-6584.1993.tb01809.x. 618
619 Arnade, L.J. (1999). Seasonal correlation of well contamination and septic tank distance. 620 Ground water, 37(6): 920–923. doi:10.1111/j.1745-6584.1999.tb01191.x.
621
622 Barnett, T.P., Adam, J.C., & Lettenmaier, D.P. (2005). Potential impacts of a warming
623 climate on water availability in snow-dominated regions. Nature Reviews,
624 438(7066): 303–309. doi:10.1038/nature04141. 625
626 Berman, E.S.F., Levin, N.E., Landais, A., Li, S. & Owano, T. (2013). Measurement of
627 δ18 O, δ17 O, and 17O‐excess in Water by Off-Axis Integrated Cavity Output
628 Spectroscopy and Isotope Ratio Mass Spectrometry. Analytical Chemistry,
629 85:10392-10398. doi:10.1021/ac402366t. 630
631 Clark, I. and Fritz, P. (1997). Environmental Isotopes in Hydrogeology. CRC 632 Press/Lewis Publishers, Boca Raton, 328 pp.
633
634 Coplen, T.B. (1996). New guidelines for reporting stable hydrogen, carbon, and oxygen
635 isotope – ratio data. Geochim. Cosmochim. Acta., 60: 3359–3360.
636 doi:10.1016/0016-7037(96)00263-3. 637
For Peer Review Only
640 Dansgaard, W. (1964). Stable isotopes in precipitation. Tellus XVI. doi: 641 10.3402/tellusa.v16i4.8993. doi:10.1111/j.2153-3490.1964.tb00181.x. 642643 Environemnt Canada (2017). National Climate Data and Information Archive. 644 http://climat.meteo.gc.ca/historical_data/search_historic_data_f.html. 645
646 Froehlich, K., Kralik, M., Papesch, W., Rank, D., Scheifinger, H., & Stichler, W. (2008).
647 Deuterium excess in precipitation of Alpine regions - Moisture recycling. Isotopes in
648 Environmental and Health Studies, 44(1): 61–70. doi:10.1080/10256010801887208 649
650 IPCC (2014). Climate Change 2014: Synthesis Report. Contribution of Working Groups
651 I, II and III to the Fifth Assessment Report of the Intergovernmental Panel on
652 Climate Change [Core Writing Team, R.K. Pachauri and L.A. Meyer (eds.)]. IPCC,
653 Geneva, Switzerland, 151 pp. 654
655• Knight, R.L., Payne Jr., V.W.E., Borer, R.E., Clarke Jr., R.A. & Pries, J.H. (1999).
656 Constructed wetlands for livestock wastewater management. Ecological
657 Engineering, 15(1-2): 41-55. doi: 10.1016/S0925-8574(99)00034-8. 658
659 APEL (2019). Étude sédimentaire du lac Saint-Charles (Québec). In Diagnose du lac
660 Saint-Charles – 2016. Association pour la protection de l’environnement du lac
661 Saint-Charles et des Marais du Nord, Québec, 377 pages.
662
663 Légaré, S. (1997). L’eutrophisation des lacs : le cas du lac Saint-Charles. Naturaliste 664 Can., 121: 65-68.
665
666 Légaré, S. (1998). Étude limnologique du lac Saint-Charles. Rapport GREPAUL 98- 667 238, Université Laval, Sainte-Foy (Québec). 106 p.
668
669 Ministère du Développement durable, de l'Environnement et des Parcs (MDDEP; 2008).
670 Guide technique, Captage d’eau souterraine pour des résidences isolées. Service de
671 l’aménagement et des eaux souterraines de la Direction des politiques de l’eau.
672
673 Moore, J.W., Schindler, D.E., Scheuerell, M.D., Smith, D., & Frodge, J. (2003). Lake
674 Eutrophication at the Urban Fringe, Seattle Region, USA. AMBIO: A Journal of the
675 Human Environment, 32(1): 13–18. doi:10.1579/0044-7447-32.1.13. 676
677 Narancic, B., Wolfe, B.B., Pienitz, R., Meyer, H., & Lamhonwah, D. (2017).
Landscape-678 gradient assessment of thermokarst lake hydrology using water isotope tracers.
679 Journal of Hydrology, 545: 327–338. doi:10.1016/j.jhydrol.2016.11.028. 680
681 Nash, L. & Gleick, P.H. (1991). Sensitivity of streamflow in the Colorado basin to
682 climatic changes. Journal Of Hydrology, 125: 221–241.
doi:10.1016/0022-683 1694(91)90030-L.
For Peer Review Only
686 CRC Press, Boca Raton. 995 p.687
688 Phillips, D.L., & Gregg, J.W. (2003). Source partitioning using stable isotopes : coping
689 with too many sources, Oecologia, 136: 261–269. doi:10.1007/s00442-003-1218-3.
690
691 Ptacek, C.J. (1998). Geochemistry of a septic-system plume in a coastal barrier bar,
692 Point Pelee, Ontario, Canada. Journal of Contaminant Hydrology, 33(3–4): 293–
693 312. doi:10.1016/S0169-7722(98)00076-X. 694
695 Ritchot, G., Mercier, G. & Mascolo, S. (1994). L’étalement urbain comme phénomène
696 géographique : l’exemple de Québec. Cahiers de géographie du Québec, 38 (105),
697 261–300. https://doi.org/10.7202/022451ar. 698
699 Robertson, W.D., Shiff, S.L. & Ptacek, C.J. (1998). Review of phosphate mobility and
700 persistence in 10 septic system plumes. Ground water, 36(6): 1000–1010.
701 doi :10.1111/j.1745-6584.1998.tb02107.x. 702
703 Rozanski, K., Araguas-Araguas, L. & Gonfiantini, R. (1993). Isotope patterns in modern
704 global precipitation. Science 80: 258, 981–985. doi:10.1029/GM078p0001.
705
706 Rowe, C.M., Kuivinen, K.C., & Flores-Mendoza, F. (1994). Sensitivity of streamflow to
707 climate change: a case study for Nebraska. Great Plains Research, 4(1): 27–49
708
709 Ouranos (2015). Vers l’adaptation. Synthèse des connaissances sur les changements
710 climatiques au Québec. Partie 1 : Évolution climatique au Québec. Édition 2015.
711 Montréal, Québec: Ouranos, 114 p.
712
713 Smol, J.P. (2008). Pollution of Lakes and Rivers: A Paleoenvironmental Perspective. 2nd
714 edition. Wiley-Blackwell Publishing, Oxford, 383 pp,
715
716 Statistics Canada, Environment Accounts and Statistics Division (2011). Survey of
717 drinking water plants and households and the environment survey.
718 https://www150.statcan.gc.ca/n1/pub/16-403-x/16-403-x2013001-eng.htm. 719 (accessed December 2018).
720
721 Stein, O.R. & Hook, P.B. (2010). Temperature, plant, and oxygen: How does season
722 affect constructed wetland performance? Journal of Environmental Science and
723 Health, 40(6-7): 1331-1342. doi:10.1081/ESE-200055840. 724
725 Tondu, J-M.E., Turner, K.W., Wolfe, B.B., Hall, R.I., Edwards, T.W.D. & McDonald, I. 726 (2013). Using water isotope tracers to develop the hydrological component of a
727 long-term aquatic ecosystem monitoring program for a northern lake-rich
728 landscape. Arctic, Antarctic, and Alpine Research, 45(4): 594–614. doi :
729 10.1657/1938-4246-45.4.594. 730
For Peer Review Only
732 paléolimnologique de l'histoire trophique du lac Saint-Charles, réservoir d'eau
733 potable de la communauté urbaine de Québec. Revue des sciences de l'eau, 4(2001):
734 489–510. doi:10.7202/705429ar. 735
736 Tremblay, R., & Pienitz, R. (2015). Caractéristiques limnologiques de 56 lacs du Québec
737 méridional en lien avec l’état trophique. Revue des sciences de l’eau, 28(2): 139.
738 doi:10.7202/1032295ar. 739
740 Turner, K.W., Wolfe, B.B., & Edwards, T.W.D. (2010). Characterizing the role of
741 hydrological processes on lake water balances in the Old Crow Flats, Yukon
742 Territory, Canada, using water isotope tracers, Journal of Hydrology, 386: 103–
743 117. doi:10.1016/j.jhydrol.2010.03.012 744
745 Vandenberg, J.A., Ryan, M.C., Nuell, D.D. & Chu, A. (2005). Field evaluation of mixing
746 length and attenuation of nutrients and fecal coliform in awastewater effluent plume.
747 Environmental Monitoring and Assessment, 107: 45–57.
doi:10.1007/s10661-005-748 2020-y.
749
750 VeHRoeven, J.T.A. & Meuleman, A.F.M. (1998). Wetlands for wastewater treatment:
751 Opportunities and limitations. Ecological Engineering, 12: 5-12.
752 doi:10.1016/S0925-8574(98)00050-0. 753
754 Wenling A., Shugui, H., Qiong, Z., Wangbin, Z., Shuangye, W., Hao, X., Hongxi, P., 755 Yetang, W. & Yaping, L. (2017). Enhanced Recent Local Moisture Recycling on the
756 Northwestern Tibetan Plateau Deduced From Ice Core Deuterium Excess Records.
757 Journal of Geophysical Research: Atmospheres, 122(23): 541–556. 758 doi:10.1002/2017JD027235.
759
760 Wetzel, R.G. (2001). Limnology: Lake and river ecosystems. San Diego: Academic 761 Press, 1006p.
762
763• Wernick, B.G., Cook, K.E., & Schreier, H. (1998). Land-use and streamwater nitrate-N
764 dynamics in an urban-rural fringe watershed. Journal of the American watrer
765 resources association, 34(3): 639–650. doi:10.1111/j.1752-1688.1998.tb00961.x. 766
767 Wilhelm, S.R., Schiff, S.L. & Cherry, J.A. (1996). Biogeochemical evolution of
768 domestic waste water in septic systems: 1. Conceptual model. Ground water,
769 32(6): 905–916. doi:10.1111/j.1745-6584.1994.tb00930.x. 770
771 Zhang, X., Harvey, K.D., Hogg, W.D., & Yuzyk, T.R. (2001). Trends in Canadian
772 streamflow. Water Resources Reserche, 37(4): 987–998.
773 doi:10.1029/2000WR900357. 774
For Peer Review Only
nutrient and fec
al coliform
concentrat
ions, es
timated
discharges, isotopic signat
ures, percentage
s of t
he catchm
ent with urbaniza
tion,
f s
ept
ic install
ations (SI) for wastewater tre
atment pl
ant (WWTP), Hurons River (HR), Delage L
ake (DL), small stre
am tributa ries (SS T ) and ed line represent s t he limit
between northern (upper)
and southern (lower) SSTs with respect to t
he lake basins. N
number of time
s t
he sources were sampled ove
r the study period.
TN (mg/l) TP (μ g P/l ) Fc (CFU/100ml) Discharge (m 3 /s) δ18O ‰ (± 0.2) δD ‰ (± 0.8) Area(ha) /Urb(%) SI Min. Max. Mean Min. Max. Mean Min. Max. Mean N Mean N Min Max Mean Min Max Mean 3.00 36.40 18.24 119.00 683.00 442.00 0.00 320.00 57.90 21 0.01 17 -11.48 -9.41 -10.26 -80.15 -66.32 -71.57 -2.14 13.50 7.21 112.00 1230.00 363.00 2.00 500.00 110.04 25 0.01 17 -12.14 -8.50 -10.07 -83.38 -63.91 -71.10 -0.26 0.70 0.46 6.10 57.70 14.83 6.00 2000.00 169.09 23 7.45 17 -12.23 -10.08 -11.13 -87.32 -63.73 -74.79 50*** 0.16 0.69 0.28 5.10 70.60 13.70 0.00 180.00 97.57 16 0.17 13 -12.23 -9.12 -9.81 -85.13 -63.62 -68.83 76/2 55 0.17 12.90 1.13 6.20 76.70 19.26 0.00 3500.00 286.53 14 0.05 8 -12.52 -8.90 -10.54 -87.68 -57.32 -70.92 19/2 1(1) 0.13 0.54 0.24 7.20 144.0 30.43 0.00 2300.00 183.07 8 0.01 9 -13.41 -8.99 -10.80 -89.26 -57.96 -71.74 8/5 0(0) 0.10 0.62 0.18 5.70 107.00 24.60 0.00 6000.00 476.08 10 0.01 9 -13.13 -8.91 -11.00 -90.31 -58.31 -73.93 263/1 0(0) 0.09 0.37 0.21 4.40 41.30 11.23 0.00 440.00 56.60 13 0.08 8 -12.81 -8.99 -10.18 -86.58 -64.51 -71.23 16/36 8(8) 0.60 1.86 1.34 10.10 120.00 45.78 0.00 210.00 54.33 5 0.00 -12.51 -9.67 -10.95 -86.31 -63.28 -74.81 62/3 24(28) 0.12 0.55 0.24 2.10 39.40 8.78 0.00 1000.00 144.38 14 0.03 11 -13.29 -9.38 -11.11 -89.54 -62.20 -74.24 31/7 2(2) 0.15 0.37 0.19 1.00 82.50 12.45 0.00 1300.00 93.63 15 0.01 10 -13.22 -8.96 -11.07 -89.95 -59.26 -74.57 4/30 1(1) 0.16 0.55 0.39 16.40 57.60 33.28 91.00 1500.00 378.50 6 0.00 3 -12.17 -9.49 -10.68 -87.71 -60.67 -73.70 13/7 6(6) 0.48 9.29 2.43 18.20 245.00 74.31 0.00 6000.00 448.33 14 0.00 9 -13.66 -9.41 -10.97 -93.78 -60.84 -73.47 8/11 4(4) 0.15 3.64 0.62 5.30 145.00 21.04 0.00 2400.00 204.31 12 0.00 9 -13.85 -7.93 -10.19 -94.34 -50.39 -67.68 11.07 5(5) 1.56 4.38 3.01 8.10 22.20 15.31 0.00 5500.00 846.43 6 0.00 6 -12.47 -9.47 -11.33 -87.39 -62.34 -77.63 4/68 11(11) 0.62 8.08 2.65 3.20 93.10 15.74 0.00 3500.00 292.64 14 0.00 15 -13.75 -8.04 -10.79 -94.09 -50.36 -72.04 6/9 1(1) 0.22 0.60 0.40 12.00 88.90 29.44 0.00 400.00 115.80 0.00 -3/9 2(2) 0.16 0.68 0.37 2.50 110.00 14.85 0.00 170.00 40.64 15 0.00 9 -13.81 -9.95 -11.33 -93.51 -65.50 -76.17 3/5 1(1) 0.11 0.69 0.23 2.70 37.80 7.12 0.00 110.00 20.73 15 0.00 9 -13.47 -9.31 -11.08 -90.62 -62.95 -73.86 15/10 7(7) 0.23 0.68 0.41 24.50 46.70 35.20 6.00 360.00 146.33 3 0.00 5 -12.57 -9.34 -10.48 -88.91 -60.64 -72.16 0.33 1.86 0.94 14.70 36.70 28.12 5.00 280.00 87.67 -7 -13.06 -7.17 -9.74 -90.40 -45.60 -67.61 122/34 41(77) 0.38 0.97 0.63 27.40 244.00 89.70 1.00 1000.00 153.25 8 0.00 7 -12.79 -9.43 -10.51 -88.36 -63.27 -71.54 0/1 1(1) 0.2 0.64 0.4 34.50 81.00 63.00 30.00 9400.00 3154.00 1 0.0 5 -13.67 -8.43 -10.34 -92.13 -57.76 -70.10 2/51 3(3) 0.16 0.74 0.44 13.00 1710.00 144.27 18.00 16000.00 1952.07 15 0.01 9 -13.43 -10.59 -11.47 -90.13 -71.72 -77.14 38/10 20(20) 0.42 1.32 0.77 18.10 52.10 32.43 0.00 5000.00 869.45 9 0.01 8 -12.43 -8.50 -9.78 -89.91 -52.48 -65.22 39/40 20(22) 0.42 0.76 0.56 5.80 57.50 17.02 0.00 1300.00 162.07 14 0.01 9 -13.58 -9.94 -11.76 -91.29 -68.04 -92.72 59/16 27(70) 0.16 0.52 0.26 8.50 154.60 36.524 14.00 3140.00 393.18 16 0.15 7 -12.40 -9.17 -10.69 -83.42 -61.39 -72.34 359/3 16(55) 0.60 3.19 1.38 21.75 96.20 42.81 8.50 900.00 306.60 -4 -14.00 -6.95 -10.62 -100.67 -42.38 -72.63 1/92 0(12) 0.40 0.80 0.55 20.70 42.10 31.00 22.00 2400.00 764.00 -7 -12.04 -9.33 -10.26 -83.62 -60.78 -69.35 44/38 19(67) 0.62 1.11 0.86 37.40 78.90 49.15 46.00 1500.00 484.50 -5 -11.45 -9.09 -9.70 -81.10 -60.52 -66.41 4/28 1(10) 0.23 0.66 0.45 20.55 177.00 75.748 4.50 3650.00 772.96 -8 -10.08 -7.13 -8.63 -69.64 -49.34 -58.65 7/61 0(29) 0.34 1.38 0.81 16.80 79.05 36.78 57.50 6050.00 1226.67 21 0.05 11 -11.93 -7.85 -10.07 -83.15 -55.03 -69.43 249/31 15(55) URL: https://mc.manuscriptcentral.com/tcwr
For Peer Review Only
0.53 5.54 3.03 7.75 142.25 36.03 0.00 2900.00 371.22 14 0.00 9 -12.83 -8.54 -10.91 -87.39 -55.05 -73.55 14/45 2(71) 0.04 4.84 1.32 13.90 369.00 60.22 11.00 6000.00 833.00 13 0.00 9 -13.97 -7.87 -10.5 -92.72 -49.86 -71.2 401/17 7(171) 0.19 0.47 0.37 18.40 81.60 48.40 240.00 2200.00 1220.00 1 0.00 4 -12.87 -8.53 -10.16 -86.13 -57.08 -67.53 0/48 10(0) 0.16 12.50 4.49 76.90 499.00 218.70 24.00 260.00 142.00 2 0.01 1 --12.89 --88.94 4/92 0(35) 0.16 0.40 0.27 29.70 165.00 81.70 100.00 1500.00 800.00 2 0.00 1 --13.10 --90.62 3/93 0(31) 0.46 8.55 2.36 0.00 252.00 56.74 0.00 3600.00 812.13 -7 -11.79 -3.77 -9.75 -83.79 -22.61 -66.89 8/63 0(37) 0.18 0.34 0.26 8.90 11.90 10.19 0.00 16.00 4.91 -23 -12.86 -9.61 -10.66 -87.12 -63.00 -72.30 -0.24 0.41 0.33 7.80 17.60 11.08 0.00 31.00 7.91 -23 -12.36 -9.64 -10.75 -85.96 -63.15 -72.18 -0.28 0.35 0.31 8.70 10.40 9.40 -3 -11.51 -12.40 -11.51 -86.74 -78.65 -78.65 -0.27 5.88 0.66 6.30 119.00 22.31 0.00 180.00 28.17 -21 -12.71 -9.44 -10.96 -89.64 -64.53 -74.22 -0.28 0.39 0.33 10.10 15.60 13.27 0.00 48.00 12.33 -21 -12.53 -9.25 -10.79 -86.61 -62.00 -73.03 -nts hous es wit h s ept ic tanks situat ed between the WWTP-ST and the l ake (ca. 3 km). URL: https://mc.manuscriptcentral.com/tcwrFor Peer Review Only
small stream tributaries (SST), groundwater (GW), wastewater treatment plant (WWTP), Delage Lake (DL) and precipitation (rain + snow).
Sample Summer 2016 Fall 2016 Winter 2017 Spring 2017 Summer 2017 Fall 2017
δ18O δD δ18O δD δ18O δD δ18O δD δ18O δD δ18O δD WWTP -10.14 -70.7 -9.42 -66.54 -11.06 -74.67 -11.51 -80.08 -10.36 -79.12 -9.84 -68.95 HR -11.1 -74.82 -10.24 -68.18 -12.07 -79.51 -12.18 -86.35 -10.84 -73.01 -10.23 -64.14 DL -9.25 -63.8 -9.83 -68.01 -11.59 -80.68 -9.45 -68.17 -9.13 -66.87 SSTs -10.12 -68.39 -9.52 -64.72 -11.07 -75.32 -12.77 -86.29 -10.24 -70.08 -9.27 -62.12 GW* -12.08 -81.3 -11.86 -81.33 -11.46 -78.58 -12.08 -81.51 -11.84 -80.67 Rain -8.87 -58.92 -8.93 -56.52 -9.08 -59.32 -9.17 -62.99 -9.17 -62.49 Snow -11.22 -81.89 * Not weighted
For Peer Review Only
ass
fl
ux of TN (total nit
rogen), TP (total phosphorous) and Fc (feca
l coliform) ba se d on measured discharge s a nd concentrati ons in reatment plant effluent of S toneham-and-Te w ke sbury (W WTP-ST), H urons Rive r (H R), waste w ater treat ment plant e ffluent of City of L ac Delage (WW s tream tributa ry runoffs (SSTs). Summer 2016 Fall 2016 Winte r 2017 Spring 2017 Summer 2017 Fall 2017 TN (kg/d) TP (kg/d) Fc (CFU/d) TN (kg/d) TP (kg/d) Fc (CFU/d) TN (kg/d) TP (kg/d) Fc (CFU/d) TN (kg/d) TP (kg/d) Fc (CFU/d) TN (kg/d) TP (kg/d) Fc (CFU/d) TN (kg/d) 342.3 10.02 14x10 9 137.95 13.91 23x10 9 992.47 19.03 802x10 9 947.01 26.45 100x10 9 604.19 7.51 5x10 9 120.47 2310.31 93.74 9765x10 9 1825.3 46.36 1962x10 9 9464.09 303.30 6524x10 9 5981.43 661.59 221432x10 9 4265.03 66.16 3.13 16x10 9 63.4 1.19 4x10 9 122.42 5.27 2x10 9 233.98 13.38 78x10 9 66.58 3.58 17x10 9 74.81 58.79 2.45 18x10 9 41.78 1.14 51x10 9 70.59 2.97 4x10 9 41.4 1.87 17x10 9 34.93 90.47 10.78 510x10 9 240.63 76.37 12286x10 9 352.94 11.40 182x10 9 133.63 10.22 1 579x10 9 3438.29 URL: https://mc.manuscriptcentral.com/tcwr
For Peer Review Only
Figure 1. The Lake St. Charles along with location of municipal boundaries (red line), 38
surface water and 5 ground water (GW) sampling stations, bathymetry of Lake St. Charles and septic installation locations. The shaded area represents diffuse (i.e. hillslope) runoff to Lake St. Charles. Small stream catchments are outlined for each stream tributary (grey line). The
sampling points WWTP-LD and WWTP-ST represent the wastewater treatment plan effluents of City of Lac Delage and Stoneham-and-Tewkesbury, respectively.
DL HR City of Huro ns Rive r Dam s km
For Peer Review Only
Figure 2. Mean monthly air temperature (°C; lines) and total monthly precipitation (mm; vertical
bars) recorded at the Jean Lesage international airport weather station (Station ID: 701S001) for year 2016 and 2017 compared to the 1981–2010 period (Environment Canada, 2017).
For Peer Review Only
Figure 3. Isotope compositions of Lake St. Charles (LSC; dark blue) and of inflows: Hurons
River (HR, light turquoise), small stream tributaries (SST, orange), wastewater treatment plant (WWTP, grey) effluents, groundwater (GW, light blue), Delage Lake (DL, yellow), and precipitation (dark pink for rain and light pink for snow) relative to the Local and Global Meteoric Water Line (LMWL and GMWL). The seasons were defined by astronomical calendar following the equinoxes and solstices.
-14 -13 -12 -11 -10 -9 -8 -7 -6 -5 -4 -90 -80 -70 -60 -50 -40 -30 GMW L δ18O (‰ VSMOW) GMWL: δD = 8 x δ18O + 10 δD (‰ V S M O W ) LMWL: δD = 8.58 x δ18O + 15.36 LMW L -14 -13 -12 -11 -10 -9 -8 -7 -6 -5 -4 -90 -80 -70 -60 -50 -40 -30 δ18O (‰ VSMOW) δD (‰ V S M O W ) GM W δD (‰ V S M O W ) -14 -13 -12 -11 -10 -9 -8 -7 -6 -5 -4 -90 -80 -70 -60 -50 -40 -30 -20 Winter 2017 δ18O (‰ VSMOW) GMW L LMW L -14 -13 -12 -11 -10 -9 -8 -7 -6 -5 -4 -90 -80 -70 -60 -50 -40 -30 -20 Spring 2017 δ18O (‰ VSMOW) GMW L LMW L δD (‰ V S M O W ) δD (‰ V S M O W ) -14 -13 -12 -11 -10 -9 -8 -7 -6 -5 -4 -90 -80 -70 -60 -50 -40 -30 -20 Summer 2017 δ18O (‰ VSMOW) GMW L LMW L -14 -13 -12 -11 -10 -9 -8 -7 -6 -5 -4 -90 -80 -70 -60 -50 -40 -30 -20 Fall 2017 δ18O (‰ VSMOW) δD (‰ V S M O W ) GM WL LMW L