Cerebral stiffness changes due to
vasoreactivity during visual
activation measured with intrinsic
Magnetic Resonance Elastography
Author:
Reihaneh F
OROUHANDEHPOURJury Committee:
Supervisor: Prof. Elijah VANHOUTEN
Co-Supervisor:Prof. Kevin WHITTINGSTALL
Internal jury:Prof. Maxime DESCOTEAUX
External jury:Prof. Nicolas QUAEGEBEUR
A thesis submitted in fulfillment of the requirements
for the degree of Master of Science
in program of Radiation Sciences and Biomedical Imaging
in the
Faculty of Medicine and Health Sciences
Department of Nuclear Medicine and Radiobiology
“The good thing about science is that it’s true whether or not you believe in it.” Neil deGrasse Tyson
Abstract
Faculty of Medicine and Health Sciences Department of Nuclear Medicine and Radiobiology
Master of Science
Cerebral stiffness changes due to vasoreactivity during visual activation measured with intrinsic Magnetic Resonance Elastography
by Reihaneh FOROUHANDEHPOUR
This thesis presents the multi modality Magnetic Resonance imaging (MRI) study of the human brain, developed at the university of Sherbrooke with the main objective to develop a method to perform functional imaging via in-trinsic MR Elastography(iMRE). MRE is able to characterize the mechanical properties of soft tissue such as shear stiffness either by intrinsic or extrinsic mechanical activation. Measuring brain mechanical properties with iMRE requires an efficient method to overcome the challenge of low frequency dis-placement fields and the physiological signals at the same frequency range. Here in this thesis we present the steps required to perform iMRE while vi-sually stimulating the brain and obtaining regions of activation. The iMRE results were combined with Blood Oxygen Level Dependant fMRI (BOLD fMRI) and Time Of Flight (TOF) data that provide maps of brain activation and images of cerebral vasculature, respectively, to help identify the origins of fiMRE activation regions.
Two types of fiMRE activations were observed in the brain in the primary visual cortex and bilateral Middle Temporal areas, with one activation type showing a decreased shear stiffness and the other showing increased shear stiffness due to visual stimulus, respectively. Such ability to differentiate two mechanisms of the brain activity observed by fiMRE is novel and provides complementary information to conventional BOLD fMRI. These fiMRE ac-tivation regions appeared to be related to vasoreactivity mechanisms such as vasodilation. In particular, regions with decreased shear stiffness activity were found to be close to the P4 segment of the Posterior Cerebral Artery
(PCA) which is known to dilate due to visual stimulation. The measurement of fiMRE activation regions and their distance to the cerebral arteries shows that the closer the regions are to the arteries the more significant changes occur in the shear stiffness. The findings of this study represented in this thesis, allow us to better comprehend the hemodynamics and biomechanical mechanisms underlying vasoreactivity.
Keywords: MR Elastography, Intrinsic MR Elastography, Functional Imag-ing, Elasticity, Brain stiffness, Vasoreactivity.
vi
Résumé
Faculté de médecine et des sciences de la santé Département de médecine nucléaire et radiobiologie
Changement de la rigidité cérébrale dues à la vasoréactivité lors de l’activation visuelle mesurée par élastographie intrinsèque par résonance
magnétique
Par Reihaneh Forouhandehpour
Cette étude présente l’expérience multimodalité d’imagerie par résonance magnétique (IRM) sur le cerveau humain, développée à l’Université de Sher-brooke, avec l’objectif principal de développer une méthode pour effectuer l’imagerie fonctionnelle par élastographie IRM intrinsèque (iMRE). L’ERM est capable de caractériser les propriétés mécaniques des tissus mous telles que la rigidité en cisaillement avec deux procédures principales appelées ERM extrinsèque et intrinsèque. La mesure des propriétés mécaniques du cerveau avec iMRE nécessite une méthode efficace pour surmonter le défi des champs de déplacement à basse fréquence et des bruits intrinsèques dans la même gamme de fréquences. Ici, dans ce mémoire, les étapes de la méth-ode pour effectuer l’iMRE tout en stimulant visuellement le cerveau et en obtenant des régions d’activation sont présentées. Les résultats de l’iMRE ont été combinés avec l’imagerie par résonance magnétique fonctionnelle dépendant du niveau d’oxygène sanguin (BOLD fMRI) et le temps de vol par angiographie (Time Of Flight Angiography (TOF)) qui fournissent, re-spectivement, les cartes d’activation cérébrale et des images de la vasculari-sation cérébrale, pour trouver les origines des régions d ’activations fiMRE.
Deux types d’activations fiMRE ont été observés dans le cerveau dans le cortex visuel primaire et dans les zones temporales moyennes bilatérales. La première montrant une diminution de la rigidité en cisaillement et la seconde une augmentation de l’activité de la rigidité en cisaillement corrélée stimu-lus visuel. Une telle capacité à différencier deux mécanismes de l’activité cérébrale observée par fiMRE est nouvelle et fournit des informations com-plémentaires à la BOLD fMRI conventionnelle. Ces régions d’activation fiMRE semblaient être liées à des mécanismes de vasoréactivité tels que la vasodi-latation, en particulier les régions avec une diminution de l’activité de rigid-ité en cisaillement ont été localisées en proximrigid-ité du segment P4 de l’artère
cérébrale postérieure (ACP), connue de se dilater lors de la stimulation vi-suelle. La mesure de la relation entre les régions d’activation fiMRE et leur distance aux artères cérébrales a montré que plus les régions sont proches des artères, plus la variation de la rigidité au cisaillement est importante.
Les résultats de cette étude présentés dans ce mémoire nous permet de mieux comprendre l’hémodynamique du cerveau et les caractéristiques mé-caniques à la base de la vasoréactivité.
Mots clés: Élastographie par résonance magnétique, Élastographie IRM in-trinsèque, Imagerie fonctionnelle, Élasticité, Rigidité cérébrale, Vasoréactiv-ité.
Van Houten, who gave me the opportunity to work on this project. He sup-ported me through each stage of my study and always encouraged me even when the road got tough. His understanding is exemplary, he never with-held his help from me and patiently guided me to learn more. Without his persistent help, the goal of this project would not have been realized.
I would also like to show my gratitude to my co-supervisor, Professor Kevin Whittingstall, for his guidance through the process of my research. He always showed me the right path and helped me to get the best results.
Professor Maxime Descoteaux, my mentor, who I also took a course with him, taught me instrumental tools for biomedical image reconstructions which helped me substantially to perform my research. For this, I am extremely grateful.
I would like to acknowledge Guillaume Gilbert, our MRI lab technician, who has the substance of a genius. I was never worried that my imaging session go wrong if he was present. Michaël Bernier, Samantha Cote, Russell Butler, Julien Testu and Alexendre Brazy, my labmates, generously helped me to learn and perform everything crucial for my research. I would like to recognize the invaluable assistance that you all provided during my study.
Contents
Abstract v Résumé vi Acknowledgements vii 1 Introduction 1 2 Literature review 3 2.1 Elastography . . . 32.1.1 Magnetic Resonance Elastography . . . 3
2.1.2 Extrinsic MR Elastography . . . 6
2.1.3 Intrinsic MR Elastography . . . 6
2.1.4 Mechanical Properties . . . 7
2.2 Vasoreactivity . . . 8
2.2.1 The Role of Mechanical Properties in Vasoreactivity . . 10
3 Methodology 11 3.1 Image Reconstruction. . . 11
3.1.1 MR Elastography . . . 11
The forward problem . . . 11
The Subzone based inverse problem . . . 11
fiMRE subzone NLI . . . 13
Processing fiMRE regions of activation . . . 13
3.1.2 BOLD fMRI . . . 15
3.1.3 Time of Flight . . . 15
Vessel extraction method . . . 15
fiMRE and the vasculatures . . . 17
3.2 Image registration and segmentation . . . 21
3.3 Volumetric reprojection. . . 22
3.3.1 Volumetric reprojection of fiMRE activation regions . . 25
4 Article 27 4.1 Résumé . . . 28
4.2 abstract . . . 28
4.3 Introduction . . . 29
4.4 Materials and Methods . . . 30
4.4.1 Image acquisition . . . 30
4.4.2 Intrinsic MR Elastography reconstruction . . . 31
x
4.4.4 ToF processing . . . 32
4.4.5 Axial and volumetric reprojection . . . 32
4.4.6 Relating changes in arterial diameter and stiffness . . . 33
4.5 Results . . . 34
4.6 Discussion . . . 39
4.7 Conclusion . . . 42
4.8 Acknowledgement . . . 43
4.9 Author contributions statement . . . 43
5 Discussion 45 5.1 Limitations of the image acquisition . . . 45
5.2 Elastography reconstruction . . . 46
5.3 Results comparison . . . 47
5.4 Clinical application . . . 48
6 Conclusion 51
List of Figures
2.1 Ultrasound Elastography of breast . . . 4
2.2 MRE of liver . . . 5
2.3 Extrinsic MRE setup experiment . . . 6
2.4 Brain Intrinsic motions . . . 7
2.5 Neurovascular coupling . . . 9
2.6 Stress relaxation function. . . 10
3.1 Finite element mesh. . . 12
3.2 Raw iMRE . . . 13
3.3 fiMRE region processing . . . 14
3.4 Isolated fiMRE regions . . . 14
3.5 BOLD fMRI stimulus block design . . . 15
3.6 BOLD fMRI activation maps . . . 16
3.7 Vessel extraction method . . . 16
3.8 An increased and decreased µ activities . . . 17
3.9 Arteries and fiMRE regions . . . 18
3.10 Centerlines . . . 19
3.11 Measuring fiMRE activation voxel distances to the vessel . . . 20
3.12 Measuring fiMRE activation voxel distances to the vessel 2 . . 20
3.13 Brain tissue segmentation . . . 22
3.14 3D regions . . . 23
3.15 Volumetric reprojection method . . . 23
3.16 Reprojection method . . . 24
3.17 Morphological dilation . . . 24
3.18 Axial projection of fiMRE activation regions . . . 25
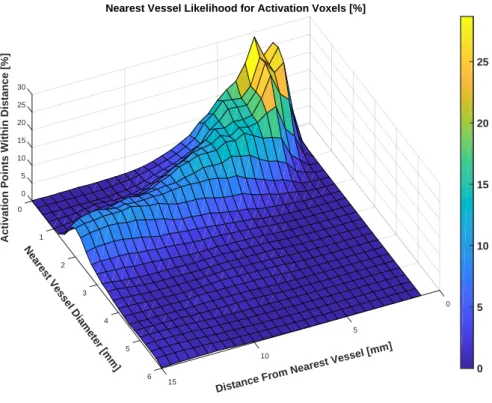
3.19 Cerebrovascular atlas and the volumetric reprojection of fiMRE 26 4.1 Volumetric reprojection and BOLD fMRI activation regions . 35 4.2 Distribution of voxels as a function of the diameter of and the distance to the nearest vessel . . . 37
4.3 Sample fiMRE activation region compared to ToF images . . . 38
4.4 Stiffness factor vs. dilation regression slopes as a function of distance. . . 39
5.1 Standard 4D-flow sequence with a low VENC . . . 46
List of Tables
2.1 Elastic moduli . . . 8
4.1 Average Stiffness Factors within the fiMRE activiation regions 34
4.2 Average stiffness changes in BOLD fMRI and fiMRE activation
regions . . . 36
4.3 Percentage distribution of fiMRE activation regions in brain
tissues . . . 36
List of Abbreviations
BOLD fMRI Blood Oxygen Level Dependant functional Magnetic Resonance Imaging CHUS Centre Hospitalier Universitaire (de) Sherbrooke
CA Cerebral Autoregulation CBF Cerebral Blood Flow CBV Cerebral Blood Volume
CSVD Cerebral Small Vessel Disease CSF CcerebroSpinal Fluid
DIET Digital Image Elasto - Tomography
eMRE extrinsic Magnetic Resonance Elastography FEM Finite Element Method
fMRI functional Magnetic Resonance Imaging
fiMRE functional intrinsic Magnetic Resonance Elastography iMRE intrinsic Magnetic Resonance Elastography
MRE Magnetic Resonance Elastography MRI Magnetic Resonance Imaging MCA Middle Cerebral Artery
MSFDF Multi-Scale Frangi Diffusive Filter NVC NeuroVascular Coupling
PET Positron Emission Tomography SMC Smooth Muscle Cell
SWI Susceptibility Weighting Imaging ToF Time of Flight
List of Symbols
µ Shear storage modulus Pa
E Young’s modulus Pa K Bulk modulus Pa u Displacement filed m ρ Density g/m3 ω Frequency Hz ν Poisson’s ratio λ Lame’s first costant σ Stress tensor
ϵ Strain tensor δ Kronecker delta
Chapter 1
Introduction
"How does a human brain function?". The answer to this apparently simple question is a key to revealing the mystery behind homo-sapiens being the most intelligent mammals on planet earth and have engaged many curious scientists to develop several methods and technique to find that answer. In this quest, probably one of the most significant scientific inventions, is Mag-netic Resonance Imaging (MRI), that allowed us to observe the brain in great details without opening the skull. To date, this non invasive imaging tech-nique has developed several distinct techtech-niques, each allowing us to look at one specific aspect of the brain and provide accurate, quantitative measure-ments. One of these imaging techniques is Magnetic Resonance Elastography (MRE), which provides qualitative and quantitative measurements of soft tis-sue mechanical properties. Investigating the mechanics of the brain not only broadens our perspective of understanding brain function, but also provides essential information about brain pathologies (such as tumors) which may significantly change the mechanical properties of the brain tissue.
Here in this project, our main objective was to develop a novel method to perform a functional imaging with intrinsic Magnetic Resonance Elastog-raphy (fiMRE) while stimulating the visual cortex, and eventually find the origins of stiffness changes during visual cortex activation. This research was performed within VÉNUS research group in Department of Mechanical Engineering, Faculty of Engineering as well as SNAIL Lab in Department of Nuclear Medicine and Radiobiology, Faculty of Medicine and Health sci-ences (Centre Hospitalier Universitaire de Sherbrooke (CHUS)) of the Uni-versity of Sherbrooke. VÉNUS works on different imaging methods to char-acterize the mechanical properties of soft tissue, such as Digital Image Elasto-Tomography (DIET) of breast and MR Elastography of brain. Julien Testu, a former master student in our group performed a multi-frequency extrin-sic MR Elastography of human brain and measured the brain shear stiff-ness with the Non-Linear Inversion (NLI) viscoelastic reconstruction in a 10−50Hz actuating frequency span [59]. The NLI viscoelatic reconstruc-tion [21, 60, 65] is the same reconstruction used in this research to produce the mechanical properties. On the other hand in SNAIL Lab, the goal is to understand the neurovascular coupling mainly using functional Magnetic Resonance Imaging (fMRI). Recently, Michaël Bernier a former PhD student in the lab, used Susceptibility Weighting Imaging (SWI) and Time-of-Flight Magnetic Resonance Angiography (ToF) and developed a vessel extraction method and created the Cerebrovascular atlas of the human brain [4].
2 Chapter 1. Introduction Combining the potentials of two groups, in this study we performed mul-timodality imaging with functional iMRE and ToF as well as Blood-Oxygen-Level-Dependant functional MRI (BOLD fMRI). While stimulating visual cor-tex, fiMRE allowed us to observe the shear stiffness changes throughout the brain, ToF represented vessel dilation and contractions and BOLD fMRI showed the activated visual cortex. Several image post processing techniques were developed to link together the findings of each image modality. Eventu-ally this novel technique, allowed us to investigate the role of vasoreactivity mechanisms such as vasodilation and vasoconstriction, in the shear stiffness changes observed in fiMRE.
In this thesis, first a basic background of Elastography methods is pro-vided. Specifically, Magnetic Resonance Elastography methods which used in this study and two different methods to generate shear waves in tissue are presented. Then an overview about vasoreactivity is given and the role of mechanical properties in vasoreactivity is discussed (chapter2). In the next chapter (chapter3), the overall description of image reconstruction methods used to process the MR images in this research is provided. An article con-ducted from this study is presented in chapter4. At the end, the conclusion of the findings of this study is presented in chapter5.
Chapter 2
Literature review
2.1
Elastography
Many pathologies can change the structure and mechanical properties of soft tissue. Since early in the history of medicine, human have used palpation as a reliable method to diagnose the pathology from the healthy tissue. Even though this method is still being used in early stages of diagnosis by physi-cians, it is a qualitative measurement while a quantitative measurement is more favourable for medical purposes. In addition, the use of palpation is limited to the organs accessible by hand externally therefore, organs located deeper in the body or covered by bones like brain are out of reach for this method. These limitations can be resolved by using non-invasive medical imaging with Elastography that provides qualitative and quantitative infor-mation about the mechanical properties of the tissue [19]. Elastography uses internal or external mechanical forces to generate tissue deformation then detects the response of tissue to that force. Ultrasound and Magnetic Reso-nance Imaging are two common tools that can perform these steps. Figure
2.1shows one example of Ultrasound Elastography(UE) image in breast and compares its potential with conventional Sonography and Mammography techniques [70]. These images represent a lesion miss diagnosed as benign with Mammography and Sonography images (figure2.1.A and2.1.B (right), respectively) that considered to be a stage 5 breast cancer [25] using Ultra-sound Elastography (figure2.1.B (left).
2.1.1
Magnetic Resonance Elastography
Magnetic Resonance Elastography (MRE) provides reliable measurments and high resolution images of tissue elasticity. MRE has been used to monitor the mechanical charasteristics of tissue in different in vivo organs such as breast [43, 54], liver [69], skeletal muscles [51] and brain [17]. Currently one of the main clinical application of MRE is for non invasive diagnosis and staging of liver fibrosis. Liver tissue stiffness increases through different stages of hep-atic fibrosis and MRE proved to be able to accurately measure these changes [69]. Figure 2.2 shows MRE images of fibrotic and normal liver and it can be seen that fibrotic liver has higher shear stiffness compared to the normal liver [69].
4 Chapter 2. Literature review
FIGURE 2.1: A breast lesion (Invasive ductal carcinoma) in a 55 years old woman shown in A, Mammography B, Sonogra-phy on the right and B and Ultrasound elastograSonogra-phy on the left. This lesion was diagnosed to be benign in the Mammo-gram and Sonographic images, while UE image shows a stage 5 malignant breast lesion. The blue region representing the le-sion in UE image is relativity larger than the region shown in Sonographic image, showing the accuracy of UE comparing to
the Sonography.[70]
Despite being successful in diagnosing fibrosis, MRE has not been fully developed yet for clinical applications in the brain. In measuring brain tissue mechanical properties, MRE is more advantagous compared to other meth-ods becasue it is not limitied by the skull. However, many studies used MRE to assess brain mechanical properties in different pathologies such as brain tumors, Multiple sclerosis and etc, the achived data have not been used for diagnostic purposes and research is needed to fully develop these evolving MRE applications [18].
There are three main steps to perform MR Elastography [38]. The first step is to induce mechanical shear waves into the tissue. This can be done using in vivo internal and natural motion sources (intrinsic) or with the help of external actuators (extrinsic). The frequency of these waves ranges from
the phase of MR sequences using motion encoding gradients(MEG). Thus, MEGs oscillate with the same frequency as shear waves to achieve the MR deformation imaging [46]. The phase shift ϕ induced in the MR signal by these induced motions is given with the equation2.1:
ϕ(⃗r, θ) = γNT(⃗G· ⃗ξ0)
2 cos(⃗K·⃗r+θ) (2.1) Where⃗r is a spin position vector, θ is the relative phase of shear waves and MEGs, γ is the gyromagnetic ratio, N is the number of gradient cycles, T is the period of MEG, ⃗G is MEG amplitude,ξ⃗0 is the displacement vector
and⃗K is the shear wave vector.
Finally, the measured displacement fields are reconstructed to produce the mechanical propertiy images of the tissue. There are two main recon-struction models for this purpose based on the mechanical models of tissue, viscoelastic and poroelastic reconstructions and the suitablity of each can be decided based on the type and frequency of induced wave motions [42].
FIGURE2.2: MRE of normal and fibrotic liver. The first column
from left shows the anatomic images. The second column are the wave images, showing the longer propagating shear waves in the fibrotic liver compared to the normal liver. The third col-umn are the MRE images and representing a higher shear
6 Chapter 2. Literature review
2.1.2
Extrinsic MR Elastography
As discussed before, one essential step to perform MRE is to induce motion into the tissue. To do so, MRE can use the external driver devices with the ability to produce a harmonic motion field within the tissue. This method is called "extrinsic" MR Elastography (eMRE). There are different devices cable of creating the shear waves such as an electromechanical driver which works with the magnetic field of MRI machine itself, piezoelectric drivers, acoustic speaker systems and pneumatic drivers [38]. These devices can produce a wide range of frequencies from 10 - 500 Hz. An example of application of an external driver on brain is shown in figure2.3. A pillow shaped passive driver is placed under patient’s head and is connected to an active pneumatic driver device in the MRI control room [29]1.
FIGURE 2.3: A brain extrinsic MRE setup experiment. The pneumatic driver induces the harmonic shear waves into the
brain(www.resoundant.com) [29].
2.1.3
Intrinsic MR Elastography
Brain is a highly vascularized organ and with each heartbeat it receives a strong carotid pulse pressure of≈6KPa. The use of this natural cardiac pulse pressure as a source of shear waves needed to perform MRE can overcome the adversity of using external actuators. Performing MRE with cardiac pulse motions which is called "intrinsic" MR Elastography (iMRE), is advantageous compared to eMRE methods because the need to vibrate the patient’s head is removed, so the patient experiences a normal MRI exam. In addition, since the motion sources are internal, iMRE shear waves are not limited to damp-ings caused by skull which happens during eMRE, allowing MRE imaging at lower frequencies more closely related to physiological effects. Figure2.4
of a pulse oximeter placed on the subject’s finger. The pulsations were en-coded into the phase-contrast gradient echo angiography sequences and the motions were measured during 8 cardiac phases.
FIGURE2.4: Intrinsic motions in the brain induced due to car-diac pulsations. [65]
2.1.4
Mechanical Properties
Elasticity and viscosity are two mechanical aspects of solid materials. When a force is applied to a material, elastic materials undergo immediate defor-mation, while the viscous deformation response is time-dependant. In reality materials like biological tissues have both elastic and viscous properties and viscoelasticity is the term used to describe them. To investigate the viscoelas-tic properties of a material the relationship between applied stresses and the resulting strains are considered. Stress is the force per unit area described as
σ= AF, and strain (ϵ) is the deviation of the tissue from its original shape,
de-fined as dudx, where u is the displacement field within the material. A simple linear relationship between stress and strain is defined by Hooke’s law [20]:
σ =Cϵ (2.2)
C is the elastic moduli relating the stress and strain. Many mechanical models were developed to define the stress-strain relationship. There are three types of elastic modulus, determined by the type of stress and strain, represented in table2.1[34].
The relationship between shear and young’s moduli is defined below:
µ = E
8 Chapter 2. Literature review Elastic modulus Symbol Stress type Strain type
Young’s modulus E Longitudinal Longitudinal Shear modulus µ Transverse Transverse
Bulk modulus K Volumetric Volumetric
TABLE2.1: Different types of elastic modulus [34].
where ν is Poisson’s ratio. In MR Ealstography, displacement amplitudes are very small, so the stress-strain relationship can be considered linear, and if we assume that the tissue is isotropic the stress and strain are related as below [36]:
σij =2µϵij+λδijϵnn (2.4)
Where σijand ϵijare stress and strain tensors, respectively and λ is Lame’s
first constant (λ= Eν/(1+ν)(1−2ν)) and δij is a Kronecker delta. To obtain
the harmonic motion equation in an isotropic medium first we define ϵij, the
strain tensor in terms of displacement fields vector (ui,j =∂ui/∂xj) [36]:
ϵij = (ui,j+uj,i))/2 (2.5)
Then with substituting Eq2.4and Eq2.5into the equation of motion, we obtain the Navier’s equation:
∇.(µ(∇u+ ∇uT)) + ∇(λ∇ ·u) = −ρω2u (2.6)
Where ρ is the mass density and ω is the activation frequency. In MR Elastography, the measured displacement fields (u) within the scanner are used as an input to solve the Navier’s equation and obtain the complex Shear modulus (µ =µ+iµ), also referred to as shear stiffness. The real part of the
shear modulus represents the elasticity, also called the storage modulus, G’, and the imaginary part represents the viscosity and called the loss modulus, G”. The image reconstruction method to solve the Navier’s equation for fiMRE is explained in Ch3(section3.1.1).
2.2
Vasoreactivity
Vasoreactivity is the relationship of the brain and its vessels during acti-vation. Vasoreactivity has been described in many terms, but generally it consists of vasodilation and vasoconstriction and involves Cerebral Blood Flow (CBF) and Cerebral Blood Volume (CBV) changes. Several methods has been developed to measure the vasoreactivity either directly by assess-ing CBF/CBV, like Positron Emission Tomography (PET), or indirectly by stimulating the arterioles to dilate [67]. Blood flow regulation in the brain is comprised of Cerebral Autoregulation (CA) and NeuroVascular Coupling (NVC) mechanisms [57]. CA is the procedure to sustain a constant CBF by changing the blood pressure and the diameter of the arterioles. NVC is the relationship between the brain cells and vessels to adapt the blood flow to
face pial arterioles 21%, large cerebral arteries 39% and penetrating arterioles and capillaries 40%), which indicates their potential for blood flow control [24]. Scientists believe that blood flow regulation is initiated at the capillar-ies and arterioles and conducted to upstream artercapillar-ies. Figure2.5 represents NVC in capillary, arteriolar and pial artery levels. Capillaries are close to neurons and can detect neuronal activity and send signals to mural cells to relax, even though they are lacking in Smooth Muscle Cells (SMC) which are able to constrict or dilate and change the vessel diameter. These signals propagate upstream to arterioles and results in SMC relaxation. Dilation of pial arteries on the brain surface is believed to happen even though they are outside of the activation site, possibly caused by the spreading vasodilation conducted in downstream arterioles or by a local myogenic response. It must be noted that there are regional variations in vasodilation arising from differ-ent vascualar topologies, activation types and the location of vessels relative to the activation site that cause intrasubject and intersubjects variabilites[24].
FIGURE 2.5: Neurovascular coupling and vasodilation in dif-ferent cerebralvascular segments: 1. Capillaries, 2. Arterioles
10 Chapter 2. Literature review
2.2.1
The Role of Mechanical Properties in Vasoreactivity
All the aforementioned vasoreactivity mechanisms are involved with me-chanical changes in the vessels and tissue. Myogenic response, a vessel re-action to changes in pressure, is a shear stress based blood flow regulatory mechanism [57] and is influenced by the stresses and strains on the SMCs vessel tone. The increased shear stress on the vessel endothelium leads to re-laxation of the SMCs to normalize the wall shear stresses with dilation (2.5). During the SMCs relaxation, due to the high consumption of the oxygen, the deformability of red blood cells increases in the capillaries, resulting in the reduction of viscosity. In addition to those shear stress changes, there are constant pressure changes in the cerebral vessels and to maintain an equi-librium vessels respond to these changes by changing their diameter. Thus after a transmural pressure reduction the vessels respond with vasodilation and with vasoconstriction to the transmural pressure elevation.
Mechanical models are developed to describe and measure these viscoelas-tic changes. An example of which, represented by Parker et al. [27], shows that during cerebral activation, measurable changes in the brain stiffness is possible by considering the vasodynamic mechanisms. They introduced a microchannel flow model which defines the tissue stiffness as a function of vascular and fluid networks. Under three hypothetical conditions (in con-fined and unconcon-fined organs and changes in the elastic matrix) the model is tested for vasodilation within the tissue and the stress relaxation function is obtained. Figure2.6, shows the vessel relaxation response for the vasodila-tion in a tissue volume such as brain (a strictly confined volume by skull). According to this function, the viscoelastic properties decrease exponentialy with time. Schregel et al., [53] used MR Elastography while inducing va-sodilation via hypercapnic challenge in mice, and reported a brain stiffness reduction due to vasodilation, consistent with the stress relaxation response.
FIGURE2.6: Stress relaxation responce for a confined volume such as brain. [27]
Chapter 3
Methodology
3.1
Image Reconstruction
In this chapter, the image reconstruction methods to analyse the imaging modalities that are used in this study are explained. More details in method-ology and processing of each image modality can be found in chapter4, sec-tion4.4.
3.1.1
MR Elastography
The forward problemSolution of the Navier’s equation (Eq 2.6) for a 3D linear elastic medium provides the displacements (u) within the domain [62]. The forward solution of Eq2.6uses the Finite Element Method (FEM) [37] which requires a mesh to be generated for the entire domain. Equation2.6can be discretized using three dimensional FEM Lagrangian functions:
ˆ u= N
∑
j=1 ujϕj, ˆv= N∑
j=1 vjϕj andwˆ = N∑
j=1 wjϕj (3.1)Where the scalars uj, vj and wj are the displacements at the node j of N
nodes in the finite element mesh, such that ˆu, ˆv and ˆw are the approximate displacement solutions. The weighted residual weak formulation of Eq2.6
can be transformed into a algebraic form:
[A]{ˆu} = {b} (3.2)
Where the displacement vectors for a time harmonic motion are {ˆu} = {uˆ1, ˆv1, ˆw1, ..., ˆuN, ˆvN, ˆwN}. The details of matrix [A] subelements and the
right-hand term{b}are provided by Van houten et al. [37]. The Subzone based inverse problem
The forward problem has some limitations in treating the MR Elastography data. This method is highly sensitive to the image noise due to differentiation of the displacement fields, while complex shear and compression waves are present, all of which pose challenges to the direct inversion of the elasticity
12 Chapter 3. Methodology equations [62]. The inverse problem can overcome this challenge by comput-ing the iterative minimization of the least-square differences between the dis-placements measured in the scanner (um) and the displacements calculated
(uc) with the forward solution of Eq2.6 by using estimations of viscoelastic
properties (µ, λ ). With each iteration, the initial estimation of viscoelastic properties is updated to match the calculated displacement to the measured displacements. This optimization can be expressed as below:
(µ, λ) = arg min
µ,λ
1
2∥uc−um∥
2 (3.3)
Although the inversion method removes the problem of differentiating the displacement fields, solving this optimization for a highly resolved MR image via one global minimization is not computationally viable. The sub-zone non-linear inversion (NLI) algorithm, decomposes the image into small overlapping subregions and performs the least-squares approach for each subregion. If F(E) is the global sum of squared differences then by decom-position of the image into Q subzones we have :
min F(E) =min{ Q
∑
z=1 Fz(Ez)} = Q∑
z=1 min Fz(Ez) (3.4)The random selection of subzones is decided by considering the centroids of the elements whose properties have not yet been updated in the current global iteration. Figure3.1.b shows a selected subzone from a global finite el-emnt mesh shown in figure3.1.a. The subzone non-linear inversion method provides the ability to recover maps of viscoelastic properties in high resolu-tion MR images by breaking the costly single inverse problem into subzones problems. As the least-squares process scales cubically the number of param-eters to be resolved for optimization, thus subzone decomposition is a more efficient approach due to the reduction of the problem scale [60–62].
a b
FIGURE3.1: An ilustration of a global finite element mesh (a)
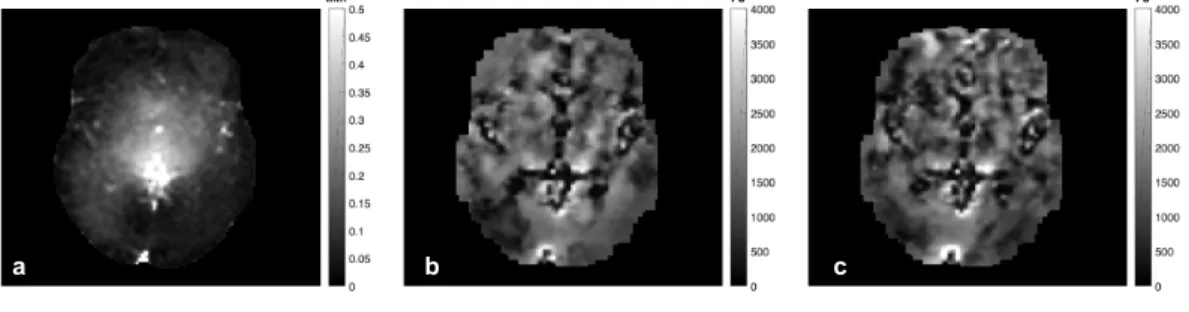
the image domain (shown in figure3.1.a). The mesh resolution was 2.5 mm isotropic and the zone size was 2 cm isotropic. 100 iterations were performed for a global optimization with the initial guesses of 1000 and 10000 Pa for shear storage modulus µ and λ modulus, respectively. Figure 3.2 shows the measured displacement amplitudes and the reconstructed shear storage modui for stimulation (ON) and non-stimulation (OFF) iMRE sequences for one subject. The brain structures such as ventricles that are visible in images b and c indicate that the reconstruction is capable of deducing structural in-formation from the measured displacement data.
a b c
FIGURE3.2: An example of the raw intrinsic MR Elastography(iMRE) images from
one subject. (a) Displacement amplitudes from one iMRE sequence, (b) shear storage modulus average for the 3 ON sequences (c) shear storage modulus average for the 3 OFF sequences. Lower shear modulus values can be seen in lower left hemisphere
in image (b) compared to (c).
Processing fiMRE regions of activation
The shear storage modulus or shear stiffness values change between stim-ulation (ON) and rest (OFF) states, i.e, shear stiffness is decreased during activation in the lower left hemisphere in figure 3.2.b in comparison to fig-ure3.2.c. To find the regions where shear stiffness changes or fiMRE regions of activation, the iMRE images were post-processed (see section4.4.3). Fig-ure 3.3 shows the method to isolated these regions, once the iMRE images were reconstructed by subzone NLI algorithm, the images are separated in ON and OFF groups to perform the Welch′st−test and collect p-values from measured means and variances. The p-values were then used to isolate the regions of activation, with areas greater than 15 contiguous voxels within a particular slice each having 1−p <0.05 considered to be active.
Figure3.4shows the application of this method to subject 1. Images a and b are the average shear stiffness values for ON and OFF sequences, respec-tively, shown in 19 slices. Image c shows the 1−p measurements where some regions with significant p-values (p <0.05 ) can be seen. These regions then were processed as explained above to obtain the activation regions shown in figure3.4.d.
14 Chapter 3. Methodology
ON OFF ON OFF
Area >15 contiguous voxels with p-value <0.05 (2.5 mm isotropic) ON OFF Subzone NLI algorithm
Mechanical
Properties (x6)
Welch’s t-test Mean & Variance P-value
Isolating regions of activation based on p-value Selection criteria within each slice
ONONON & OFFOFF OFF
Raw iMRE
Reconstructed iMRE
FIGURE3.3: The method to process and isolate fiMRE regions of activation.
Shear stiffness (1 – P-Value) Shear stiffness Processed P-Value (p<0.05) Shear stiffness Mean OFF Pa
Pa
Shear stiffness Mean ON
a b
c d
activity using the transformation of diamagnetic oxyhemoglobin into para-magnetic deoxyhemoglobin due to brain activation which leads to decreased signal intensity in MRI [47]. BOLD fMRI does not measure the neuronal ac-tivity directly, but due to neurovascular coupling it is able to measure the increase in cerebral blood flow and venous blood oxygenation levels in re-sponse to neuronal activation [30, 48]. The hemodynamic response function [1] measured by BOLD is correlated with the stimulus block design to gener-ate the maps of brain function. Figure3.5schematically represents the stim-ulus block design ( for this study: overall 300 seconds imaging time with 30 seconds ON and OFF stimulation periods) and the corresponding hemody-namic response. 30 s Stimulus block design Hemodynamic response
FIGURE 3.5: Schematic of BOLD fMRI stimulus block design
and the hemodynamic response.
The raw BOLD fMRI data was first skull-stripped and motion corrected using thebet and mcflirtcommands in FSL [26], respectively, then corre-lated with the redesigned block patterns and thresholded by a 0.28 correla-tion coefficient value to ensure obtaining the visual cortex activity patterns at fine detail. Figure 3.6 shows the generated BOLD patterns (red) in the activated visual cortex for subject 4, overlaid on the T1anatomical image.
3.1.3
Time of Flight
Vessel extraction methodToF-MRA provides high resolution images of the arteries by measuring the hydrogen proton movement in the blood vessels. This is done by generating a contrast between the stationary tissue and the flowing blood signals by applying rapid RF pulses, which saturate the imaging plane and suppress the stationary tissue signal while the moving blood retains its signal [45]. To quantify and extract the cerebral arteries imaged by ToF, the multi-scale
16 Chapter 3. Methodology
FIGURE3.6: BOLD fMRI activation patterns for one subject in axial (left) and sagittal (right) views
Frangi diffusive filter (MSFDF), a vessel segmentation algorithm developed by Bernier et al.,[4] is used. Figure 3.7 shows the essential steps to extract vessels and eventually measure vessel diameters and centerlines. The raw ToF data is first denoised (i) and then the image intensities are thresholded to classify the vessel voxels binarily and provide a collection of candidate voxels who are associated with the vasculature (ii). The image is then smoothed by different Frangi scores so only the voxels with tubular geometry remain, allowing the selection of vessels with a variety of sizes. To further smooth the image, a Vessel Enhancement Diffusion (VED) filter is applied iteratively on the scaled images (iii). The image intensities are then normalized and thresholded (by 50% ) to create the arterial maps of the brain (iv). A thinning algorithm is applied on the image to generate the centerlines of the vessels (v) while the ridge distance in the vasculature structure is measured (vi) and masked with the centerline image to obtain the vessel diameters (vii).
FIGURE3.7: The vessel extraction steps used to isolate the
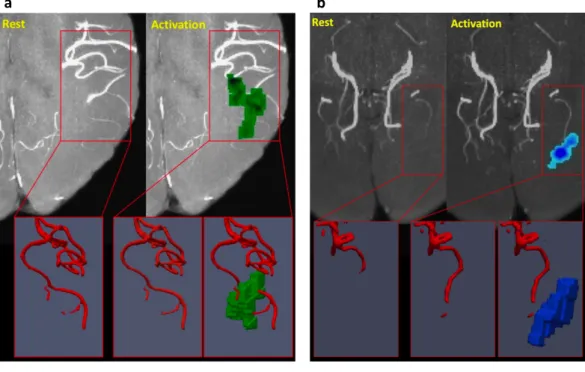
to measure quantitatively the vasodilation and vasoconstriction and also in comparison with the fiMRE activation regions across the subjects to inves-tigate the relation of the fiMRE activity patterns with associated arterial di-ameter changes and finally to understand the origins of viscoelastic changes. Figures3.8and 3.9show the raw and VED filtered ToF images in grey scale and red contours, respectively, and fiMRE activation regions in green and blue. In figure3.8.a, for subject 4, an increased µ activity region in green can be seen close to the apex of the Middle Cerebral Artery (MCA) while no sig-nificant dilation of the artery is evident by comparing the rest and activation states. In3.8.b, for subject 1, a decreased µ activity region in blue is seen close the significantly dilated P4 segment of the Posterior Cerebral Artery (PCA).
Figure3.9shows the MCA and the PCA in VED filtered ToF images and two fiMRE activation regions (in blue and green, representing the decrease and increase of µ, respectively) that did not appear to be related to the arteries.
a b
FIGURE3.8: Sample fiMRE activation regions compared to ToF images for subject 4(a) and 1(b). a) The red frame shows the apex of the Middle Cerebral Artery (MCA) at rest and activa-tion and an adjacent fiMRE activaactiva-tion region with increased
µ, shown in green. The 3D images below highlight the
acti-vation region and the adjacent MCA with little or no visible dilation. b) The red frame shows the apex of the Posterior Cere-bral Artery (PCA) at rest and activation and an adjacent fiMRE activation region with decreased µ, shown in blue. The 3D images below highlight the activation region and the adjacent
18 Chapter 3. Methodology
FIGURE 3.9: Two examples of fiMRE activation regions with
no closely adjacent arteries ((blue =decreased stiffness); green = increased stiffness)). The PCA and MCA are shown for scale
and orientation.
To find the relationship between the fiMRE activation regions and the ar-terial vasodilation and vasoconstriction, the correlation between the vessel diameter and the stiffness changes in the neighbouring voxels in different distances were measured (see Ch. 4, Sec4.4.6). The centerline ON (stimula-tion) and OFF (rest) images were used for the diameter change measurement at each voxel. As the measurement is at the voxel level, it is very important to find the corresponding voxels in ON and OFF centerline images. To en-sure the best registration, the OFF centerline images were registered to the ON centerline images for each subject using the non linear SyNQuick regis-tration tool in ANTS. An example of such regisregis-tration is shown in figure3.10
where a segment of PCA in ON and OFF images represented in the right. As can be seen, even by a non linear registration, some corresponding vox-els, like those encircled, do not fall at exactly same location in both images. Therefore, to find the best ON and OFF voxel match, for each voxel in the OFF centerline image a local 7×7×7 window containing the voxel at the center was correlated (only correlations above 35% were considered) to the same size window in the ON image. This procedure significantly limited the false positive vasodilation and vasoconstriction measurements.
Once the diameter change measurements were collected and stiffness fac-tors (SF) were measured from the fiMRE ON and OFF images, each SF voxel was associated to a diameter change measurement as a function of the per-pendicular distance to the artery, and grouped in different radial band dis-tances to the artery which is schematically shown in figure3.11. These dis-tance increments were in 1mm steps (a−b) and had a thickness of 1mm(c). However, the radial bands were not in an exact circular shape, because each voxel whose centroid was found to be within the circle band was considered
to group the SF voxels.
20 Chapter 3. Methodology
Vessel
a
b
c
FIGURE3.11: A schematic of a method to measure fiMRE vox-els distance to the vessvox-els.
voxel . . . . . . . . . . . . . . . . . . . . . . . . . . . . . . . . . . . . . . . . . . . .
a
b
FIGURE 3.12: A schematic of a distance increment of fiMRE voxels to the vessel.
to compare the BOLD fMRI, ToF and fiMRE images together and as well as with standard anatomical MNI brain[12] and vascular[4] atlases. AFNI [8, 9,15], FSL [26, 68] and ANTS [3] were the main tools used for this purpose. For each subject the skull was removed from raw images of each modality usingbet in FSL to avoid further distortions in the registration. The skull-stripped original images were registered to T1 weighted anatomical images
of each subject while the T1images were registered to the MNI atlas and the
two transformation matrices were created.
The iMRE images were non linearly registered to T1usingflirtin FSL:
flirt -in mre.nii -ref T1.nii -dof 6 -searchrx -180 180 -searchry -180 180 -searchrz -180 180 -out mre-in-t1.nii -omat mre-to-t1.m
The reconstructed viscoelastic properties such as shear modulus then were registered in T1space by using the transformation matrix mre-to-t1.m:
flirt -in reconstructed-mre.nii -ref T1.nii -applyxfm -init mre-to-t1.m -out reconstructed-mre-in-t1.nii
ToF images were registered non-linearly to T1 space by SyNQuick
regis-tration in ANTS:
antsRegistrationSyNQuick.sh -d 3 -f T1.nii -m ToF.nii -o ToF-in-T1-n 8
Thus the vessel extracted images alongside the diameters and centerline images were transformed to T1as well:
antsApplyTransforms -d 3 -i centerline.nii -r T1.nii -e 0 -t ToF-in-T11Warp.nii -t ToF-in-T10GenericAffine.mat -o ToF-centerline-in-T1.nii -v 1
In the same manner, T1 anatomical images were non-linearly registered
to MNI space, and with the obtained transformation matrix, all the images registered in T1then could be transformed to the MNI space using the T1 −→
MNI transformation matrix.
BOLD fMRI is a large, 4 dimensional image, thus the registration of the whole image would be computationally costly. Therefore the registration is performed only for one spatial component of the image isolated by3dTcat
and registered to T1 byepi regin FSL. The transformation matrix then can
be used byflirtto register the correlation maps into the T1image.
To better understand the origins of the fiMRE activation regions, brain tissue segmentations were performed on the T1anatomical image usingfast
FSL segmentation tool to extract grey matter, white matter and cerebrospinal fluid (CSF). Figure3.13shows these segmentations for subject 1.
22 Chapter 3. Methodology
Grey matter White matter CSF
FIGURE3.13: Brain tissue segmentation.
3.3
Volumetric reprojection
The volumetric reprojection method was developed (see Ch4, section 4.4.5) to permit intersubject comparisons of 3D fiMRE activation regions in loca-tions where individual cerebrovascular geometries do not overlap, even after non-linear image coregistration to a common atlas such as MNI. The method is explained with the following example. Consider three 3D regions those shown in3.14(taken from actual data from three subjects in this study). The regions are in close proximity to each other, but they do not overlap. Comb-ing these three regions by simple volumetric averagComb-ing would give a maxi-mum value of 13, which, after any reasonable thresholding, would give a null result. To over come this, and develop an image of the 3D envelope contain-ing these three adjacent regions, the volumetric reprojection is performed. First three 2D projections of the regions are created within each of the three main coordinate planes, Y−Z, X−Z and X−V, (Figure3.15, steps 1 to 3). Next, each of these 2D images is reprojected along the axis perpendicular to the plane to create column-like volumes (Figure3.15, steps 4 to 6). In step 7, (Figure3.15step 7), all three column-like image volumes are summed to-gether and thresholded (Figure3.15, step 8). The final region is a 3D envelope of the primary regions and allows the shape and location of these regions to be viewed as a whole.
Morphological dilation of the regions of activation is another option to overcome the intersubject variabilities, however the output of this technique is not as promising as the reprojection method. Figure3.16 shows another reprojection example that estimates the location probability of two neigh-bouring yellow objects in image 1. Two projections of these objects, shown in images 2 and 3, were summed to create the probability of two objects rep-resented in image 4. The black dashed lines show the boundaries of prob-ability more than 50%, thus image 4 was thresholded to isolate the region which is shown in image 5. On the other hand, in figure3.17 the same ob-jects in image3.16.1 were dilated by the order of three and square structure
FIGURE3.14: 3D regions taken from actual data from three subjects in this study Y-Z X-Z X-Y 1 2 3 4 5 6 7 8
FIGURE3.15: Volumetric reprojection method
and the overlapping zones with the probability of more than 50% differen-tiated by black dashed lines and isolated in image 2. Comparing the out-comes of two methods (images3.16.5 and3.17.2) to the original shape of the objects (image3.16.1), it can be seen that the reprojection method produces a more efficient and realistic estimation of objects probability by preserving the envelope while dilation of the objects resulted in an small and non-realistic probability region.
24 Chapter 3. Methodology 2 3 2+3 4 5 1
FIGURE3.16: Schematic of reprojection method
1 2
all seven subjects after co-registration with the MNI atlas. Figures3.18.a and
3.18.b show the axial reprojection probabilities,Πax, for all negative (SF <1, or decreased µ, on left) and positive (SF>1, or increased µ, on right) regions (please note that the anatomic brain image shown behind the projections is simply a representative MNI slice and these projection are not necessarily located on that slice). The colorbar represents the probability of an activation region occurring in that location in all subjects, within a segment of Nseg=5 slices (slice thickness is 1mm in MNI space). We can see in Figure3.18.a that there is an 80% probability of activation in those areas in yellow, indicating a center of activation within the primary visual cortex (V1). We can see in Figure3.18.b that, for positive regions, there is a 70% probability of activation in lateral occipital areas of the brain, in close proximity to the MT/V5 area of the visual cortex.
a b
FIGURE 3.18: Axial projection of fiMRE activation regions. Image (a) shows the negative region (SF < 1 or decreased µ) probability within 5 slices. Yellow areas indicate a decreased stiffness within a 5 slice band for more that 80% of the subjects. Image (b) shows the positive region (SF > 1 or increased µ) probability within 5 slices. Yellow areas indicate an increased stiffness within a 5 slice band for more than 70% of the subjects. The images are overlaid with a representative slice of the MNI anatomy atlas, although is important to note that axial projections are calculated from the full volume of the iMRE reconstruction, and thus do not correspond to a
specific anatomical slice.
Figure 3.19 shows the cerebrovascular atlas developed by Bernier et al., [4] and the thresholded volumetric reprojection of the negative (SF <1) and positive (SF > 1) activation regions in blue and green, respectively, from
26 Chapter 3. Methodology different views. The PCA is only partially visible in the atlas, and certain segments, such as the P4, are absent due to the high inter-subject variability
of arterial architecture. a b c d iMRE (+) iMRE (-) ToF
FIGURE 3.19: A cerebrovascular atlas shown with the volumetric reprojection of fiMRE activity regions from all subjects in axial (a), isometric (b), sagittal (c) and (d) coronal views. The proximal segments of the MCA and PCA can be seen near the center of the atlas. Negative activity regions (SF < 1) can be seen (in blue) following the P4 segment of the PCA, which is not included completely in the atlas.
Chapter 4
Article
Characterizing the differential
physiological mechanisms underlying
cerebral stiffness changes during visual
stimulation
Authors: a Reihaneh Forouhandehpour, b Michaël Bernier, c Guillaume Gilbert,dRussell Butler,a Kevin Whittingstall,eElijah Van Houten.
affiliations:
a Department of Nuclear Medicine and Radiobiology, University of
Sherbrooke, 3001, 12e avenue Nord Sherbrooke,QC, Canada, J1H 5N4.
b Martinos Center - MGH - Harvard Medical School, 149 Thirteenth
Street, Charlestown, MA, USA, 02129.
c MR Clinical Science, Philips Healthcare Canada, 281 Hillmount Rd,
Markham, Ontario, Canada, L6C 2S3.
d Computer Science Department, Faculty of Arts and Science, Bishop’s
University, 2600 College St, Sherbrooke, QC, Canada, J1M 1Z7.
e Department of Mechanical Engineering, University of Sherbrooke,
Sherbrooke, 2500, boul. de l’Université Sherbrooke, QC, Canada, J1K 2R1. Status of the article: submitted to the Journal of Cerebral Blood Flow and Metabolism (JCBFM).
Foreword
The following article, presents the development of a novel method to perform functional intrinsic MR Elastography on healthy human brain and eventually combine it with ToF and BOLD fMRI data. Despite pre-vious research in extrinsic activation brain MRE, intrinsic MRE has not bean fully developed for applications in brain imaging. However, this method provides an interesting advantage compared to extrinsic MRE in that it makes the maps of shear stiffness changes due to intrinsic brain function during visual stimulation. Two types of activation mechanisms
28 Chapter 4. Article were identified and differentiated in the primary visual cortex and Mid-dle Temporal areas. I am the person who carried out this research and wrote this article. The image acquisitions were performed with the help of Guillaume Gilbert. The image reconstructions and image processing were developed with the help of Elijah Van Houten, Michaël Bernier and Russell Butler. Elijah Van Houten is the source of funding and also the scientific source as well as Kevin Whittingstall, who assisted in the writing of this article.
4.1
Résumé
Nous avons effectué une élastographie intrinsèque par résonance magné-tique fonctionnelle (fiMRE) ainsi qu’une angiographie par temps de vol et une BOLD fMRI sur 7 sujets humains en bonne santé pour suivre l’évolution de la rigidité en cisaillement et la dilatation artérielle pen-dant des périodes de stimulation visuelle prolongées. On a observé que l’activation FiMRE avec une rigidité accrue se produisait de manière presque égale dans la matière blanche et grise du cerveau (49.7% et 40.9%, respectivement), tandis que l’activation avec une rigidité réduite était sig-nificativement (p = 0.018) plus susceptible de se produire dans la matière blanche que la matière grise (50.8% et 37.0%, respectivement). Aux faibles fréquences d’activation mécanique et de conception de blocs utilisées dans cette approche iMRE, le changement de rigidité agrégé dans toute la ré-gion d’activation BOLD n’était pas significatif. Cependant, nous avons observé une réduction significative de la rigidité au cisaillement dans les zones adjacentes à l’artère cérébrale postérieure (ACP), où la vasodilata-tion est évidente, dans la région V1 ainsi qu’une augmentavasodilata-tion significa-tive de la rigidité au cisaillement dans les zones adjacentes à la région temporale moyenne (MT) ou V5 du cortex visuel. Ces résultats montrent que l’iMRE peut mesurer les réactions cérébro-mécaniques intrinsèques dues à la stimulation visuelle ainsi que la réponse physiologique différen-tielle détectée dans des régions distinctes du cortex visuel.
4.2
abstract
We performed functional intrinsic Magnetic Resonance Elastography (fiMRE) as well as Time of Flight angiography and BOLD fMRI on 7 healthy hu-man subjects to monitor shear stiffness and arterial dilation during periods of prolonged visual stimulation. FiMRE activation with increased stiffness was observed to occur almost equally within brain white and gray matter (49.7% and 40.9%, respectively), while activation with decreased stiffness was significantly (p = 0.018) more likely to occur in white matter than gray matter (50.8% and 37.0%, respectively). At the low mechanical acti-vation and block design frequencies used in this iMRE approach, the ag-gregate stiffness change across the entire BOLD activation region was not significant. However, we observed significant reduction in shear stiffness
the visual cortex. These results show that iMRE can measure intrinsic cerebro-mechanical reactions due to visual stimulation as well as the dif-ferential physiological response detected in distinct regions of the visual cortex.
4.3
Introduction
MR Elastography(MRE) is now well established as a method to measure the mechanical properties in the in vivo brain [22, 39]. By characterizing the elastic response via MR measured deformation fields, MRE provides images of the mechanical properties of soft tissue, such as stiffness, at the resolution of the MR imaging data. Recently, intrinsic MRE (iMRE) meth-ods based on cardiac pressure pulse induced displacement fields have been developed to image viscoelastic properties at frequencies around 1Hz [6, 65]. Gordon Wylie et al., [16] used quantitative flow (QFLOW) MR imaging in a gelatin phantom with a hydraulic actuation system to imitate the 1Hz cardiac cycle and verified the iMRE viscoelastic recon-struction [60, 65]. One challenge of iMRE in in vivo applications is inter-preting the observed viscoelastic signal. While traditional extrinsic MRE (eMRE) depends on the elastic response to peripheral, passively induced displacements at non-physiologic frequencies, iMRE depends on internal, actively generated displacements via the cardiac pressure pulse (i.e. at physiologic frequencies). In this way, there are more possible origins for the viscoelastic properties measured by iMRE than the latent structural response measured in eMRE.
One way to investigate the origins of the elastic response observed in MRE is through the use of a functional imaging approach. This approach has recently been introduced based on extrinsic MRE (eMRE) methods to investigate neuromechanical as a possible source for measured stiffness changes. In a recent study using functional eMRE (feMRE) with a shear wave frequency of 1KHz, brain biomechanics were quantified using fast time scale imaging to capture neuronal activity [50]. An overall 10% de-crease in stiffness during electrical hind limb stimulation was observed, with stiffness patterns dependent on the cyclic ON/OFF block design in-terval, which varied from 9s to 0.1s. In another study using simultaneous BOLD fMRI and feMRE, 6−12% stiffness increases within the visual cor-tex were observed with a shear wave frequency of 60Hz and block design visual stimulation intervals of 18s to 36s [31]. Multifrequency feMRE ex-periments by Fehlner et al. at extrinsically induced shear wave frequencies ranging from 25Hz to 50Hz, showed a 2.5% decrease in average whole-brain viscoelastic stiffness [11, 18].
For iMRE of the in vivo brain, another possible source for the measured viscoelastic signal is cerebrovascular activity. Cerebral vasoreactivity is a mechanism that involves changes in cerebral blood volume(CBV), cerebral
30 Chapter 4. Article blood flow(CBF), cerebral perfusion pressure and cerebral metabolism to maintain blood regulation [67]. The mechanics behind these factors engage various compartments in the cortex and has been of interest to researchers for some time [14, 27, 58]. Nevertheless, to date, no imaging method has been developed to measure the differential physiological mechanisms of cerebral vasoreactivity directly. Vasodilation and vasoconstriction, the two main elements of vasoreactivity, are driven by pressure changes in the arterial and capillary bed and smooth muscle cell (SMC) contraction and relaxation within the vessel wall [24, 35]. Parker et al. have translated these effects into a stress relaxation function and described the stress changes during vasodilation and vasoconstriction as two attenuating ex-ponential signals [27]. Likewise, experimentally induced vasodilation in mice via hypercapnic challenge has been shown to decrease brain rigidity as measured by eMRE [53].
Here, we introduce a novel, non-invasive method for functional iMRE (fiMRE) to characterize the mechanical changes in the brain due to visual stimulation at a low block design frequency. The roughly 1Hz displace-ments originating from the cardiac pressure pulse and the prolonged block design intervals (300s) used in this technique enable us to investigate the different quasi-static mechanisms that underlie visual cortex activation.
Significance Statement
Different regions of the visual cortex undergo distinct responses to visual stimulation. These responses engage dissimilar reactions from the surrounding cerebrovascular network. This differential cere-brovascular reactivity relies on separate mechanobiological mech-anisms that lead to changes in the local cerebral stiffness. By using the intrinsic cerebral motions caused by the cardiac pressure pulse as well as advanced MR Elastography imaging methods, we character-ized these differential physiological mechanisms underlying cerebral stiffness changes during visual stimulation. We found significant reductions in cerebral stiffness around the V1 region, where va-sodilation was evident, as well as significant increases in cerebral stiffness around the V5 region. We also observed inverse relation-ships between stiffness changes and vasodilation within these two regions.
4.4
Materials and Methods
4.4.1
Image acquisition
This study was performed using seven healthy subjects, 5 male and 2 female, aged 24-32 years old. The following imaging protocol was used for each subject: a T1 anatomic image (voxel size = 0.7986×0.7986×0.8000
cycles(=30mins)) cardiac-gated 4D-QFLOW images with 8 motion phases [16] (2.8 mm isotropic voxels, FoV = 200×200×48 mm); 2 (ON/OFF vi-sual stimulation) Time of Flight (ToF) angiography images (voxel size = 0.625×0.625×0.650 mm3,FoV = 200×200×144.3 mm. Visual stimulation was an 8Hz full field flickering checker board pattern generated with the Psychophysics Toolbox 1 for Matlab 2. The fiMRE experimental design corresponded to a block design interval of 300 seconds. All images were acquired on a 3T Philips Ingenia 3. All participants provided informed written consent and received a complete explanation of the research pro-cedure. The research ethics committee of the CIUSSS de l’Estrie – CHUS, the CÉR (REBA), has examined and approved the consent form and the research protocol (#2016−1341−DospIRM) in compliance with American standards (FWA #00005894 and IRB #00003849).
4.4.2
Intrinsic MR Elastography reconstruction
The 6 iMRE displacement fields were reconstructed using the subzone based Non Linear Inversion (NLI) algorithm [21, 60, 65]. NLI MRE is based on Navier’s equation for time-harmonic motion, Eq. 4.1, relating the viscoelastic forces governed by the complex shear modulus, (µ=µR+
iµI) and the λ modulus to the inertial forces at the activation frequency,
(ω≈1Hz, for cardiac gated motion), governed by the mass density (ρ =
1000mkg3 for water saturated biological tissue). For this study, NLI MRE estimates of the shear modulus distribution were reconstructed using 1.5 mm isotropic voxels and the same imaging volume as the iMRE data (FoV = 200x200x48 mm) [41].
∇ ·µ
(
∇u+ ∇uT)+ ∇λ∇ ·u = −ρω2u (4.1)
4.4.3
Functional Elastography processing
After NLI MRE reconstruction, the six measured storage modulus distri-butions, µR(x) = G′(x), were separated by visual stimulation state (i.e.
µONR (x) or µOFFR (x)) and processed using the Welch’s t-test [66]. At each
voxel within the imaging volume, the mean and variance were estimated within each group (ON or OFF) and a p-value was calculated for the hy-pothesis of equal means across the two stimulation states. To identify the activation regions for fiMRE, a post-processing step within each slice was performed to identify regions with 15 or more contiguous voxels each meeting the condition 1− (p−value) <0.05. A Stiffness Factor (SF) was calculated for each activation region, SF=mean(
µONR (x)) /mean (µOFFR (x))
1http://psychtoolbox.org/ 2https://www.mathworks.com/ 3https://www.philips.com/global
32 Chapter 4. Article to indicate the level and nature of shear modulus changes within the ac-tivated region. Contrast to noise ratio (CNR) values were also calculated within each activation region:
CNR=(mean(µONR (x)
)
−mean(µOFFR (x)
))
/σON,OFF (4.2)
Activation regions with a positive CNR, equivalent to SF > 1, are identified as positive activation regions, while those with a negative CNR, equivalent to SF<1, are identified as negative activation regions. The distri-bution of these regions between white matter, gray matter and CSF were calculated based on the FAST segmentation tool in the FMRIB Software Library (FSL) [68]. P-values are given for the test of different distribu-tions of positive and negative activation regions between white matter and gray matter. The distribution of activation regions directly within vessel volumes can not be calculated due to partial volume effects in the 4D-QFLOW data used for iMRE reconstruction.
4.4.4
ToF processing
ToF images were reconstructed in the same manner as Bernier et al, [4] to measure arterial diameter with and without visual stimulation. An example of ToF reconstructions and their associated activation region are shown in Figure 4.3.
4.4.5
Axial and volumetric reprojection
The fiMRE activation regions are relatively small compared to the BOLD fMRI activation maps. In addition, many of the regions of fiMRE ac-tivity are associated with changes observed in the neighboring arteries, with the exact geometry of the cerebrovascular tree varying significantly between individuals[10]. These factors make comparing fiMRE regions across subjects very difficult, as simple registration to standard atlases (such as the MNI atlas [7, 12, 13]) does not ensure that cerebral arteries (or their neighboring regions) will overlay across different subjects. This leads to the co-registered fiMRE activation regions lying close together but not necessarily overlapping in the atlas space. For example, calculating the average number of activations per voxel in atlas space would give a result of roughly Nsubj1 for Nsubj subjects, as no two activation regions actually overlap, despite being close.
To better represent the location of the positive and negative activation regions across multiple subjects, we developed two methods of combin-ing co-registered activation region maps based on projection methods. In the first of these methods, axial reprojection, activation region maps across multiple subjects (co-registered in MNI space) are combined in the axial direction to give the probability of a particular axial slice segment (de-fined by the number of slices per segment, Nseg) containing a region of
![Figure 3.19 shows the cerebrovascular atlas developed by Bernier et al., [ 4 ] and the thresholded volumetric reprojection of the negative (SF < 1) and positive (SF > 1) activation regions in blue and green, respectively, from](https://thumb-eu.123doks.com/thumbv2/123doknet/2849937.70480/43.892.139.729.495.838/cerebrovascular-developed-thresholded-volumetric-reprojection-negative-activation-respectively.webp)