1
Influence of Hooding Conditions on Gas Composition at Duct End of
an Electrolysis Cell
Lukas Dion1, László I. Kiss2, Sándor Poncsák3 and Charles-Luc Lagacé4 1. PhD Candidate in Engineering,
REGAL, Université du Québec à Chicoutimi, Chicoutimi, Québec, Canada
2. Professor in Applied Sciences and Director of the GRIPS (Groupe de recherche en ingénierie des procédés et système),
3. Research Professor,
GRIPS, Université du Québec à Chicoutimi, Chicoutimi, Québec, Canada 4. Advisor in continuous improvements
Aluminerie Alouette Inc., Sept-Îles, Québec, Canada Corresponding author: lukas.dion@uqac.ca Abstract
Aluminum smelters are known to be important producers of perfluorocarbons (PFC). These gases are generated when the localized overvoltage in the cell exceeds the threshold necessary to electrolyze the cryolite, hence generating an anode effect. When it remains localized, this event is difficult to identify and it can generate only a small amount of PFC for several hours. Under these conditions, the cell behavior is almost undisturbed and no action is initiated from the cell control system to correct the situation. To understand this phenomenon, it is common to extract the gas from the duct end of specific cells - where dilution is minimal - and measure the gas composition continuously using a Fourier-transformed infrared spectrometer (FTIR). However, air infiltration can affect the measured PFC concentration, and the gas flow rate in the duct of the cell. In this study, a tracer gas was injected into the cell under multiple scenarios to assess the impact of the hooding conditions on the flow rate and concentration of the measured gases. This investigation quantified the uncertainty associated with the measurements of the gas composition for six specific scenarios compared to optimal hooding conditions.
Keywords: Aluminum electrolysis; perfluorocarbon emissions; low voltage anode effect; hooding condition; FTIR measurements.
1. Introduction
During primary aluminum production, massive emissions of gas are produced as the result of numerous chemical reactions occurring in the reduction cells. For technologies using carbon anodes, carbon dioxide (CO2) is the primary component of these emissions. Nonetheless, other
gases can be present in the output flow depending on the electrolysis conditions. Some of these secondary gases include carbon monoxide (CO), sulfur dioxide (SO2), hydrogen fluoride
(HF),bath vapors (NaAlF4, Na +
) and perfluorocarbons (CF4, C2F6)
As most of the chemical reactions occurring during the production of these gases are well known [1], identifying the output composition of an electrolysis cell can offer relevant and instantaneous information about the cell behavior (current efficiency, net carbon consumption, etc.). For this reason, some studies [2-7] investigated the evolution of the gas composition directly at the duct end of an electrolysis cell. This methodology has become particularly relevant in recent years along with studies investigating the occurrence of low voltage anode effects (LVAE). LVAE are also known as non-AE emissions or background PFCs. These emissions of CF4 and C2F6 occurs under conditions that are not completely understood, hence
the multiple and recent studies on the subject. Analysis of the gas collected directly at the duct end of the electrolysis cell limits the dilution of the gas stream to a single cell, allowing the
2
detection of the gas precisely when the concentration of the studied component exceeds the noise level of the measuring instrument.
This paper investigates if gas samples collected at the duct end represent well enough the ensemble of gas mixture emitted by the electrolysis cells. Using a tracer gas, the effects of the hooding conditions and the position of the gas collection within the cell are investigated in order to understand the limitation of this methodology.
2. Experimental setup
2.1. Cell and equipment specifications
Experiments were performed under industrial conditions on a prebaked AP40LE reduction cell, using point-feeders at Aluminerie Alouette Inc. The cell was operating above 390 kA for the entire duration of the test. A stainless steel sampling probe was inserted at the duct end of this specific cell to sample the gas flow and route it to a Fourier-Transformed Infrared Spectrometer for analysis of the gas composition. The FTIR used was a GASMET™ DX-4000, equipped with a Peltier cooled mercury-cadmium-telluride detector (sample cell path: 9.8m, volume: 0.5L, resolution: 7.8 cm-1). The gas was continuously directed towards the analyzer at a volumetric rate of 2 liters per minutes (LPM). The gas stream was sent sequentially through a 15-micron filter, desiccant, activated alumina, a 5-micron filter and finally a 2-micron filter to remove dust, traces of water and hydrogen fluoride for the protection of the measuring equipment. The gas was preheated at 120°C before entering the FTIR and concentration measurements were performed at a rate of 10 scans per second. Average values for five-second periods were recorded. The background spectrum was redefined once a day before the tests using high purity nitrogen.
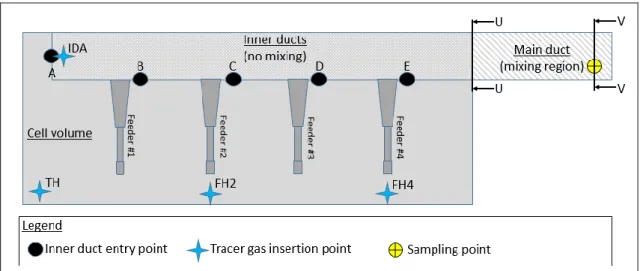
Gas collection within the cell is designed to be volumetrically uniform between five different inner ducts within the cell superstructure (listed A to E on Figure 1). None of these gas streams is mixed until they reach the main duct at the extremity of the cell. From this point, there are approximately three feet of conduct before the stainless steel sampling probe. Due to restriction from the surroundings, this is the only sampling point available to collect gas from a single electrolysis cell.
Figure 1. Schema of gas collection within the test
3
One of the main objectives of this paper is to determine if the location of the gas generation site has an impact on the concentration measurements. Henceforth, four different locations were selected to inject the tracer gas. Point 1 was selected as a reference directly inside the duct to minimize the dispersion of the gas within the inner volume of the cell as well as the changes that could be attributed to airflows going into different directions within the cell volume. The three other points were selected at different intervals from the duct end of the cell considering that under ideal conditions, the gas produced by the cells usually escapes either by the tapping hole or by one of the feeder holes:
1. Directly inside the gas inner duct A (see Figure 1). (IDA) 2. Directly above the tapping hole. (TH)
3. Directly above feeder hole #2. (FH2) 4. Directly above feeder hole #4. (FH4)
A procedure was established during the experiments to avoid perturbations of the hooding conditions in the area next to the insertion of the tracer gas.
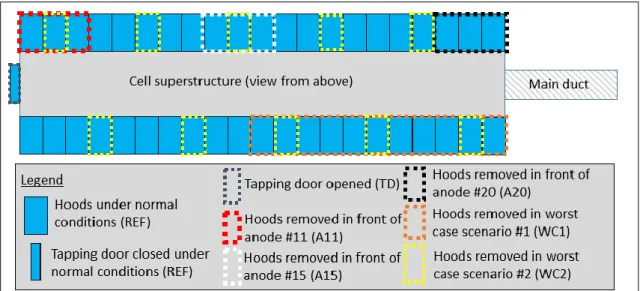
For each position, different hooding conditions were examined to evaluate their impact on the measured concentration of gas. Seven different scenarios were selected for this study. The scenario of reference (REF) represents ideal hooding conditions where all hoods are correctly positioned to ensure optimal sealing. Part of the other scenarios are based on two of the most frequent operation on an electrolysis cell, namely metal tapping and anode change. When metal tapping is performed, the door located on the side opposite to the duct end is opened to allow access to the liquid aluminum via the tapping hole (TD). For an anode change, part of the hooding (about 8%) is removed to allow access to the anode that needs to be replaced. Because we studied the effect of the position of tracer injection in this study, we investigated three different positions where the anode change could occur; anode #11 on the tapping end (A11), anode #15 near the middle of the cell (A15) and anode #20 at the duct end of the pot (A20). Finally, two worst case scenarios were also investigated, representing a very unlikely event when 25% of the hooding was removed from the cell. In one case (WC1), all hoods, on the half of one side of the cells were removed, leaving a significant opening next to the duct end. In the other case (WC2), one-quarter of the hoods was removed uniformly across the cell. Figure 2 illustrates these different scenarios.
1. Perfect hooding conditions (REF) 2. Tapping door open (TD)
3. Anode change conditions at anode #11 (A11) 4. Anode change conditions at anode #15 (A15) 5. Anode change conditions at anode #20 (A20)
6. Worst case scenario #1, 25% open next to each other (WC1) 7. Worst case scenario #2, 25% open uniformly (WC2)
4
Figure 2. Top view of the cell showing all seven scenarios investigated.
2.3. Tracer gas
Tetrafluoromethane (CF4) was chosen as tracer for this study because it is the primary gas of
interest related to LVAE. Another type of gas (for example sulfur hexafluoride) could have influenced the results differently due to the density of the gas, which is significantly different, i.e. 3.72 kg/m3 and 6.17 kg/m3 respectively.
A tank of CF4 was obtained with a certified concentration of 1000 ppm diluted in nitrogen. A
fixed quantity (8 liters) of gas was injected into the cell (Figure 3) using two latex balloons placed at a specific position within the cell according to the methodology presented previously. Each balloon was filled individually directly from the reference tank with a flow rate of 4 LPM (measured with rotameter) during 1 minute.
5
Figure 3. Injection of the tracer gas during test #A11-TH
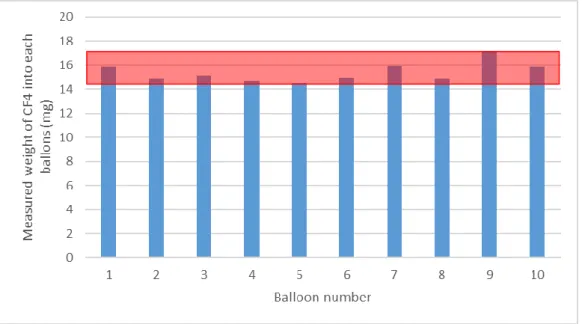
To evaluate the repeatability of the balloon volumes, ten balloons were filled up using the same procedures. Then their content was sent through the FTIR with a specific flow rate of 2 LPM to allow calculation of the mass of CF4 within each balloon. Individual results for each balloon
tested are illustrated in Figure 4. It indicates that the average mass of CF4 for each balloon was
15.4 mg ± 5.4%. The theoretical mass of CF4 for 4 liters of gas at 1000 ppm is 14.88 mg,
indicating a good correspondence with the measurements.
Figure 4. Repeatability of individual balloons fill-up.
For each combination of scenario and position, a minimum of three gas injections were performed to verify the repeatability of the results. Additionally, the CF4 concentration was
steadily monitored before each injection to make sure that no traces of CF4 either from a
previous test or from the cell itself were present before the test. Figure 5 shows a preliminary measurement sequence. It is relatively easy to notice that the baseline starts to increase after the first part of the test because of CF4 actually produced by the cell. For this reason, this actual test
was not included in the final results due to the presence of LVAE.
6
Dando and al. [8] mentioned that emissions of CF4 coming from adjacent cells represent a
possible error source when measuring CF4 emissions of a given cell. For this reason, a
supplementary test has been performed using tracer gas to find out if this phenomenon has a significant impact on gas emission measurements. The details of this test is described and discussed in section 3.4.
2.4. Further measurements
In addition to the continuous monitoring of the gas concentration, two other types of measurements were performed to calculate accurately the gas flow in the duct during the experimentations.
For each of the seven scenarios, the flow rate was measured within the duct of the cell using a pitot tube. The measurement was performed prior to each scenario once the hooding conditions were settled as required.
The temperature of the gas was measured inside the duct from both sides before each test (under optimal hooding conditions) and each time when tracer gas was injected into the cell for a test. With this information, it was possible to consider the influence of the temperature on the volumetric flow rate. It allows for a more accurate calculation of the mass of CF4 that passed
through the duct end of the cell using the FTIR measured concentration for each test. 3. Results and Discussion
3.1. Elements which can influence the results
Before presenting the experimental results, it is important to understand that various factors can have a significant influence on the detected concentration of CF4:
The tracer gas injected in the cell should dissipate within the cell volume as more than 2000 liters of gas is passing through the duct end every second. For this reason, the residence time of the tracer gas inside the cell will affect the measured concentrations of the emissions. However, as long as the concentration remains above 10 ppb, it will have a little to no effect on the total mass calculation as it depends on the integration of the area under the detected evolution of the concentration curve. However, if the tracer gas is not passing through the duct end quickly enough, the concentration of CF4 will fall below the limit of detection of the FTIR and it will be
impossible to account correctly for this part of the tracer gas.
As mentioned previously, the gas is transported up to the duct end by five independent inner ducts. Each duct was designed with different sections to compensate for their different lengths in favor of a uniform gas collection from the various areas. Assuming that the design is correct under ideal hooding conditions, the flow rate in each duct should be similar. However, under modified hooding conditions, the concentration of CF4 within each internal duct should be
different. Figure 6 shows a superposition of the two sections of the duct end. Section U (rectangularly shaped) illustrates the structure of the inner ducts before the mixing of the gas. Section V (circularly shaped) is located approximately 3 feet after section U and illustrates the point where the gas samples are extracted and where the temperature is measured. It is plausible to assume that the mixing of the gas from five different sources is not complete after such a short distance, hence it is possible that the gas collected by the probe do not represent the overall concentration of the main duct but rather a concentration influenced by the inner gas concentration coming from the nearest inner duct (A, B and D). Under perfect mixing conditions, the total flow rate going through the sampling probe should be the evenly divided between each of the five inner ducts, i.e. 1/5 of the total flow is coming from each inner duct. However, this is not necessarily the case during our experiments.
7
Figure 6 : Superposition of two sections of the duct end.
In addition to the previous point, it is necessary to consider the fact that for some cases in our study, some hoods were removed to establish different conditions than what the inner ducts were designed for. Hence, it is plausible that the uniformity among those inner ducts was disrupted, allowing for different flow rates originated from different regions of the cells. Additionally, an accumulation of dust in the inner ducts during the year of operation of the cell could generate a similar effect.
3.2. Influence of the tracer gas injection point
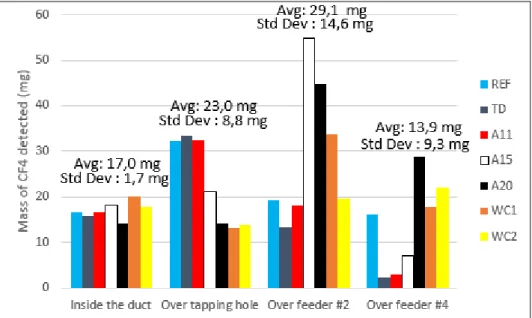
Figure 7 illustrates that there are significant variations of the measured gas concentration with the different hooding scenarios and tracer injection locations. However, when examined carefully, there are several tendencies that can be clearly observed.
Figure 7. Average mass of CF4 detected for all scenarios investigated.
The experimental results were obtained by tracer gas injections which simulates localized gas emissions during normal cell operation. Figure 7 demonstrates that the position of the emission
8
(will have a significant impact on the results. The impact of the hooding conditions will be investigated later in this paper, in section 3.3.
The total mass of CF4 measured when the tracer gas was injected into the duct is relatively
constant in comparison to other results (standard deviation between different perturbation cases of only 10%). This result was expected due to the fact that the injected gas is hardly influenced by the airflow within the cell volume, limiting the possibility of the tracer to divide itself among multiple inner ducts. Hence, the effect of the hooding conditions is negligible on those results. Therefore, all of the injected gas remains inside the inner duct “A” and is transported to the region where the sampling probe collects the gas for analysis. The fact that the average mass is 17.0 mg indicates that a little more than half of the injected mass of CF4 is detected, therefore
one can assume that approximately 1/10th of the gas collected by the sampling probe comes from the inner duct A.
The measured average mass of CF4 increased when the tracer gas was injected above the
tapping hole. This position is in a similar distance from the sampling point as the inner duct entry point but well below it, closer to the crust. For this reason, the tracer gas can dissipate within the cell volume and the most significant part of the tracer probably goes through the inner ducts A and B. Consequently, as the tracer passes through multiple inner ducts, it is more likely to be distributed more uniformly that results in a scenario closer to the reality. However, it can be concluded that when the gas goes through a higher number of inner ducts, the effect of hooding conditions become more apparent and the variation of detected CF4 mass increases
accordingly.
The results obtained with the injection above feeder #2 are in good agreement with the previous statements. When the tracer gas is inserted close to the middle of the cell, multiple paths are available for the gas depending on the airflow conditions inside the inner volume of the cell. Therefore, the gas can be transported through additional inner ducts, increasing the probabilities of collecting a more accurate measurement. Hence, the measured average mass of CF4 increased
and is very close to the real mass injected (94%). However, the variation of mass with hooding condition is even more important than that observed previously.
Once again, when the tracer gas is injected above the feeder #4, the observations correlate with the previous cases. Due to the proximity of the duct end of the cell, the tracer gas will most likely pass through a single inner duct (E). Hence, the average mass of CF4 is in the same order
of magnitude as the first position (tracer directly injected in inner duct A). On the other hand, as it is affected by the airflow in the inner volume of the cell under the hood, the variation of the detected tracer mass will be more important.
3.3. Influence of the hooding conditions
As presented in section 2.2, the different hooding conditions investigated can be classified into 4 different categories:
Hooding conditions during tapping of metal
Hooding conditions during an anode change
Hooding conditions when an important opening is present (1/4 of the cell)
Hooding conditions with uniformly distributed poor hooding conditions. (1 hood out of 4 removed)
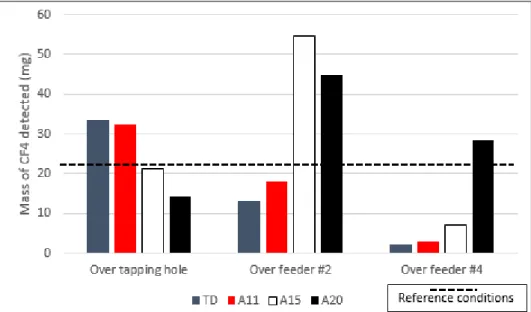
The two first scenarios show a very similar impact on the detected mass. In fact, Figure 8 clearly demonstrates that the mass of CF4 detected for each case is more important when there is
an opening in the hooding close to the injection point. Maximums have been always reached under such circumstances; tapping doors and anode #11 for injection above the tapping hole, anode 15 for injection above feeder #2 and anode #20 for insertion above feeder #4 respectively. This behaviour is caused by an increased pressure gradient in the area in the presence of an
9
opening in the hoods, resulting in an increased airflow from the same area. This increased flow rate generates a non-uniform distribution of the airflow among the five inner ducts. Henceforth, the gas extracted with the sampling probe will more accurately represent the composition of the inner ducts closer to the opening. Furthermore, it explains why in some cases (Feeder #2 / A15 and A20), the measured mass of CF4 is significantly higher than what was really injected with
the balloons. It also explains the opposite behaviour observed for feeder #4 / TD and A11. As the injection point of the gas was really far from the favoured inner duct (A), the tracer gas was less rapidly transported to the main duct, resulting in a stronger dilution. The CF4 concentration
in the gas was then very close to the lower limit of detection of the FTIR, giving a mass of CF4
almost negligible in comparison to what was really injected into the cell.
Investigation of the worst-case scenario #1 will not be discussed in detail. The results show a similar behaviour to what was previously discussed regarding scenarios A11, A15 and A20. That is to say, the mass measured increases if the tracer gas passes through multiple inner ducts. This correlation is even stronger if there is an opening in the hooding near the injection point of the gas.
Figure 8. Influence of hooding conditions during routine operations. (TD = Tapping doors open / A11, A15 and A20 represent hoods opened similar to an anode change of each respective anode number / dashed line represents the reference average under perfect hooding conditions.)
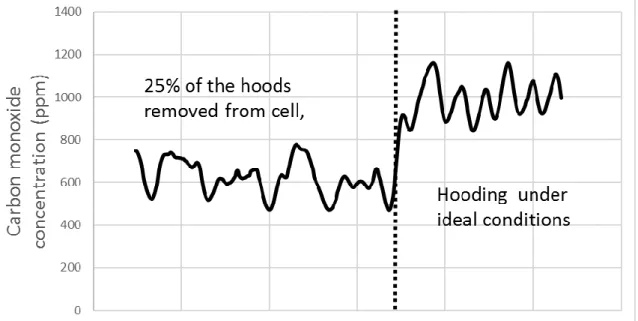
The last scenario to discuss represents the worst case scenario #2 (WC2) where 25% of the hoods are removed, uniformly across the cell. The investigation indicates that significant perturbation occurs in the airflow of the main duct under such circumstances, leading to less accurate composition measurement. This behaviour is more apparent when following the concentration of carbon monoxide released by the cell (illustrated in Figure 9). Emissions of CO in the cells are mostly related to anode oxidation and reoxidation of the aluminium. Both phenomena will generally occur around specific anodes, which offer proper conditions for these reactions (bad anode covering, lower ACD, increased liquid movement, etc.). For this reason, the concentration of CO should vary between each inner duct. Hence, the mixing of the gas within the main duct will have a great influence on the CO concentration of the overall gas emitted. Consequently, it is possible to correlate the erratic behaviour observed in Figure 9 with perturbations in the mixing conditions within the main duct. Thus, when multiple hoods are misplaced on the cell, increased perturbations in the gas movement will lead to inaccurate measurements of a localised phenomenon. The amplitude of the fluctuations did not change
10
significantly but the shape is clearly different. Hence it will necessarily affect measurements that are influenced by time, which is the case in our study.
Figure 9. Carbon monoxide emissions under different hooding conditions.
Another phenomenon that can be observed in Figure 9 is a diminution of the measured concentration of the gas. Under ideal conditions, the concentration of CO coming out of the cell is close to 1000 ppm but when some hoods are misplaced, the analysis of the gas composition shows a drop of approximately 30% in the measured average concentration of carbon monoxide. However, this observation is less likely to apply to CF4 measurements. The reason for this
statement is that there is a significant difference between the densities of the two gas at 15°C and 1 atm. CO has a density of 1.14 kg/m3 while the density of CF4 is 3.72 kg/m
3
[9]. Therefore, the CF4 is more likely to stay within the cell and follow the airflow towards the inner ducts
under the effect of the pressure gradient. On the other hand, due to a smaller density then air, CO will have a tendency to rise and leave the cell where there are no physical barriers (hoods) that restrain its movement.
3.4. Other results of interest
An additional test was performed to evaluate if the conclusions published by Dando et al. [8] could apply to the cell technology used in the present study. During their work they detected PFC emissions coming from adjacent cells. It is mentioned that an excess of PFC gas was released by the cells during start-up due to the initial long anode effect. Because CF4 has a more
important density than air, this gas would remain downstairs in the potroom and could be transported to adjacent cells. However, the potroom configuration in this study is different from theirs and the hooding conditions are not necessarily similar.
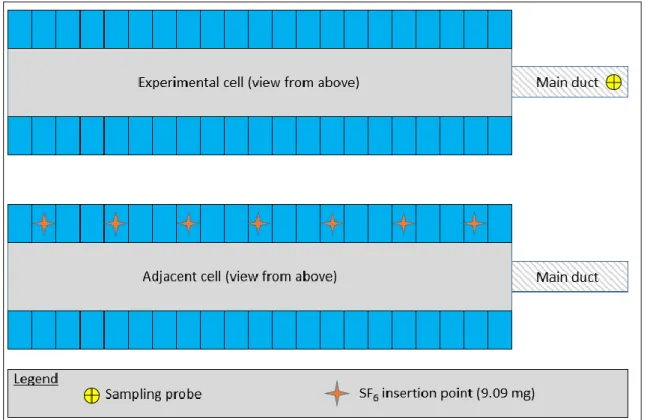
In this study, sulphur hexafluoride (SF6) was manually injected onto the cell proximities, above
the hoods from an adjacent cell to reproduce the effect of the gas coming out from this adjacent cell. For both cells, the hooding conditions were kept ideal. 63.63 grams of SF6 was used for
this test, divided evenly between 7 locations illustrated in Figure 10. This represents the total mass of CF4 that is normally produced during an above average anode effect.
11
Figure 10. Possible contamination test coming from an adjacent cell.
The SF6 concentration in the main duct of the experimental cell was closely monitored during
the test but no traces of SF6 higher than the noise level could be observed. This indicates that for
the cell technology used in this study, the gas collection system appears strong enough to collect the gas in the cell volume as well as in an adjacent area outside its enclosure. For this reason, the collection system from the adjacent cell collected all of the SF6 and no traces of this
component was detected in the experimental cell. Hence the risk of contamination from an adjacent cell is negligible when the hooding conditions are close to ideal.
4. Conclusion
This paper investigated the accuracy of composition analysis performed on gas sampled directly at the duct end of an electrolysis cell. The methodology involved injecting a known tracer gas under multiple sets of conditions. The results indicate that the injection site of the tracer gas influenced significantly the detected mass of CF4 collected in the main duct. There is direct
relation between the accuracy of the measurement and the number of inner ducts among which the tracer gas is distributed. Henceforth, it adds significant doubts regarding the accuracy of localized measurements occurring during LVAE but the effect become negligible if the distribution of PFC is uniform across the entire cell volume.
Similarly, the hooding conditions affect the individual flow rate of each inner duct, changing the resulting concentration of gas collected with the sampling probe. The results clearly demonstrate that tracer gas emissions were more accurately detected when injected close to an opening in the hooding, indicating an increased airflow in that region of the cell. Additionally, very poor hooding conditions will generate significant perturbation in the airflow, leading to inaccurate results due to an inadequate mixing of the gas and extensive dilution.
Finally, this paper clearly demonstrated that measurements of the composition of gas extracted at the duct end of an electrolysis cell could be adequate for qualitative studies. However, the accuracy of such a method is influenced by too many factors and is inadequate for quantitative measurements of localized emissions. Refinements are required to investigate such
12
phenomenon. Such refinements could include a change in the structure of the main duct to ensure an adequate mixing of the gas coming from the five inner ducts before it is extracted and sent to an FTIR for analysis.
5. Acknowledgements
The support from Aluminerie Alouette to perform and publish this study is greatly acknowledged. The help offered by Guy Ladouceur, process technician at Alouette, is deeply appreciated for the successful establishment of the experimental setup.
6. References
1. Dion, L., Bilan de matière dynamique pour une aluminerie, in Département des sciences appliqués. 2014, Université du Québec à Chicoutimi: Chicoutimi. p. 116. 2. Dion, L., et al. Using artificial neural network to predict low voltage anode effect PFCs
at the duct end of an electrolysis cell. in Light Metals. 2016. Nashville.
3. Dion, L., et al., Prediction of low voltage tetrafluoromethane emissions based on the operating conditions of an aluminium electrolysis cell. JOM, (2016) doi : 10.1007/s11837-016-2043-6
4. Wangxing, L., et al. On continuous PFC generation unrelated to anode effects. in Light Metals. 2011.
5. Chen, X., et al. Investigation on formation mechanism of non-anode effect related PFC emissions from aluminum reduction cells. in TMS Light Metals. 2013.
6. Wong, D. and J. Marks. Continuous PFC emissions measured on individual 400 kA cells,. in Light Metals. 2013. San Antonio.
7. Batista, E., et al. Sustainable reduction of anode effect and low voltage PFC emissions. in Light Metals. 2016.
8. Dando, N.R., et al. Non anode effects PFC : Measurement consideration and potential impact. in Light Metals. 2015. Orlando.
9. Air_Liquide. Gas Encyclopedia. 2013 [cited 2016 07-19]; Available from: