i
Interactions between gas bubbles and crystals in silicate
melts
by Pia Pleše
A Thesis presented to the Université du Québec à Chicoutimi as partial fulfillment of requirements for the degree of Doctor in Earth and Atmosphere Sciences
Québec, Canada
ii RÉSUMÉ
Les bulles de gaz dans les fondus silicatés sont l’un des principaux moteurs des éruptions volcaniques. Leur nucléation, leur croissance et leur potentiel d'attachement / décollement peuvent grandement influencer l'explosivité de l'éruption. La cinétique des bulles est généralement déterminée à partir d'analyses d'échantillons naturels et de produits d'essais expérimentaux trempés. Cependant, ces échantillons ne donnent qu’une vue de l’état final, à partir duquel il faut déduire les conditions initiales d’un système magmatique en évolution dans le temps. Les interprétations qui suivent sont inexactes en raison de l’incapacité de déterminer les conditions exactes de nucléation et du détachement potentiel des bulles de leurs sites de nucléation, une incertitude qui peut masquer leurs sites de nucléation.
Jusqu'ici, sur la base des mesures 2D post-processus des angles de contact entre des cristaux et des bulles, les cristaux de silicate ont été jugés inefficaces lors de la nucléation de bulles hétérogène et les cristaux d'oxydes ont été jugés efficaces. Les données disponibles dans la littérature sont toutefois rares et incohérentes, par ex. pour la même valeur d'angle de contact rapportée, les oxydes sont considérés comme efficaces et les silicates inefficaces. L'affinité mutuelle des bulles et des cristaux d'oxydes a également conduit à des modèles de transport d'oxydes via des bulles en fontes naturelles. Cependant, malgré l’acceptation généralisée de l’association oxyde-bulle, il existe peu de preuves texturales directes de ces processus. Ces incohérences et modèles basés sur des observations limitées ont conduit à examiner d'autres interactions possibles entre les bulles et les cristaux dans les fondues andésitiques.
iii Pour surmonter les incertitudes liées aux mesures post-processus, des expériences de microscopie à rayons X 4D dynamiques, en temps réel (in situ) ont été conduites sur des fondues cristallines andésitiques synthétisées de manière expérimentale avec 0.25 à 0. 5% H2O en masse. Les échantillons ont été chauffés à 1 atm pour induire la nucléation des bulles
et suivre la croissance et le mouvement des bulles. Des expériences complémentaires ont permis de déterminer si des bulles pouvaient se nucléé sur les surfaces cristallines du plagioclase lors du dégazage des fondues andésitiques induites par la décompression, à l'aide d'un appareil à piston et cylindre. Tous les produits expérimentaux post-processus ont été imagés avec une tomographie 3D à rayons X.
Contrairement aux études précédentes, il a été constaté que les bulles dans les expériences à 1 atm formaient facilement sur les cristaux de plagioclase et de clinopyroxène et que l'angle de contact entre cristaux et bulles changeait au cours de la croissance. Dans les expériences de décompression, les cristaux de plagioclase dans tous les échantillons étaient complètement recouverts de bulles. Des comparaisons de la taille des bulles entre les bulles en contact avec le plagioclase et les bulles dans la fonte (mesurées sur des échantillons décompressés) ont montré deux populations, générées par deux événements différents, l’un étant la nucléation hétérogène à la surface des cristaux de plagioclase et l’autre homogène dans la fonte. La force d’attachement calculée entre les bulles et la surface du plagioclase est telle que les bulles resteraient attachées pendant les mouvements des cristaux flottants. La flottabilité nette était principalement positive, ce qui indique que les agrégats de bulles de plagioclase pourraient couler dans une chambre magmatique.
La nucléation rapide et hétérogène des bulles à 1 atm sur des cristaux de plagioclase a montré que les silicates peuvent avoir une incidence sur quand les vésiculations se produisent lors d'éruptions volcaniques. Les résultats soulignent la nécessité de reconsidérer le rôle des
iv cristaux de plagioclase et éventuellement de clinopyroxène dans le dégazage magmatique. Les agrégats de bulles de plagioclase trouvés dans les expériences de décompression montrent des possibilités de dégazage déclenché par le mélange de magma et de stockage de gaz potentiel en profondeur.
Au cours des expériences de décompression, des agrégats complexes d'oxydes et bulles se sont également formés en raison de la perte d'hydrogène à travers les parois de la capsule, entraînant une oxydation de la fonte. De petits cristaux d'oxyde recouverts d'une partie des surfaces extérieures de la bulle dans une morphologie en forme de coquille. Les volumes de bulles et d'oxydes ont été quantifiés et leur surface de contact mesurée en 3D. La complexité des agrégats de bulles-oxydes en 3D a révélé une gamme d’interactions, allant de la génération continue, du détachement et de la désintégration. Des échantillons naturels similaires provenant de différents environnements géologiques existent et indiquent que des interactions analogues se produisant dans une gamme beaucoup plus large de compositions rocheuses.
v ABSTRACT
Gas bubbles in silicate melts are one of the key drivers of volcanic eruptions. Their nucleation, growth and potential for attachment to/detachment from other phases can greatly influence eruption explosivity. Bubble kinetics are generally determined from examinations of natural samples and quenched experimental run products. These samples, however, only provide a view of the final state, from which the initial conditions of a time-evolving magmatic system must be inferred. The interpretations that follow are inexact due to our inability to determine the exact conditions of nucleation and the potential detachment of bubbles from their nucleation sites, an uncertainty that can obscure their nucleation location.
So far, based on sparse post-process 2D measurements of bubble-crystal contact angles, silicate crystals were deemed inefficient at heterogeneous bubble nucleation and oxide crystals were deemed efficient, even for the same reported contact angle value. The mutual affinity of bubbles and oxide crystals has also led to models of oxide transport via bubbles in natural melts. However, despite the widespread acceptance of bubble-oxide association, there is little direct textural evidence for these processes. These inconstancies and models based on limited observations led to my examination of other possible bubble-crystal interactions in andesitic melts, presented within this thesis.
To overcome uncertainties related to post-process measurements, dynamic, real-time (in situ) 4D X-ray microscopy experiments were conducted on experimentally synthesized andesitic crystal bearing melts with 0.25 – 0.5 wt. % H2O. The samples were heated at 1 atm
to induce bubble nucleation and track bubble growth and movement. Complementary experiments examined whether bubbles can nucleate on plagioclase crystal surfaces during
vi decompression-induced degassing of andesitic melts, using a piston-cylinder apparatus. All post-process experimental products were imaged with 3D X-ray computed tomography.
In contrast to previous studies, it was found that bubbles readily nucleated on plagioclase and clinopyroxene crystals in 1 atm experiments, and that the bubble-crystal contact angle changed during growth. In decompression experiments, plagioclase crystals in all samples were completely covered with bubbles. Bubble size distribution comparisons between bubbles in contact with plagioclase and bubbles in the melt (measured on decompressed samples), showed two populations, generated by two different events: 1) heterogeneous nucleation on plagioclase crystal surfaces, and 2) homogeneous nucleation within the melt. The calculated attachment force between the bubbles and the plagioclase surface is such that bubbles would remain attached during buoyant crystal movements. The net buoyancy indicated that the bubble-plagioclase aggregates of respective sizes such as those in the experiments could sink in an andesitic melt.
The rapid heterogeneous nucleation of bubbles at 1 atm on plagioclase crystals showed that silicates can affect when vesiculation ensues in volcanic eruptions. The findings highlight the need to reconsider the role of plagioclase, and possibly clinopyroxene, crystals in magmatic degassing. Bubble-plagioclase aggregates found in decompression experiments show possibilities for magma mixing-triggered degassing and potential gas storage at depth.
During decompression experiments, complex bubble-oxide aggregates also formed, due to hydrogen loss through the capsule walls causing oxidation of the melt. Small oxide crystals coated part of the outer bubble surfaces in a shell-like morphology. The bubble and oxide volumes were quantified, and their contact surface area measured in 3D. The
vii complexity of 3D bubble-oxide aggregates revealed a range of interactions, from continuous generation, detachment and disintegration. Similar natural samples from different geological environments do exist and point to analogous interactions occurring in a much wider range of rock compositions.
ii TABLE OF CONTENTS
RÉSUMÉ ... ii
ABSTRACT ... v
TABLE OF CONTENTS ... viii
LIST OF TABLES ... xii
LIST OF FIGURES ... xiii
LIST OF ABBREVIATIONS ... xvi
LIST OF SYMBOLS ... xvii
FUNDING ... xix
CHAPTER 1 ... 1
Introduction, Hypotheses, Objectives, Methodology ... 1
1.1 Introduction ... 2
1.2 Problem: What is the influence of crystals on bubbles in magmas? ... 4
1.2.1 Bubble nucleation ... 4
1.3 Problem: difficulties in correctly interpreting interactions from post-process samples ... 13
1.3.1 Attachment of bubbles to crystals ... 14
1.3.2 Detachment of bubbles from crystals ... 14
1.3.3 Buoyancy of bubble-crystal pairs ... 15
1.4 Hypothesis ... 17
1.5 Objectives ... 18
1.6 Methodology ... 19
1.6.1 High pressure and high temperature sample synthesis ... 19
1.6.2 3D imaging with X-ray tomography ... 21
1.6.2.1 Basics of X-ray tomography……….21
1.6.2.2 Synchrotron radiation X-ray micro-tomography………..23
1.6.3 Analysis of reconstructed 3D sample volumes ... 25
1.6.4 Scanning electron microscopy (SEM) ... 26
1.7 Format of the thesis ... 27
1.8 Declaration of original contribution ... 29
ix 1.10 References: ... 32 CHAPTER 2 ... 39 RÉSUMÉ ... 40 ABSTRACT ... 41 2.1 Introduction ... 42
2.2 Materials and methods ... 49
2.2.1 Hydrous glass synthesis ... 49
2.2.2 X-ray computed tomography (CT) ... 50
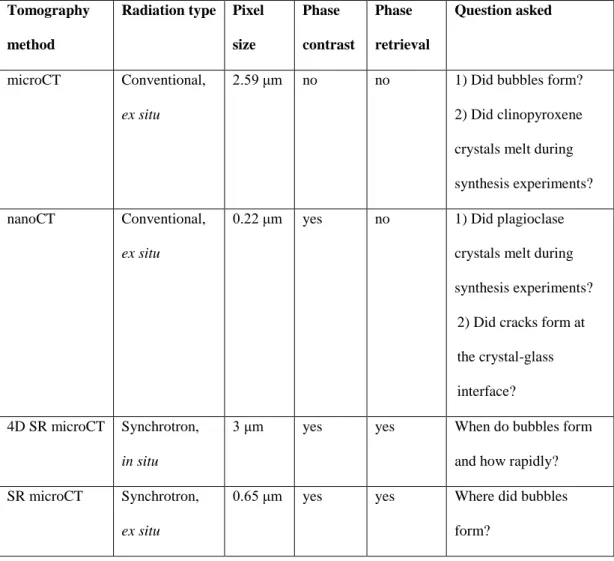
2.2.3 Conventional X-ray microtomography (microCT) ... 52
2.2.4 Conventional X-ray nanotomography (nanoCT) ... 52
2.2.5 4D in situ synchrotron X-ray microtomography ... 53
2.2.6 High resolution ex situ synchrotron X-ray microtomography ... 55
2.2.7 Volume segmentation ... 56
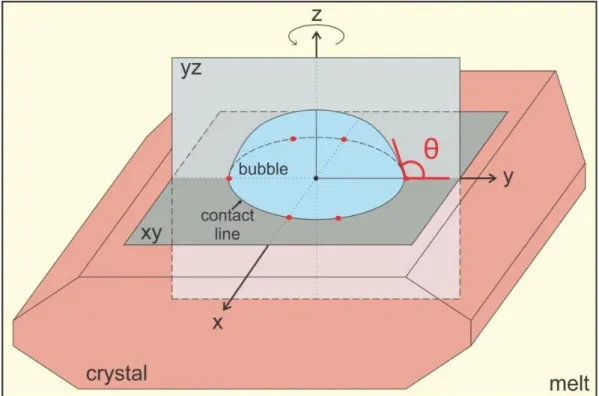
2.2.8 Contact angle measurements in 3D ... 58
2.2.9 Scanning electron microscopy ... 60
2.2.10 X-ray tomographic microscopy at APS ... 60
2.3 Results ... 61
2.3.1 Starting glass + crystals ... 61
2.3.2 In situ vesiculation ... 63
2.4 Discussion ... 76
2.4.1 Lack of bubble nucleation on the cracks within the glass and crystals ... 76
2.4.2 Lack of nucleation on crypto-heterogeneities in the melt ... 78
2.4.3 Lack of nucleation adjacent to the crystals (“melt films”) ... 79
2.4.4 Bubble nucleation and surface asperities ... 84
2.4.5 Effect of crystal edges on bubble nucleation and growth ... 85
2.4.6 Contact angle changes and possible bubble detachment ... 86
2.5 Conclusions ... 90
2.6 Acknowledgements ... 92
2.7 Author contributions ... 92
2.8 References ... 93
x CHAPTER 3 ... 117 RÉSUMÉ... 118 ABSTRACT ... 120 3.1 Introduction ... 121 3.2 Methodology ... 124
3.2.1 Piston-cylinder synthesis of hydrous andesitic glasses ... 124
3.2.2 X-ray computed microtomography (microCT) ... 127
3.2.3 Volume segmentation and measurements in 3D ... 127
3.2.4 Scanning electron microscope (SEM) analysis ... 134
3.3 Results ... 136
3.3.1 General sample appearance ... 136
3.4 Discussion ... 147
3.4.1 Plagioclase crystals with ˝sieve˝ rims ... 147
3.4.2 Bubbles in contact with plagioclase crystals ... 150
3.4.3 Bubbles not in contact with plagioclase crystals ... 156
3.4.4 Forces acting on a bubble-crystal aggregate and on a single bubble on a plagioclase surface ... 158
3.4.5 Magma-mixing triggered heterogeneous bubble nucleation ... 164
3.5 Conclusions ... 165 3.6 Acknowledgements ... 166 3.7 Author contributions ... 166 3.8 References ... 167 3.9 Appendices ... 174 CHAPTER 4 ... 177 RÉSUMÉ ... 178 ABSTRACT ... 180 4.1 Introduction ... 182
4.2 Materials and methods ... 185
4.2.1 Hydrous glass synthesis ... 185
4.2.2 X-ray computed tomography ... 187
4.2.3 Volume segmentation, visualization and measurements in 3D ... 189
xi
4.3 Results ... 194
4.3.1 Appearance of samples and bubble-oxide aggregates within them ... 194
4.3.2 Morphological parameters of bubble-oxide aggregates ... 203
4.3.3 SEM analysis of experimental charges and natural samples ... 205
4.4 Discussion ... 208
4.4.1 Snapshots of dynamic processes from experimental charges frozen in time ... 208
4.4.1.1 Potential harvesting of oxides originating from the melt or the amphiboles ………..208
4.4.1.2 In situ crystallization of oxides on bubble walls……….210
4.4.1.3 Bubble breakup via daughter bubble generation through an oxide shell aperture………213
4.4.1.4 Stability of bubble-oxide aggregates through attachment and detachment ………..217
4.4.1.5 Bubble-oxide aggregates with multiple oxide shells………..221
4.4.1.6 Preservation potential of oxide shells……….222
4.4.2 Occurrences of analogous structures in geological materials ... 223
4.4.2.1 Krafla granophyres………..224
4.4.2.2 Micrometeorites………..227
4.4.2.3 Orbicular chromite………..231
4.4.2.4 El Laco magnetite deposit………...231
4.5 Conclusion... 232 4.6 Acknowledgements ... 234 4.7 Author contributions ... 234 4.8 References ... 235 4.9 Appendices ... 246 CHAPTER 5 ... 269
Synthesis and conclusions ... 269
5.1 Nucleation and growth of bubbles on silicate crystals ... 272
5.2 Nucleation and growth of oxide crystals on bubbles ... 276
5.3 Conclusions and future work ... 280
xii LIST OF TABLES
CHAPTER 1
Table 1.1 Summary of several experimental studies on bubble nucleation ………...…….12 CHAPTER 2
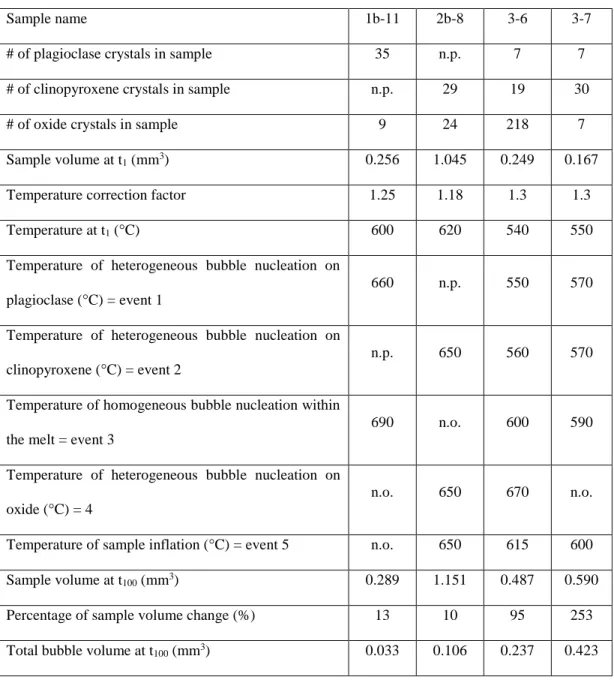
Table 2.1 Summary of different tomography methods used and questions to be answered with them………. 51 Table 2.2 Quantitative data for four representative samples………... 65
CHAPTER 3
Table 3.1 Experimental conditions during the piston-cylinder sample synthesis………. 126 Table 3.2 Bubble number densities measured within the melt (mm-3) and on the total
crystal surface, the latter converted from 2D to 3D (mm-3) ………. 133
Table 3.3 Physical parameters of the melt and bubbles at different pressures………….. 153 Table 3.4 Contact angle values (3D) and volumetric parameters used to calculate different
forces acting on bubbles located on plagioclase crystal surfaces and on bubble-plagioclase aggregates ……….. 160
CHAPTER 4
Table 4.1 Summary of experimental conditions during hydrous glass synthesis in a piston-cylinder apparatus………..… 188 Table 4.2 Summary of the selected geometrical parameters obtained from 3D
measurements of bubble-oxide aggregates ………... 198 CHAPTER 5
Table 5.1 Comparison between previous bubble nucleation studies and the study presented in Chapter 3 ………...271
xiii LIST OF FIGURES
CHAPTER 2
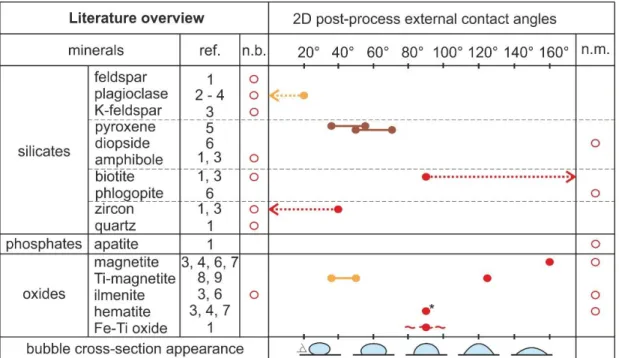
Figure 2.1 Model of bubble formation in silicate melts ………. 43 Figure 2.2 Literature compilation of reported bubble-crystal 2D post-process external
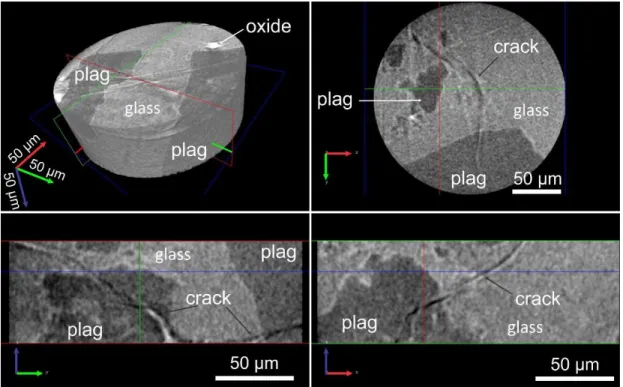
contact angles ………...… 46 Figure 2.3 Schematic model of the 3D bubble-crystal contact angle measurement …….. 59 Figure 2.4 3D visualization and three orthogonal 2D slices of an ex situ nanoCT scan of a
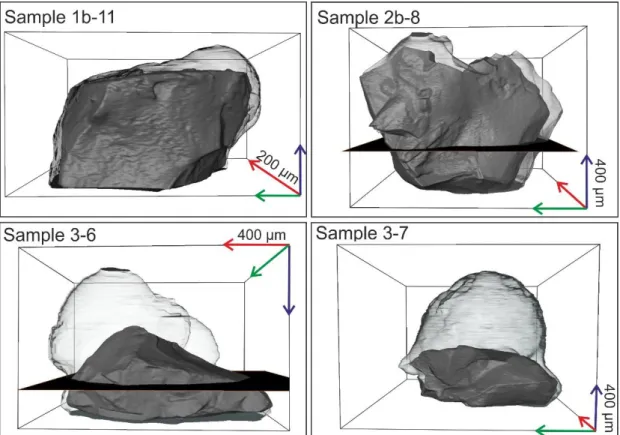
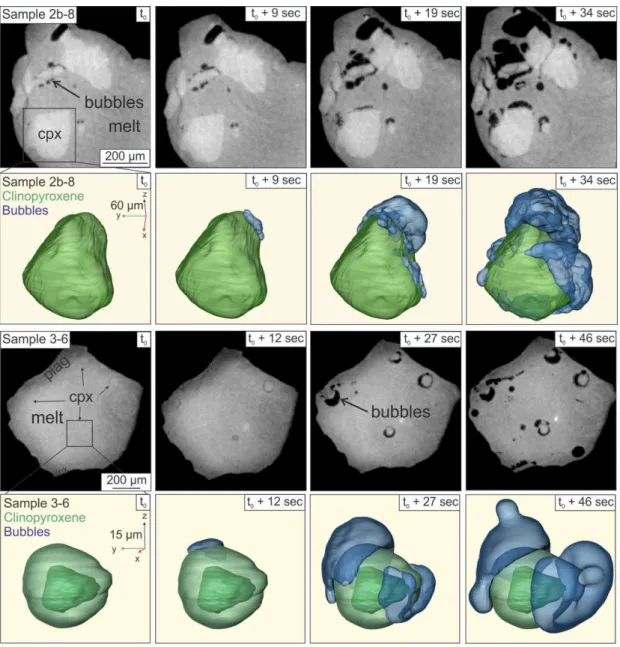
region of interest within a starting material sample ………... 62 Figure 2.5 3D representation of 4 representative samples of melt + crystals + bubbles .... 66 Figure 2.6 Timeline of nucleation events during the in situ heating experiments ………. 67 Figure 2.7 2D and 3D sequences of bubble nucleation and growth on silicate crystals
during heating ……….… 68 Figure 2.8 A comparison between the in situ and the ex situ synchrotron radiation
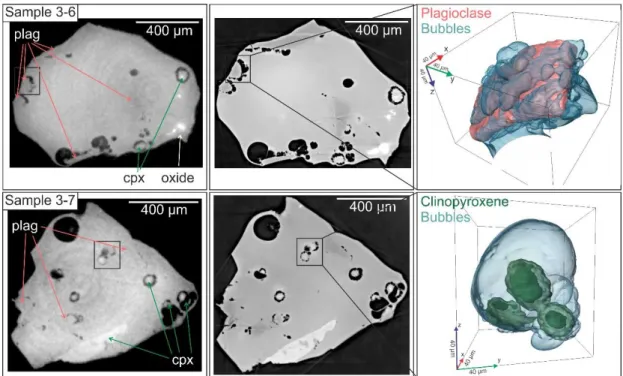
imaging……… 71 Figure 2.9 Post-process images of sample 3-7, observed with a SEM and with
propagation-based phase contrast synchrotron radiation microCT ………. 81 Figure 2.10 Comparison of bubble-crystal textures in experimental charges and natural
samples visualized using microtomography ……… 83 Figure 2.11 Possible bubble-crystal detachment scenarios ……… 89
CHAPTER 3
Figure 3.1 3D visualization of sample 25-1 ……… 128 Figure 3.2 Comparison between BSE images and the corresponding 2D slice from
microCT images, of sample 24-2 ………... 135 Figure 3.3 X-ray tomography visualizations of sample 21-1 and a plagioclase crystal
within it ……….. 138 Figure 3.4 X-ray tomography visualizations of sample 25-1 and a plagioclase crystal (the
only closed one) within it ………. 139 Figure 3.5 Comparison between different bubble number density (BND) measurements
from two subvolumes for the same samples ……… 142 Figure 3.6 Bubble size distribution diagrams for bubbles in melt and on crystals for
xiv Figure 3.7 Bubble size distribution diagrams for bubbles in melt and on crystals for
samples at 350 MPa decompression ………. 145 Figure 3.8 Schematic representation of the forces acting on the entire plagioclase-bubble
aggregate and on a single bubble on the plagioclase surface ………... 161
CHAPTER 4
Figure 4.1 3D visualization of 7 different bubble-oxide aggregates ……… 191 Figure 4.2 2D and 3D visualization of bubble-oxide aggregate 23-2-1_ox1 …………... 195 Figure 4.3 Plots of geometrical data for bubble-oxide aggregates ………... 201 Figure 4.4 Selected SEM (2D) and tomographic (3D) images for two experimental samples ……….… 207 Figure 4.5 Summary of observations of bubble growth and oxide shell development …. 215 Figure 4.6 Schematic representation of the behavior of bubble-oxide aggregates in relation
to the maximum adhesion area ………... 219 Figure 4.7 SEM and tomographic images for natural sample KR7 from Krafla ………. 225 Figure 4.8 A compilation of analogous structures found in literature ………. 229
LIST OF APPENDICES
CHAPTER 2
Appendix 2.1 Time-lapse animation of a 2D axial slice of sample 2b-8, from the in situ imaging, complimentary to Figure 2.7 ……….. 103 Appendix 2.2 Time-lapse animation of a 2D axial slice of sample 3-6, from the in situ
imaging, complimentary to Figure 2.7 ……….. 103 Appendix 2.3 Time-lapse animation of bubbles growing on a clinopyroxene crystal, from
sample 2b-8, visualized in 3D ………... 103 Appendix 2.4 Time-lapse animation of bubbles growing on a clinopyroxene crystal, from
sample 3-6, visualized in 3D ………. 104 Appendix 2.5 3D visualization of sample 2b-8 ……… 104 Appendix 2.6 3D visualization of sample 3-6 ……….. 104
xv Appendix 2.7 Compositional analysis performed with a BSE detector on several points for
images presented in Figure 2.9 a–l ……….... 105
CHAPTER 3
Appendix 3.1 Scanning conditions using Skyscan 1172 at MIAM ……….… 174 Appendix 3.2 Compositional analysis performed with a BSE detector on several points for
sample 24-2, shown in Figure 3.2 a ………... 175
CHAPTER 4
Appendix 4.1 Initial compositions of andesitic rock powder, seed silicate crystals from literature, and compositional analysis performed with a BSE detector of several bubble-oxide aggregates, one natural sample from Krafla and of the standards used ……….. 246 Appendix 4.2 Scanning conditions using Skyscan 1172 at MIAM ………. 268
Note:
No permission required for the usage of Figures, Tables and Appendices in Chapter 2. Permission for usage of Figures, Tables and Appendices in Chapter 4 obtained (Springer Nature License) and can be presented by the thesis author upon request.
ii LIST OF ABBREVIATIONS n. b. - nota bene n. p. – not present n. o. – no observed vs. - versus CT – computed tomography
microCT – micro computed tomography nanoCT – nano computed tomography SR – synchrotron radiation
HPHT – high pressure and high temperature
SEM-EDS – scanning electron microscope energy dispersive X-ray spectroscopy
BSE – backscattered electron BND – bubble number density BSD – bubble size distribution
NNO – nickel-nickel-oxide oxygen buffer
2D – two-dimensional 3D - three-dimensional 4D – four-dimensional (3D + time) plag - plagioclase cpx – clinopyroxene amph – amphibole mgt - magnetite µm – micron or micrometer MPa – mega Pascal
GPa – giga Pascal kV – kilovolt
keV – kilo electron-volt mA - milliampere wt. % - weight percent vol. % - volume percent
xvii LIST OF SYMBOLS
𝐷𝑖𝑠/𝑙 – partition coefficient of element i between a solid (crystal) and a liquid (melt) ΔF – Helmholtz free energy
σAB – surface energy or surface tension between phases A and B (solid, liquid, vapour)
Δσ – a change in surface energy between two states (e.g. between fully separated bubble and crystal to fully attached)
θ – outer contact angle, measured within the melt/glass ψ – inner contact angle, measured within the bubble Ф, m, S, F – geometrical factor
B – factor
J – bubble nucleation rate
α – angle between two 2D planes that intersect each other, and a sphere, through its center T – temperature
t – time p – pressure
Δpsat – supersaturation pressure
Δpdec – decompression drop
α 298 K – coefficient of thermal expansion at 298 K
π – 3.14159
fO2 – oxygen fugacity
FeOTOT – the concentration of total Fe expressed as FeO wt. %
µ - viscosity ρ - density
Ra – arithmetic mean roughness value
rbubble – bubble radius
rcriticalbubble – critical bubble radius at the point of neutral buoyancy
rplagioclase – radius of a sphere with volume equivalent to the volume of a plagioclase crystal
reqv sphere – radius of an equivalent sphere
V – volume
VcriticalΣ bubbles – critical volume of the sum of all bubbles on a crystal
VmeasuredΣ bubbles – measured volume of all bubbles on a crystal
Aoxide – bubble surface area in contact with oxides
Scap w/o base – surface area of a spherical cap without its base
h – height of the spherical cap
Slune – surface area of a spherical lune
vt – terminal velocity
g – gravitational constant FG – gravitational force
Fbuoyancy – buoyancy force
Fbuoyancynet – summation of buoyancy forces of a crystal and a bubble on its surface
Fbuoyancydifference – difference of buoyancy forces of a crystal and a bubble on its surface
Fattachment –attachment force between a crystal and a bubble on its surface
xviii AKNOWLEDGEMENTS
There are many people who contributed to this PhD and to whom I am grateful. I would like to first and foremost thank prof. Michael Higgins, my supervisor, for his guidance, patience, understanding and support. I feel very fortunate to have been your student!
Thank you prof. Don Baker, my co-supervisor, for opening the door for me at McGill and introducing me to experimental petrology. I am grateful to all the members of my PhD committee for agreeing to evaluate this thesis and my work: prof. Sarah-Jane Barnes, prof. Sarah Dare and prof. William Minarik.
A special thank you goes to Lucia Mancini and Gabriele Lanzafame from the Elettra Sincrotrone in Trieste. Thank you, Lucia, for opening the door for me and thank you, Gabriele, for all that you’ve taught me! Regarding the many aspects of tomography, I am additionally grateful to Mark Rivers, Francesco Brun, Julie Fife and Jake Casselman for their help and contribution.
I would like to thank Nelson Eby and Chris Ballhaus, the editors of Lithos and Contributions to Mineralogy and Petrology, respectively, at the publishing time of my articles, and all the reviewers, Matteo Masotta, Fabio Arzilli and anonymous, for their work. I am appreciative to the University of Quebec in Chicoutimi and the Department of Applied Sciences for awarding me the Lucien Bouchard and Denis W. Roy grants.
I am grateful to my family back home, Ester, Sara, Dunja, Đurđa, Manja, Miro, Katja, for their love and support. Also, a thank you to all my friends, Croatian and Canadian! Thank you Judit and Michael, for your continuous help and support and for making me feel at home away from home.
And finally, the biggest thank you goes to my beloved husband Marko – you are at the center and the reason for everything and nothing would be possible without your unwavering love, patience, support and sacrifice. This PhD is for you and our family.
xix FUNDING
This work was mainly supported by a NSERC (Canada) Discovery grant to Michael D. Higgins (RGPIN 2012-25137), and additionally by another awarded to Don R. Baker (RGPIN-2015-06355).
The cost of travel and accommodation to Advanced Photon Source synchrotron in Illinois (U.S.A.) and the Swiss Light Source (Switzerland), in addition to the NSERC grants was supported also by a Student Travel/Research Grant awarded to Pia Pleše in 2014 by the Mineralogical Association of Canada. Additionally, the EXTREMA COST Action MP 1207 provided networking support for the travel to Switzerland.
This research used resources of the Advanced Photon Source, a U.S. Department of Energy (DOE) Office of Science User Facility operated for the DOE Office of Science by Argonne National Laboratory under Contract No. DE-AC02-06CH11357. Synchrotron imaging was performed at GeoSoilEnviroCARS (University of Chicago, Sector 13), Advanced Photon Source (APS), Argonne National Laboratory. GeoSoilEnviroCARS is supported by the National Science Foundation - Earth Sciences (EAR-1128799) and Department of Energy - GeoSciences (DE-FG02-94ER14466).
CHAPTER 1
2 1.1 Introduction
Modern volcanology explores all aspects of volcanic eruptions, and processes occurring on micron to kilometre scales. One of the most important micro-scale processes is the formation and development of bubbles in magmas, which can have a major effect on the explosivity and progress of volcanic eruptions (Hurwitz and Navon, 1994; Mangan and Sisson, 2000). The solubility of volatiles, the nucleation of bubbles and the efficiency of volatile transfer from melt to bubble control a magma’s degassing efficiency (Gardner et al., 1999). The nucleation, growth and coalescence of bubbles can lead to the subsequent fragmentation of the magmatic foam or the formation of deep-rooted permeable paths and so govern volcanic eruption styles (Giachetti et al., 2010). One branch of volcanology aims to interpret all bubble-related processes in order to constrain and understand the conditions under which a volcano could erupt violently and thus help monitor and diminish eruption hazards. Most studies focus on natural volcanic rock textures that contain information on the processes of degassing and crystallization (e.g. Cichy et al., 2011). Experimental petrology can also be used to explore these same processes, with the added benefit of controlling pressure, temperature and compositions. The goal is to create samples that mimic natural environments under known and narrow conditions and to combat textural overprinting in post-process samples. In melts, bubbles are displaced more easily than other phases (e.g. crystals), so textural overprinting is especially problematic in bubble related studies (e.g. Shea et al., 2010).
A bubble is defined as a droplet of one substance surrounded by another, usually a gas in a liquid (Clift et al., 1978). When, due to change in pressure and temperature
3 conditions, volatile solubility in magma decreases, supersaturation ensues, and the volatile components segregate into gas bubbles. Although natural systems contain many different volatile species, such as H2O, CO2, S, F, Cl, most studies have focused
on H2O since its concentration in magmas is several orders of magnitude greater than
that of other volatiles.
The focus of this research has been the experimental formation of H2O gas
bubbles within magmas of andesitic composition, in order to study their interactions with crystals (pre-existing or newly formed) of different compositions. Interactions here encompass heterogeneous nucleation (nucleation on a pre-existing surface) of bubble on crystals, heterogeneous nucleation of crystals on bubbles, their detachment and attachment.
4 1.2 Problem: What is the influence of crystals on bubbles in magmas?
1.2.1 Bubble nucleation
Bubble nucleation is strongly dependent on the content of volatiles in the melt, the decompression rate, temperature and surface tension (Hirth et al., 1970; Shea, 2017 and references therein). Henceforth, I will restrict discussion to the case of water vapour bubbles in magmas, as this is the focus of this thesis. Classical nucleation theory states that because of local fluctuations in the concentration of molecular water in the melt, small clusters (critical sized nuclei) of water molecules form, which can grow or shrink depending on the addition or loss of new molecules by diffusion (Volmer and Webber, 1926; Blander and Katz, 1975). Once a critical nucleus has formed, the addition of water causes a lowering of its free energy with respect to the surrounding melt - a spherical shape of the critical nucleus is assumed as it would represent the minimum amount of energy needed for the formation of the interface (Dunning, 1969; Landau and Lifshitz, 1980; Hurwitz and Navon, 1994).
Bubbles can nucleate in two different ways: homogeneous nucleation, which occurs completely within the melt and requires higher degrees of volatile supersaturation, and heterogeneous nucleation, nucleation on a crystal surface, which requires lower volatile supersaturations (Blander and Katz, 1975; Gardner, 2007; Hurwitz and Navon, 1994).
For homogeneous nucleation at constant temperature and volume, the Helmholtz free energy (ΔF) required to form a critically sized spherical nucleus is (Equation 1, Hirth et al., 1970; Hurwitz and Navon, 1994; Navon and Lyakhovsky, 1998):
5 ΔF = 16π𝜎3
3Δ𝑝𝑠𝑎𝑡2 (1),
where σ is the surface energy and Δpsat is the supersaturation pressure. Helmholtz free
energy is used instead of Gibbs free energy, as the system is not at constant pressure (Hirth et al., 1970). The critical nucleus size cannot be described in terms of the Gibbs free energy because a reversible constant pressure path can’t be constructed, i.e. the final state cannot be achieved from the initial state under constant pressure (for a detailed discussion see Hirth et al., 1970). The supersaturation pressure is the difference between the internal pressure within the bubble (vapour) nucleus and the pressure of the surrounding melt (Hurwitz and Navon, 1994) and is obtained from the Laplace equation (Navon and Lyakhovsky, 1998). The internal bubble pressure is always greater than the melt pressure and the two are related through Henry’s constant to the difference between the actual water content of the supersaturated melt and the equilibrium solubility at the melt pressure (Navon and Lyakhovsky, 1998). In reality, the decompression is often equated with the supersaturation pressure for practicality, as during decompression the internal bubble pressure stays the same and the melt pressure decreases (Hurwitz and Navon, 1994).
For heterogeneous nucleation, the energy is (Equations 2-4, Landau and Lifshitz, 1980; Hurwitz and Navon, 1994; Adamson and Gast, 1997; Navon and Lyakhovsky, 1998): ΔF = 16π𝜎𝐿𝑉 3 3Δ𝑝2 × 𝛷 (2), 𝛷 = (2−cos 𝜃)× (1+cos 𝜃)2 4 (3), cos 𝜃 = 𝜎𝑆𝑉− 𝜎𝑆𝐿 𝜎𝐿𝑉 (4),
6 where Φ is a geometrical factor, θ the outer contact angle, 𝜎𝑆𝑉 = surface energy between the solid (crystal) and the vapour (bubble), 𝜎𝑆𝐿 = surface energy between the solid and
the liquid (melt), and 𝜎𝐿𝑉 = surface energy between the liquid and the vapour. Since ΔF ~ 1/(Δp)2, a greater degree of supersaturation (greater amount of a volatile
compound that becomes available to form bubbles) will reduce the amount of energy needed and thus enable easier nucleation and more bubbles.
Surface tension (or surface energy or interfacial energy or free energy per unit area, Adamson and Gast, 1997) is cubed in Equations 1 and 2 and so it can influence ΔF. The total surface energy of a bubble is smallest as a combination of three surface energies, between melt, gas and crystal surface energies, i.e., when there is a contact line between melt-bubble-crystal (stemming from Young’s relation, expanded in Adamson and Gast, 1997). Presence of a crystal-melt interface will cause the needed energy for bubble nucleation to decrease by a geometrical factor Φ (Equation 3) due to a decrease in surface energy (Landau and Lifshitz, 1980). When the geometrical factor is present, regardless of the crystal surface type (i.e., the values of the three surface energies), it follows that heterogeneous bubble nucleation on any surface/crystal will be energetically favourable over homogeneous bubble nucleation.
As heterogeneous bubble nucleation necessitates phase surfaces, an important constraint on the nucleation style is the presence or absence of crystals in the melt. Crystals represent regions of heterogeneity in the magma and crystal features, such as composition, crystal lattice type, morphology, surface energy of their faces and defects in structure (tips, cracks, cavities, impurities or any mechanical damage) are important parameters that could influence their interactions with bubbles. Imperfections on a crystal surface are the most efficient nucleation sites because they are poorly wetted by
7 the melt and have the greatest tendency to entrap gas (Cole, 1974). Crystal defects promote surface roughness, in turn promoting heterogeneous bubble nucleation (Volmer, 1939; Zanotto and Fokin, 2003). However, not all crystals are alike: some are regarded as efficient nucleation sites and their presence or absence can influence bubble nucleation type, whereas others are commonly regarded as inefficient and hence unfavorable for bubble formation (Hurwitz and Navon, 1994).
Hurwitz and Navon (1994) and Gardner and Denis (2004) have considered the relations between the chemical composition of minerals, their crystal morphology and surface properties, and how these can affect heterogeneous bubble nucleation. Although heterogeneous bubble nucleation is always easier than homogeneous nucleation, crystals of different minerals are not equally efficient as bubble nucleation sites. Each mineral is defined by its composition and geometry of crystal lattice, and thus each has a different surface energy value. The efficiency in bubble nucleation arises from the crystals’ ability to be easily wetted by a vapour phase, i.e., to form a large dihedral contact angle (Figure 2.1) between the bubble and itself (the wetting angle, Hurwitz and Navon, 1994). The surface energy value (σSV) is reflected in the
outer contact angle – the lower the surface energy the larger the outer contact angle, and along with crystal morphology is the controlling parameter for a minerals’ bubble nucleation efficiency (Hurwitz and Navon, 1994). Due to sparse studies on the subject, the true values of surface energies between crystals and bubbles (σSV) remain mostly
unknown.
The discriminant outer contact angle value was set to 68° by Blander and Katz (1975) based on their formulation of the heterogeneous bubble nucleation rate:
8 𝐽 = 𝑁 2 3𝑆 [2 𝜎𝐿𝑉 𝜋𝑚𝐵𝐹] 1 2 exp [ −16𝜋𝜎𝐿𝑉3𝐹 3𝑘𝑇 (𝑃𝑉−𝑃𝐿)2] (5), 𝑆 ≡ 1−𝑚 2 (6), 𝐹 ≡ 2−3𝑚+𝑚3 4 (7), 𝑚 = − cos 𝜃 = 𝜎𝑆𝐿− 𝜎𝑆𝑉 𝜎𝐿𝑉 (8),
where J is the bubble nucleation rate, N is the bubble number, S, m and F are geometric factors, B is a factor, k is the Boltzmann constant, T is temperature, σ is the surface energy and θ is the outer bubble-particle contact angle. In Equation 5, the pre-exponential term relates to kinetic factors while the pre-exponential term to thermodynamic factors. In Equations 5 and 7, factor F corresponds to the geometry factor φ in Equation 2 from Hurwitz and Navon (1994). Blander and Katz have set their F value for higher heterogeneous bubble nucleation probability as < 77, yielding a θ > 68°, because at these values the exponential term makes up the difference in the preexponential kinetic factors (Blander and Katz, 1975). This leads to the following: if the outer contact angle is < 68°, the crystal is poorly wetted by the bubble and well wetted by the melt, and the reverse if the outer contact angle is > 68° (Blander and Katz, 1975).
Hurwitz and Navon (1994) observed in their experiments that Fe-Ti oxides were the most efficient crystals at heterogeneous bubble nucleation with 50-60% of them having bubbles at decompressions Δpdec = 5 MPa, 70-90% at Δpdec = 5-10 MPa and
over 90% at Δpdec = 30 MPa in under 5 seconds. This was attributed to their low σSV
and rough surface with many submicroscopic (not observed) 90º angles. Biotite and zircon crystals were deemed less efficient because the outer contact angles between
9 them and bubbles (measured in 2D) were > 90º and < 40º, respectively (Hurwitz and Navon, 1994).
In the studies of Hurwitz and Navon (1994) and Gardner and Denis (2004) feldspars and quartz were never wetted (bubbles were not found on their surfaces but in their vicinity). Plagioclase proved to be inefficient at bubble nucleation, even at Δpdec
= 150 MPa, due to its very high σSV (Gardner and Denis, 2004), much higher than for
magnetite and hematite, and very low wetting angle < 20º (Hurwitz and Navon, 1994). Gualda and Anderson (2007) were able to measure outer contact angles in 2D at different minerals and confirmed this: for magnetite is θ ≈ 45° - 50°, and for plagioclase is θ ≈ 5° - 25°.
The inefficiency of silicate crystals was attributed to their compositional similarity to silicate melts. The energy at an interface separating crystals and melt is dependent on the structure and the type of bonding of each phase. If the structure and bonding are similar, as with a silicate mineral in a silicate melt, the ionic charge at their interface is low, hence the interfacial energy is low, and silicates are well wetted by silicate melts. If there is a compositional and bonding difference, as with an oxide mineral in a silicate melt, the ionic charge at the interface is high, the interfacial energy is high, so oxides are poorly wetted by silicate melts (Adamson and Gast, 1997, their Chapter 10). In turn, good wettability of a crystal by a melt leads to poor wettability of the crystal by a bubble, and vice versa.
The literature overview presented above on oxide efficiency at heterogeneous bubble nucleation and inefficiency of silicate crystals was the basis of heterogeneous bubble nucleation studies in the past several decades. Bubbles on silicate crystals have however been reported but not considered significant (e.g. Figure 4 in Hurwitz and
10 Navon, 1994, shows a biotite completely covered in bubbles with an outer contact angle > 90°). Additionally, as oxides are commonly microlites in experiments, they can nucleate only a small number of bubbles on their surfaces. Thus, although there may be many oxide microlites in silicate magmas (107 cm-3 vs. ≤ 1 cm-3 of silicate phenocryst, Mangan and Sisson, 2000) they still do not seem to account for the bubble numbers recorded in samples (Mangan and Sisson, 2000; Mourtada-Bonnefoi and Laporte, 2004), leading to several suggested solutions.
Gardner and Denis (2004) suggested that homogeneous nucleation is only a variety of heterogeneous nucleation but takes place on submicroscopic crystals. This case is hard to argue because these particles cannot be observed directly and so cannot be proven to exist. Mourtada-Bonnefoi and Laporte (2004) suggested that if two populations of bubbles are observed, one could be the result of a homogeneous nucleation event at high supersaturation pressure deep in the conduit, and the other the result of a subsequent heterogeneous nucleation event at a shallower level due to a significant increase in decompression (Δpdec, Jaupart, 1996) or due to extensive (oxide)
microlite crystallization (Hurwitz and Navon, 1994 – a sudden increase in favourable bubble nucleation sites was suggested to prompt an additional bubble nucleation event). Navon et al. (1998) previously suggested that the second nucleation event could be homogeneous (independently of the nature of the first one) if the pre-existing bubbles are far away from each other and the magma between them becomes supersaturated. Gardner et al. (1999) however state, that only one nucleation event is possible and that if more than one population of bubbles is observed, it is due to bubble coalescence or inheritance of bubbles from a different system.
11 A summary of experimental conditions used to obtain the above outlined interpretations is in presented in Table 1.1. These studies have all examined post-process samples and tried to explain the final, observed textures. Bubble textures are very easily overprinted, and their interpretation is challenging as the initial processes can only be inferred.
12 Table 1.1: Summary of several experimental studies on bubble nucleation. dec. refers to decompression, HEN refers to heterogeneous bubble nucleation. ✓ indicates bubbles present on crystal surfaces, x indicates no bubbles on crystal surfaces, ? indicates not specified.
reference composition Δpdec (MPa) crystal crystal attribute bubbles comment
Fiege et al. (2014) andesite 70-400 / / in melt homogeneous nucleation ≥ 5 Fe-Ti oxides ✓ biotite ✓ zircon ✓ apatite ✓ feldspar x quartz x < 20 ? HEN on dissolved crystals > 60 in melt homogeneous nucleation oxide microlites plagioclase microlites 150 in melt homogeneous nucleation 31 fringe bubbles 50-70 hematite crystallized ✓
60 plagioclase crystallized x concluded σplag-bub >> σox-bub
Mourtada-Bonnefoi
and Laporte (2004) rhyolite 150-200 / / in melt
homogeneous nucleation
< 5 oxides ✓
< 25 cryptic sites ✓ HEN on dissolved crystals 120-150 / / in melt homogeneous nucleation magnetite crystallized ✓ hematite crystallized ✓ plagioclase crystallized x > 100 / / in melt homogeneous nucleation 63-69 hematite crystallized ✓ feldspar x magnetite ✓ pyroxene ?
Larsen (2008) K-phonolite 45-50 clinopyroxene present in starting
material ✓
nucleation type not specified present in starting
material / /
Mangan et al. (2004)b rhyolite
Mangan and Sisson (2005), Mangan et al.
(2004)a
dacite 35 Mangan and Sisson
(2000) rhyolite rhyolite rhyolite 20-90 rhyolite not specified Hurwitz and Navon
(1994)
Cluzel et al. (2008) Gardner and Denis
(2004) Gardner et al. (2000) Gardner (2007) Gardner et al. (1999) unspecified on which microlites 10-50 crystallized rhyolite on microlites ? ? 30 50-134 present in starting material rhyolite bubbles in crystal vicinity rhyolite
13 1.3 Problem: difficulties in correctly interpreting interactions from post-process samples
1.3.1 Change of bubble-crystal contact angle
In the current literature regarding bubble-crystal contact angles within melts, only static contact angle values are reported. This is not surprising, as only post-process textures are available for observation. In contrast, fluid dynamics research of vapour bubbles in contact with particle surfaces within aqueous liquids allows for much easier dynamic observations. One of the results of these observations is that the contact angle is not a static property of a bubble-particle assemblage, but a dynamic one subject to change. Adamson and Gast (1997) already noted that: the contact angle cannot be viewed as simply a static quantity, but the reason for the contact angle change was well summarized by Cattide et al. (2008) with the following equation:
𝑉 (𝜌𝑓− 𝜌𝑔)𝑔 + 𝜋𝐷02
4 [𝑝𝑔 − (𝜌𝑓𝑔𝐻)]𝑝 = 𝜋𝐷0𝜎 sin 𝜃0 + ∫ 𝑘 𝑇𝑒,𝑙𝑛 𝑑𝑆 (9),
where V is the bubble volume, ρ is density (suffixes f and g refer to fluid and gas, respectively), g is the gravitational acceleration, D0 is the diameter of the dry area
around the bubble, H is the bubble height, σ is the surface tension, θ0 is the outer
contact angle, k is the unit vector of the z component (perpendicular to the particle’s surface), Te is the Maxwell stress tensor, n is the normal tangent unit vector, S is the
area the bubble occupies on a surface.
Equation 9 shows, that in order to keep the buoyancy force, internal bubble overpressure and surface tension forces in balance during bubble growth, the contact angle must change (Cattide et al., 2008). In geological systems it is not yet possible to examine bubble-particle relations in such detail.
14 1.3.2 Attachment of bubbles to crystals
Bubble – crystal aggregates can form not only through heterogeneous nucleation of bubbles on crystals (or vice versa) but also from their mutual attachment. The driving force of attachment is the same as for heterogeneous nucleation, lowering of the total surface energy. However, certain minerals will form crystals that are more favourable to bubble attachment (Gualda and Ghiorso, 2007). Here I consider the attachment of smaller bubbles to larger crystals, but the same principle should hold for small crystals attaching to a larger bubble (Gualda and Anderson, 2007).
The attachment energy is defined as the total change in surface energy (Δσ) from the fully separated state and the fully attached state of bubbles and crystals (Gualda and Ghiorso, 2007). For attachment to be thermodynamically feasible, the bulk energy of the aggregate (bubble and crystal fully attached) must be lower than when bubble and crystal were fully separated. The total change in surface energy is always ≤ 0, meaning that bubble-crystal attachment is always favoured thermodynamically regardless of the value of the outer contact angle. Once bubbles are attached, the larger the outer contact angle (i.e. the flatter the bubble), the stronger the attachment and the harder it is for them to subsequently detach.
1.3.3 Detachment of bubbles from crystals
The process of bubbles detaching from a surface is readily observable in everyday life (e.g. when water boils in a kettle) and is the focus of many industrial processes. However, bubble detachment is scarcely mentioned in volcanology. Mangan and Sisson (2000) observed detachment of bubbles at very low decompression rates, but from the walls of the experiment capsules, not from crystals. Gualda and Ghiorso
15 (2007) stated that bubbles would detach once a critical bubble radius is reached. A bubble that nucleated heterogeneously on a crystal grows with time, and as it grows its radius increases and the contact angle could potentially change, due to the changes in free energy if the bubble, melt and crystal are not in equilibrium (Adamson and Gast, 1997). It is inferred from the work of Gualda and Ghiorso (2007) that an increase in outer contact angle value indicates a stronger attachment, whilst a decrease in outer contact angle value means detachment is approaching. However, a change in contact angle is impossible to observe through the study of post-process textures. The potential process of bubbles detaching from a heterogeneous nucleation crystal site is interesting as the site would then be vacated and a new bubble could nucleate. This cycle of repeating bubble nucleation and detachment would lead to a large increase in crystal efficiency at bubble nucleation.
1.3.4 Buoyancy of bubble-crystal pairs
Crystals and bubbles are generally not static in magmas. Bubbles are less dense than the melt and negatively buoyant, so they rise (note that due to the formulation of particle settling velocity of Sparks et al., 1984, positive buoyancy represents sinking and negative buoyancy represents floating; this is adopted throughout the thesis). Most crystals are denser than the melt and sink. Some authors considered the rise of bubbles negligible due to their small size and thus not important in conduits prior to the onset of fragmentation (e.g. Proussevitch and Sahagian, 2005), but Gualda and Anderson (2007) argued that it is precisely bubble migration that causes mass and heat transport. Since thermal convection is the transfer of heat associated with the relocation of matter,
16 the migration of bubbles along with crystals influences the thermal and compositional history of melts (Gualda and Ghiorso, 2007).
If bubbles and crystals attach, they can slow each other’s movements or even become neutrally buoyant. Along with density, the difference in size of bubbles and crystals has a large effect on buoyancy. If a single bubble attaches to a single crystal of the same radius, they would still sink (as water vapour bubbles have a lower density then solid crystals). In order for bubble-crystal aggregates to be neutrally buoyant, 𝐹𝑐𝑟𝑦𝑠𝑡𝑎𝑙𝑏𝑢𝑜𝑦𝑎𝑛𝑐𝑦 and 𝐹𝑏𝑢𝑏𝑏𝑙𝑒𝑏𝑢𝑜𝑦𝑎𝑛𝑐𝑦 must be of equal but of opposite value. It is critical that bubble-crystal aggregates do not detach before becoming neutrally buoyant. The critical rbubble for detachment is (Equation 10, modified from Gualda and Ghiorso,
2007): 𝑟𝑏𝑢𝑏𝑏𝑙𝑒𝑐𝑟𝑖𝑡𝑖𝑐𝑎𝑙 = √−3 𝜎𝑉𝐿 4 𝑔 𝛥𝜌 2 × sin(180° − 𝜃) × √2−3 cos(180°−𝜃)+ 𝑐𝑜𝑠4 3(180°−𝜃) 6 (10),
where g is the gravitational constant, σVL is the surface tension between a bubble
(vapour) and the melt (liquid), Δρ is the density difference between the bubble and the melt and θ is the outer contact angle.
17 1.4 Hypothesis
The hypotheses explored in this thesis are:
1) Oxides are not the only favourable crystals for heterogeneous bubble nucleation: As heterogeneous bubble nucleation is always energetically favoured over homogeneous bubble nucleation, and bubbles are reported in contact with silicate crystals, why are they disregarded as bubble nucleation sites? 2) Bubble walls may act as nucleation sites for crystals:
Based on energy consideration, the presence of a pre-existing bubble-melt interface could facilitate the crystallization of mineral species.
3) Bubble-crystal contact angles may change with time:
Bubble growth leads to a change in bubble-crystal contact area, so a change in contact angle could be present as well. If the change in contact angle could be observed (increase or decrease) information on bubble-crystal wetting could be obtained.
The current theories, reviewed in previous subchapters, are too restrictive and due to the ease of bubble displacement and observations conducted in 2D, possibly based on erroneous assumptions, especially for heterogeneous bubble nucleation. A possible reason for such conclusions could be the few measurements of contact angles through which wettability is examined, and the measurement of these contact angles in 2D. A bubble with a small outer contact angle with a crystal (e.g. as is between bubbles and plagioclase crystals) will only be observed in contact with that crystal if the random 2D plane crosses the center of the bubble. A 2D plane of any other orientation will
18 show such a bubble and crystal not in contact. Thus, examining samples in 3D is much more beneficial and accurate.
Bubbles can grow with time. As a result, in the case of bubbles on crystals, their contact angle could change. The contact angle, representing the bubble-crystal surface energy, is a key parameter by which the bubble’s preference for heterogeneous nucleation, attachment and critical size for detachment are examined.
1.5 Objectives
The crystals and bubbles that are present in many magmatic systems have been studied thoroughly, but for the most part separately. Very few papers exist that consider their possible interactions (e.g. Gualda and Ghiorso, 2007; Belien et al., 2010). The specific focus of this research is to bridge this gap by exploring interactions between these important components. Additionally, an andesitic melt composition was chosen to contrast with the existing mostly rhyolitic data (Table 1.1).
The objectives of this research are: 1) to determine if silicates can act as sites for nucleation of water vapour bubbles in andesite magma, 2) to determine if bubble walls can act as nucleation sites for crystals such as oxides, 3) to see how bubble-crystal attachment and detachment could be detected from post-process samples.
19 1.6 Methodology
In order to study bubbles, crystals and infer their interactions, a volatile-saturated andesitic melt was synthesized in a high pressure – high temperature piston-cylinder apparatus (Boyd and England, 1960). Piston-piston-cylinders allow rapid heating and cooling of the sample, giving reliable results in the temperature and pressure ranges of 800 ºC – 2200 ºC and 100 MPa – 5 GPa, respectively (Hirschmann et al., 2008 and references therein). Bubble nucleation and growth experiments were conducted at high pressure and high temperature conditions within melts (not glasses). After decompressing and quenching the samples to room pressure and temperature, the generated textures were observed in glasses. Bubbles were generated at HPHT by crossing the H2O pressure-temperature solubility curve through depressurisation. One
of the most important aspects of this research is that it generated experimental charges that were imaged first in 3D, and afterwards, if necessary, in 2D, which brought both benefits and restrictions. Although much information on bubble nucleation was obtained from the 3D and 2D images, the early stages of the process were not accessible as the samples are still post-process. To overcome this issue, 4D in situ X-ray tomography methods were used to observe bubble nucleation and development during sample heating at ambient pressures.
1.6.1 High pressure and high temperature sample synthesis
The synthesis of experimental samples at high-pressure and high-temperature (HPHT) was conducted in a piston-cylinder apparatus at McGill University. HPHT piston-cylinder experiments were used to synthesize samples for in situ heating
20 experiments and to synthesize samples with macroscopic silicate crystals. For the specific piston-cylinder apparatus and assembly type used, the pressure correction between the nominal and real pressure is 50 MPa, and the friction correction is ± 25 MPa (Baker, 2004).
The pressure and temperature are raised until the sample is undersaturated in volatiles in order to dissolve all the volatiles present in the sample. The samples are held at those conditions for one hour to achieve sample homogenization, after which they are first decompressed at a chosen rate to induce supersaturation and bubble nucleation. After staying at this lower pressure for some time, they are quenched. The exact pressure and temperature parameters of each step of the experiment depend on the sample composition and volatile content. These parameters can be determined using volatile solubility models, such as Papale et al. (2006).
Most of the previous studies on bubble nucleation (Table 1.1), were performed on hydrated rhyolites, with 5 – 11 wt.% H2O at 50-250 MPa and 750 – 900 ºC (e.g.
Hurwitz and Navon, 1994; Gardner et al., 1999; Gardner et al., 2000; Mangan and Sisson, 2000; Gardner and Denis, 2004; Mourtada-Bonnefoi and Laporte, 2004; Mangan et al., 2004a; Gardner, 2007; Cluzel et al., 2008) and a few were conducted on basalt at 150-1000 MPa and 1100 – 1250 ºC (e.g. Bai et al., 2008). My experimental samples consisted of glass made from rock powder of andesitic composition, seed silicate crystals (plagioclase, clinopyroxene and amphibole) and water added in an amount sufficient for volatile supersaturation at chosen HPHT conditions. The main differences between my degassing experiments (Chapter 3) and previous ones (Table 1.1) is the use of starting andesitic glass composition and the addition of crystals into the starting material. This was done to introduce macroscopic crystal surfaces, with the
21 aim of avoiding the following: complete silicate crystal dissolution, bubbles on cryptic sites meant to be produced by crystal dissolution and silicate microlite crystallization. If silicate crystals crystallized and bubbles nucleated in the same experimental charge, additional difficulties in interpretations would be introduced (which phase nucleated on which, if at all, and when, relatively one to the other).
One restriction of the 3D X-ray tomography that followed each experiment is that X-rays cannot penetrate the metal capsules that contain the samples, so these needed to be taken out of their confining capsules. Due to the bubbles present (an experimental goal), the samples were very fragile and as a rule fractured upon metal capsule removal, leading to uncertainties in original sample orientation.
1.6.2 3D imaging with X-ray tomography
1.6.2.1 Basics of X-ray tomography
The analysis of rock textures consists of measuring the numbers, sizes, shapes and orientations of different objects (Higgins, 2006). X-ray computed tomography is a non-destructive method that provides high-quality results in three dimensions. X-ray tomography is based on the absorption of X-rays when passing through a sample, which is transformed into a 3D image of the linear attenuation coefficient, µ (Baruchel et al., 2000).
The linear attenuation coefficient depends on the composition and density of the sample and the energy of the X-ray beam (Baruchel et al., 2000). However, the linear attenuation coefficient is independent of the mineral’s crystallographic orientation, so unless phase contrast mode is used (discussed is subsection 1.6.2.3)
X-22 ray tomography only produces phase maps – if objects with the same linear attenuation coefficient and cross-section (here crystals of the same composition) are in contact, they cannot be distinguished as individual objects (see Figure 2 in Baker et al., 2012).
After scanning, individual slices are reconstructed from the collected radiographs using appropriate software. The slices are closely spaced grey-scaled images and together they form a 3D volume. The basic unit of a 3D volume is a voxel, the 3D equivalent of a pixel.
There are several X-ray tomography methods, named on the resolution obtained (e.g. micro- or nano-) or the source of X-rays (conventional or synchrotron generated). Conventional X-ray tomography, sometimes referred to as benchtop tomography, is a readily available low-cost method, using a self-contained instrument. However, the X-ray beam is polychromatic, which leads to the production of beam-hardening artifacts (bright rims around objects) stemming from misleading recovery of µ (Baruchel et al., 2000). Synchrotron radiation can give monochromatic X-rays and tomography using this source provides far superior results: it was the primary analytical method used for this research. Nevertheless, I must stress the importance of benchtop tomography, since quickly obtaining lower-resolution 3D volumes in this research ensured that the most promising samples are already preselected for the synchrotron. Several other imaging techniques are implemented during scanning acquisition, such as frame averaging and random movement. The former with the aim to reduce the signal to noise ratio in the collected radiographs and the latter to reduce ring artifacts in the reconstructed images. The values chosen for each represent a compromise between scan quality and acquisition time.
23 1.6.2.2 Synchrotron radiation X-ray micro-tomography
Several synchrotron radiation properties contribute to its much higher image quality (Mobilio et al., 2015), compared to conventional benchtop tomography: i) near-parallel beam geometry, fast data acquisition, increased number of electrons, ii) a monochromatic beam that significantly reduces beam-hardening artifacts and gives high signal to noise ratio (both the parallel geometry and monochromaticity allow a more precise definition of object geometry), iii) very high beam intensity with X-ray energy higher than that of chemical bonds, and iv) a large sample to detector distance allowing different apparatus to be mounted around the sample, like furnaces (Baker et al., 2012).
The advantages of synchrotron radiation X-ray tomography presented above have allowed the acquisition of high-quality 3D volumes. The examination of these volumes has allowed an increased accuracy in interpreting bubble-crystal textures, as the uncertainties arising from observations from a randomly oriented 2D plane are eliminated. However, these 3D volumes still represent post-process samples from which bubble-crystal interactions need to be inferred.
1.6.2.3 Additional X-ray tomography experiments and methods
In order to overcome the problem of analyzing post-process samples, this research utilized in situ real time 4D synchrotron radiation X-ray micro-tomography experiments. Real time here indicates that the scan acquisition speed is faster than the speed of change of the imaged objects. The primary goal was to observe bubble-crystal interactions in real time, most importantly, heterogeneous bubble nucleation. A
laser-24 heated furnace was placed around the sample and in the path of the X-ray beam to provide localized and controlled heating the heating was achieved by using two class IV lasers and the temperature was measured with a pyrometer (Fife et al., 2012). Entire 3D sample volumes were collected each 0.5 s for 50 s using an ultra-fast continuous data acquisition end-station with a CMOS detector (GigaFRoST, Mokso et al., 2017). This allowed for the direct observation of heterogeneous bubble nucleation and changes in contact angles. The benefits of in situ observations cannot be overstated and the temporal resolution of 0.5 s achieved is unprecedented at this time.
The acquisition of 3D volumes has improved accuracy, and 4D experiments provided in situ observations, however, the problem of X-ray absorbance remains. The focus of the research are bubble-crystal interactions, and silicate crystals are of interest (especially plagioclase). Thus, it is imperative for them to be visible, which is challenging when they are embedded in a silicate glass, due to the similarities in the X-ray absorbance. To overcome the issue, propagation-based phase contract imaging was used. Usually, in absorption X-ray imaging (described so far) the contrast is generated by the absorption properties of the sample. Propagation-based phase contract imaging is a specific imaging mode, where the contrast is generated additionally by the interference between parts of the wave front that experience different phase shifts (Mobilio et al., 2015). The result is that interfaces of abrupt phase change, such as the surface of a crystal, are more visible. This method already proved very useful for the imaging of feldspar crystals in a glass matrix (Polacci et al., 2010).
During X-ray tomography imaging at the Swiss Light Source, a phase retrieval algorithm was applied to sample reconstruction. It is important to distinguish that phase contrast imaging is an imaging mode, whereas phase retrieval is a set of algorithms
25 applied when the 3D volume is reconstructed. More specifically, phase retrieval is a method for quantitative phase extraction using a single propagation-induced phase contrast image taken using point-projection X-ray microscopy (Paganin et al., 2002). The main benefit for this research is the additional enhancement of silicate crystal borders.
X-ray tomography and 3D image analysis were used to observe bubble-crystal interactions at sub-second resolutions in 4D experiments and to examine post-process samples (either post-heating or post-decompression) in 3D to aid in correct bubble-crystal relation interpretation. Both HPHT piston-cylinder experiment and 3D imaging and analysis tested all three hypotheses (the role of silicate crystals in bubble nucleation, the nucleation of crystals on bubble walls and the change of bubble-crystal contact angle).
1.6.3 Analysis of reconstructed 3D sample volumes
Once the 3D reconstructed volumes are obtained, there are several steps before textural and morphological characteristics can be quantified. The first step is to select a volume of interest (VOI); a representative subvolume that is large enough to represent samples’ complexity and heterogeneity, but small enough not to overload the computer. For this research, the subvolume most commonly contained one crystal and bubbles associated with it, or vice versa. The sizes of subvolumes were not uniform in this research as they partly depend on the volumes of different crystals and bubbles. If the volumes were part of a 4D sequence, the same subvolume must be selected at each time step. Due to sample expansion during heating in 4D experiments, the chosen
26 subvolume did not maintain the same 3D coordinates in each time step. Bubbles proved easier to segment due to their large attenuation difference from the glass and crystals, but plagioclase crystals were difficult and time-consuming, even in samples where both phase contact imaging and phase retrieval algorithms were applied. Detectability of bubbles or crystals was set to 2 voxel edge lengths.
1.6.4 Scanning electron microscopy (SEM)
Three-dimensional analyses were complemented by more traditional two-dimensional analysis and scanning electron microscopy was used for semi-quantitative compositional measurements using back-scattered electrons. Scanning electron microscopy is a method with which plagioclase-melt interfaces can be readily observed and as such it complements 3D imaging where these interfaces are not easily detected. Additionally, SEM offered a comparison of what a conventional 2D method could provide to 3D XRT observations. This comparison highlighted how interpretations can be influenced by observing in 3D and not just 2D. No hypotheses were directly tested with this method. The scanned 3D volumes still influenced the sample preparation for SEM since the grinding and polishing was constrained to reach specific regions located in 3D volumes.