Open Archive TOULOUSE Archive Ouverte (OATAO)
OATAO is an open access repository that collects the work of Toulouse researchers and
makes it freely available over the web where possible.
This is an author-deposited version published in:
http://oatao.univ-toulouse.fr/
Eprints ID: 18122
To link to this article: DOI:
10.1016/j.actamat.2017.05.032
URL:
http://dx.doi.org/10.1016/j.actamat.2017.05.032
To cite this version:
Lacaze, Jacques and Bourdie, Jacques and
Castro-Román, Manuel Jesus A 2-D nucleation-growth model of
spheroidal graphite. (2017) Acta Materialia, vol. 134. n° 230-235.
ISSN 1359-6454
Any correspondence concerning this service should be sent to the repository
administrator:
[email protected]
A 2-D nucleation-growth model of spheroidal graphite
Jacques Lacaze
a,*, Jacques Bourdie
a,b, Manuel Jesus Castro-Rom!an
caCIRIMAT, Universit!e de Toulouse, ENSIACET, CS 44352, 31030 Toulouse Cedex 4, France bSaint-Gobain Pont-"a-Mousson, Les Longues Raies, BP 109, 54704 Pont-"a-Mousson Cedex, France
cCINVESTAV Saltillo, Av. Industria Metalúrgica 1062, Parque Industrial Saltillo-Ramos Arizpe, Ramos Arizpe, Coahuila, 25900, Mexico
Keywords: Spheroidal graphite Cast iron 2-D nucleation Lateral growth
a b s t r a c t
Analysis of recent experimental investigations, in particular by transmission electron microscopy, sug-gests spheroidal graphite grows by 2-D nucleation of new graphite layers at the outer surface of the nodules. These layers spread over the surface along the prismatic direction of graphite which is the energetically preferred growth direction of graphite when the apparent growth direction of the nodules is along the basal direction of graphite. 2-D nucleation-growth models first developed for precipitation of pure substances are then adapted to graphite growth from the liquid in spheroidal graphite cast irons. Lateral extension of the new graphite layers is controlled by carbon diffusion in the liquid. This allows describing quantitatively previous experimental results giving strong support to this approach.
1. Introduction
Graphite spheroids in spheroidal graphite cast iron are known to consist of piling up of graphite layers having their c axis oriented parallel to the spheroid radius. To accommodate for the change in orientation in the tangential direction, the spheroids appear to be divided in adjacent sectors which are easily observed by optical microscopy as illustrated inFig. 1. The change in orientation of the c axis at the boundary between two sectors may amount from 10 to several tens of degrees, while the orientation changes within sec-tors are more limited[1,2].
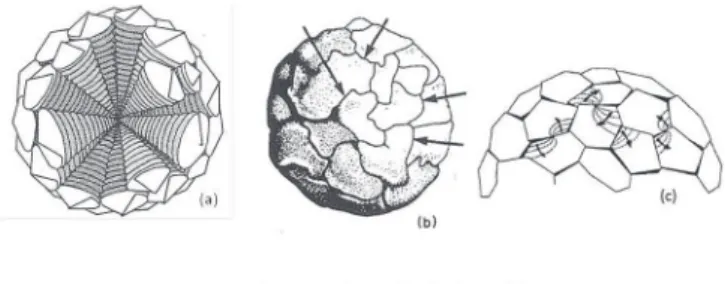
It has long been recognized that graphite layers within spher-oids are arranged in growth blocks which are elongated along the prismatic a direction of the graphite structure[3]. This would imply that graphite grows along the prismatic (tangential) direction during spheroidal growth even though the overall (apparent) growth direction is the radial one. Two types of models have been suggested in the past to account for this tangential growth: i) those based on screw dislocations[4]or cone-helix growth[5e7]; and ii) those based on the continuous growth of a graphite layer folding around the spheroid [8,9]. In the first type, tangential growth proceeds around screw dislocations or cones emanating from the
spheroid's centre (Fig. 2-a), giving features that would agree with the observation of sectors. However, transmission electron micro-scopy (TEM) observations have shown that the orientation of the c axis along a sector tilts at random and in either ways[10]which implies that continuous growth around a screw dislocation did not occur. The second type of models (Fig. 2-b) would hardly explain the formation of sectors as already stressed by Gruzleski [9]. However, a slight modification where nucleation of new layers proceeds at the step between two neighbouring sectors which was suggested by Double and Hellawell[11]would (Fig. 2-c).
There has been a renewed interest these last years for investi-gating the growth mechanism of spheroidal graphite[12e14]. Qing et al.[14]report observation of defects and dislocations in graphite, but do not seem to have observed long range ordered arrangements of these defects that would support the screw dislocation or the cone-helix mechanism. Amini and Abbaschian[12]observed both plate-like and spheroidal growth of graphite in Ni-C samples. They proposed a model for plate-like growth including thickening of the plates by 2-D nucleation and lateral extension of new graphite layers. To explain spheroidal growth, Amini and Abbaschian sug-gested a roughening transition at the graphite liquid interface which would have no reason for giving sectors as observed. Stefa-nescu et al.[13]proposed graphite spheroids build-up as so-called tad-pole dendrites. These dendrites emanate from the centre of the spheroids and are made of plate-like growth blocks stack upon each other, though not filling the space as does graphite in spheroids. Considering the model shown in Fig. 2-c and recent TEM
* Corresponding author.
E-mail addresses: [email protected] (J. Lacaze), Jacques.bourdie@ ensiacet.fr(J. Bourdie),[email protected](M.J. Castro-Rom!an). http://dx.doi.org/10.1016/j.actamat.2017.05.032
observations[2,15]suggest to extend to spheroids the 2-D nucle-ation and growth model developed by Amini and Abbaschian[12]
for plate-like growth of graphite from the liquid. Such an approach has been in fact already suggested based on a simple model [16] and is presented here in a much more formal and quantitative way.
2. 2-D nucleation
Let n be the number of 2-D nuclei per unit area of the graphite/ liquid interface. The nucleation rate Ja¼ _n ¼ dn=dt is given by
Ref.[17]: JazNA Vl m $ ! L $
D
T R$T$Tm "1=2 $ 3$b
$D 2$a0$exp ! "kD
g* B$T " (1)where NAis Avogadro's number, Vlmis the molar volume of the
liquid, L is the melting enthalpy and Tmthe melting temperature, R
the gas constant, T the current temperature and
D
T ¼ Tm-T is theundercooling,
b
corrects for structural factors[18], D is the diffusion coefficient in the liquid, a0is the atomic radius,D
g* is the excessenergy needed for nucleus formation and kBis Boltzmann's
con-stant.
b
is expected to take values close to 1 for simple molecules (atoms) and lower than 1 for complex molecules, it will be set to 1 in all the following calculations.In the above expression, L$
D
T=Tmis an estimate ofD
Gm, themolar free enthalpy change upon melting of the solid. As suggested by Turnbull and Fisher[19], the fact that graphite precipitates here
from an alloy and not from a pure melt may be accounted for by multiplying Jaby the atomic fraction of carbon, xC. Equation(1)may
thus be written: JazxC$ NA Vl m $ !j
D
Gmj R$T "1=2 $ 3$b
$D 2$a0$exp ! "kD
g* B$T " (2)Considering nuclei at the surface of a nodule form as discs of radius r and height h, the corresponding free energy change is given as:
D
g ¼ "p
$r2$h$ jD
GmjVgrm þ 2$
p
$r$s
e (3)where Vgrmis the graphite molar volume and
s
eis the step energy bylength.
Differentiating with respect to r gives the critical value r*:
r*¼ þ
s
e h$jD
Gmj#Vgrm (4) andD
g*¼ þp
h$s
2e jD
Gmj#Vgrm (5)Note that h cannot be determined by this procedure and is most generally considered as being the height of one single atom layer. According to Cahn et al.[18], the step energy per length
s
eis relatedto the surface energy
s
by:s
e¼s
$a$ ffiffix
p
(6)
where a is the height of one single atom layer and
x
is interface diffuseness which is 1 at most for a sharp interface and can be much smaller in practice[18].Using the expression for
s
eand setting h ¼ a, one obtains:r*¼ þ ffiffiffi
x
p $s
jD
Gmj#Vgr m (7)D
g*¼ þp
$a$x
$s
2 jD
Gmj#Vgr m (8)Calculations have been made with xC ¼ 0.175 which is the eutectic composition in the Fe-C system, a ¼ a0 ¼ 3.51$10"10m
(distance between basal planes), D ¼ 5$10"9m2
$s"1as previously selected[20],
s
¼ 1 J m"2for the prismatic planes (see the review of available data [21]), Vlm ¼ 7.5$10"6 m3$mol"1 and Vgrm ¼ 5.31$10"6m3$mol"1, T ¼ 1450 K, and |
D
Gm| ¼ 13.64$D
TJ$mol"1 [22], where
D
T is the undercooling with respect to thegraphite liquidus and is defined positive. One obtains:
r*¼0:4$ ffiffi
x
pD
T $10"6m (9)D
g*¼4:3$10"16$x
D
T J (10) Jaz1028$ðD
TÞ1=2$b
$exp ! "21500$x
D
T " m"2 $s"1 (11)Fig. 3shows r* and Javersus
D
T calculated forb
set to 1 andx
setto 0.1, 0.5 and 1. A value of
x
of about 0.1 would seem reasonable as it would give a few hundreds of nuclei per second on the outerFig. 1. Optical microscopy micrograph of spheroids showing sectors radiating from the centre.
Fig. 2. Schematic of growth of spheroidal graphite following various mechanisms: (a) screw-dislocation[5], (b) cabbage-leaf[9]and (c) 2-D nucleation and lateral extension of graphite layers[11].
surface of a nodule 10
m
m in radius growing at an undercooling of 50 K.3. Growth kinetics
For describing the effective growth of a faceted crystal along the direction of the facet plane, Cahn et al.[18]and Hillig[17] consid-ered two limits for 2-D nucleation and growth, when either nucleation or spreading of the layers is controlling.
In the first case, it is considered that a new layer nucleates only when the previous layer has spread over the corresponding crystal facet, this is the so-called MNG (mono-layer growth) process[23]. Following Tiller[24], we can ask the question: “What is the radius of disk, R, of a crystal facet which has unit probability that a new nucleus will form on top of the disk in the time
t
that it takes to the original disk to grow to its maximal extension?” Assuming a con-stant ledge velocity, one then has:Ja$ &
p
$R2 '$
t
¼ 1 (12)For the present case, we shall consider that the crystal facet is the outer surface of a sector. If a nodule of radius RGhas NSsimilar
sectors, then:
t
¼ NSJa$&4$
p
$R2G' (13)
Within this time interval
t
, NSnew nuclei are expected to spreadover the surface of the NSsectors, i.e. on a distance that scales as
LS¼ 2$RG$ ffiffiffiffiffiffiffiffiffiffiffiffi
p
=NSp
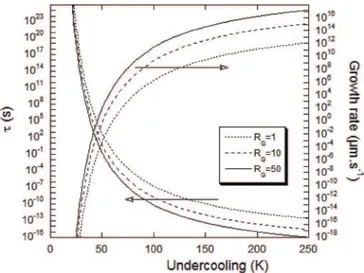
.Fig. 4illustrates the change of
t
versus under-cooling (with respect to graphite liquidus) forx
¼ 0.1, NS¼ 100 andRG set to 1, 10 and 50
m
m. When the nucleation rate becomesreasonablee at an undercooling larger than 50 K as seen above e the corresponding spreading time becomes so small that this model does not seem to be appropriate. This has been emphasized by plotting on the same graph the corresponding spreading
velocity, which becomes unphysically high for undercoolings higher than 50 K. This trend is certainly related to the fact that the far field diffusion of carbon is not accounted for by the model which was derived for precipitation in pure melts.
The other alternative is the so-called PNG (poly-layer growth) mechanism[23]that is controlled by the growth rate and not by the nucleation rate. The growth rate G is now given as[17]:
GPNG¼ a$
&
p
3$Ja$ðVlÞ2'1=3
(14)
where Vl is the spreading rate of the ledge and has been here
assumed constant. Other exponents and relations could be ob-tained when using different laws for spreading rate[23].
Fig. 3. 2-D nucleation rate and radius of the critical nuclei versus undercooling (with respect to graphite liquidus) for three values ofx.
Fig. 4. Evolution with undercooling of the time interval between nucleation events and of the corresponding spreading velocity for three spheroid radii RG(indicated in
If there is no constraint, Vlcan be expressed as its value for a
straight ledge V∞, which is according to Cahn et al.[18]:
V∞¼
D$j
D
Gmjh$R$T $
b
$&2 þx
"1=2 '(15)
Inserting this latter expression in Equation(14), one obtains for the PNG process with h ¼ a:
With the values already used, GPNGbecomes:
GPNGz0:05$ð
D
TÞ5=6$b
$&2 þx
"1=2 '2=3 $exp ! "7200$x
D
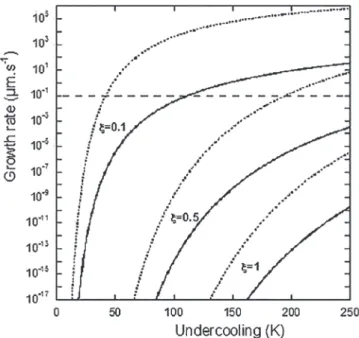
T " m$s"1 (17)Fig. 5shows with dotted lines the evolution of GPNGaccording to
equation(17)for
b
set to 1 andx
set to 0.1, 0.5 and 1. The horizontal interrupted line corresponds to the experimental thickening rate of graphite plates along their c direction as estimated by Amini and Abbaschian [12]. This value of 0.1m
m s"1 is obtained for anundercooling of 40 K at
x
¼ 0.1 and 200 K atx
¼ 0.5, both values being well within the reported experimental range[12]of under-cooling values with respect to graphite liquidus.For the same reason than for the MNG model, the PNG model is expected to predict too high growth rates. There is an alternative approach to express V∞which appears more convenient in the case
of alloys. Following Amini and Abbaschian[12], V∞ in the above
treatment could as well be estimated as the diffusion-controlled growth rate of a plate of thickness 2$
r
. The validity of such an approach has been discussed by Doherty[25]. Amini and Abba-schian made use of a Zener-type formulation which gives[26]:V∞¼ D k$ Vgram Vl m $ xl;0C " xiC xgraC " xiC ! $ 1
r
$ ! 1 "r
*r
" (18) where xl;0C, xiC and xgraC are the carbon mole fraction in the bulk
liquid, at the liquid graphite interface and in graphite respectively.
r
* is the critical curvature radius of the plate tip that would cancelthe composition difference (xl;0C"xiC). k is a constant of order unity, set to 1 by Amini and Abbaschian but to 2 by Hillert[26].
r
* will be here considered as the critical radius for homogeneous nucleation:r
*¼ þ 2$s
j
D
Gmj#Vgram(19)
Using the usual Zener's proposal, the plate grows at the maximum possible rate which corresponds to
r
¼ 2$r
*, so that for k set to 2: V∞¼ D 8$r
*$ Vgram Vlm $ xl;0C " xiC xgraC " xiC ! (20)According to the Fe-C phase diagram, xl;0C "xiCz
D
T/11900 whereD
T is the undercooling with respect to graphite liquidus close to the eutectic composition. With xgraC ¼ 1 and xiC approximated to theeutectic composition, i.e. xi
C¼ 0.175, and all other values as before,
V∞can be expressed as: V∞¼ 6:0$10
"8
$ð
D
TÞ2m$s"1 (21)At an undercooling of 50 K, this expression leads to a growth rate of 150
m
m s"1which is two orders of magnitude higher thanthe steady state value reported by Amini and Abbaschian[12]. In fact, these authors did introduce a value of 5
m
m for h* instead of the calculated value ofr
*, and this explains most of the discrepancy between the two estimates.Alternatively, the growth rate V∞of the plate could be
calcu-lated using the model developed by Trivedi[27]which relates the P!eclet number P ¼
r
$V∞=2$D, to the dimensionlesssupersatura-tion,
U
0¼ ðxl;0C " xiCÞ=ðxgraC " xiCÞ. With the values given above,
U
0¼ 10"4$D
T and is small enough for any reasonable undercooling that the approximate solution worked out by Bosze and Trivedi[28]may be used. According to this solution, one has:
r
*r
¼ 3 32$U
0 (22) and P ¼ 9 16$p
$ðU
0Þ2 (23)With further mathematical manipulations, Bosze and Trivedi arrived at: V∞¼ 9 8$
p
$ Dr
$ðU
*Þ 2 (24)Fig. 5. Overall growth rate of a graphite spheroid according to the PNG model as function of undercooling, for three values ofx. Dotted lines are according to equation (17)and solid lines to equation(29). The horizontal line corresponds to the experi-mental thickening rate of graphite plates estimated by Amini and Abbaschian[12].
GPNG¼
p
2$xC$ NA Vl m !1=3 $ !jD
Gmj R$T "5=6 $b
$&2 þx
"1=2 '2=3 $D$exp ! "3D
g* $kB$T " (16)where
U
*is given as:U
*¼U
0 1 "2 p$U
0"2$1p$ðU
0Þ2 (25)Bosze and Trivedi stressed the fact that the solution thus ob-tained is valid over a quite large range of supersaturation values. Here however, we can restrict ourselves to low supersaturation values for which
U
*zU
0. It is then of interest to compare the twoabove expressions (equations(20) and (24)) of the growth rate by expressing their ratio. Without considering the change in molar volume, this ratio writes:
VZener∞ VBosze∞ ¼ 8$
p
9$k$ 1U
0$ ! 1 "r
*r
" (26)This ratio scales as ð
U
0Þ"1indicating the Zener-type model canstrongly overestimate the growth rate in the present case and thus that equation (24) is certainly to be preferred. Inserting the expression of
r
* in the above final relation of Bosze and Trivedi gives: V∞¼ 27 256$p
$ Dr
*$ðU
0Þ 3 (27)With the same numerical values as before this writes:
V∞z2$10 "16
$ð
D
TÞ4m$s"1 (28)The overall growth rate G of a nodule of radius RGfrom the liquid
is now calculated according to the PNG model. After insertion of the appropriate values in equation(14), one obtains:
GPNG¼ 2:6$10"11$ð
D
TÞ17=6$ðb
Þ1=3$exp ! "7200$x
D
T " m$s"1 (29)The solid lines inFig. 5show the evolution of GPNGaccording to
equation(29)for
b
set to 1 andx
set to 0.1, 0.5 and 1 as before. As expected, the predicted values are much lower than those calcu-lated with equation(17)at any undercooling. Interestingly enough, it is seen that the GPNGvalue forx
¼ 0.1 levels out in the range of undercoolings of interest.4. Application
As a check of the appropriateness of the above approach, it was applied to previously reported results[16]. In these experiments, a sample (8 mm in diameter, 10 mm in height) of cast iron with 3.75 wt.% C and 2.7 wt.% Si was remelted in graphite crucibles by heating up to 1350'C. The cast iron had been spheroidized with a
slight over-treatment in magnesium for allowing short remelting. However, to avoid too large magnesium loss which would have hindered spheroidal growth during solidification, the samples were cooled immediately after reaching 1350'C. Two cooling rates were
used, 20'C/min (referred as “slow” cooling rate afterwards) or
350'C/min (referred as “high” cooling rate). Before introducing a
sample in the crucible, some commercial inoculant amounting to 0.2% of the weight of the sample was located at the bottom of the crucible.
After processing, the samples were sectioned along a vertical axial section and prepared for metallographic observations.Fig. 6
shows an example of the upper surface of one sample cooled at 20'C/min. Large spheroids are seen to have grown and floated
while the remaining of the sample consisted in a standard micro-structure of a spheroidized cast iron. The large spheroids are ex-pected to have nucleated at the bottom of the sample as soon as the metal started to cool from 1350'C and to have grown freely in the
liquid until the bulk of the material solidified as the eutectic tem-perature was reached. If an eutectic undercooling of 10e20'C is
considered, this latter temperature must have been about 1150'C.
Accordingly, the time for growth of the graphite precipitates from the liquid was about 34 s and 600 s for fast and slow cooling respectively.
The half-size of the five largest precipitates of the two samples was then measured for comparison with predicted spheroid radius. These measurements are reported inFig. 7as rectangles showing the scatter of the data.
At the start of cooling, the liquid is assumed saturated in carbon at a level corresponding to 1350'C. Then, during primary graphite
growth, its carbon content xl
Cdecreases. This must be accounted for
in the calculations by tracking the evolution of the undercooling with respect to graphite liquidus. At any time during cooling, the change dxl
Cof xlCis obtained from a carbon balance as:
Fig. 6. Upper part of the metallographic section of a sample cooled at 20'C/min.
Fig. 7. Time evolution of primary graphite spheroids in a melt cooled at a rate of 20'C/
dxl C¼ " Vl m Vgra m$x gra C " xlC 1 " ggra $dggra (30)
where ggraand dggraare the volume fraction of graphite and its derivative. One has:
dggra¼ 4$
p
$Ngra$ðRGÞ2$dRG (31)
in which Ngrais the number density of graphite spheroids.
At each time step, the value of
D
T is thus updated according to the new value of xlC. Owing to the very limited number of primary
spheroids that were observed at the top of the samples (Fig. 6), low values of Ngrawere considered, namely 0.01, 0.1 and 1 mm"3. The
calculated evolution with time of the spheroids radius is plotted in
Fig. 7. In the case of fast cooling, changing the nodule count within the range considered had no effect and all three curves are super-imposed. On the contrary, in the case of slow cooling, increasing the nodule count increases carbon pick up from the liquid and thus leads to a decrease of the final spheroids size. Comparison of the present calculations with experimental measurements shows a fair agreement when Ngrais between 0.1 and 1 mm"3.
5. Conclusion
Reviewing past and recent experimental information on sphe-roidal graphite growth in cast iron suggests it grows by continuous 2-D nucleation and lateral extension of graphite layers at the outer surface of the nodules. A model corresponding to such a schematic has been derived for graphite precipitation from the liquid using a classical 2-D nucleation law and various laws for lateral extension of the new steps. Amongst these latter, the description based on growth controlled by carbon diffusion in the liquid gives satisfac-tory predictions when compared to experimental observations. In these models, values for all physical parameters are from literature information but interface diffuseness. Future extension of this approach is sought for accounting for the effect of impurities on lateral extension of the growth steps following previous ap-proaches[29,30].
Acknowledgment
This research has been partly supported by Saint-Gobain Pont-"
a-Mousson. References
[1] K. Theuwissen, J. Lacaze, M. V!eron, L. Laffont, Nano-scale orientation mapping of graphite in cast irons, Mater. Charact. 95 (2014) 187e191.
[2] K. Theuwissen, J. Lacaze, L. Laffont, Structure of graphite precipitates in cast iron, Carbon 96 (2016) 1120e1128.
[3] R. Mitsche, G. Haensel, K. Maurer, H. Sch€affer, Recherches, par examen au microscope !electronique notamment, sur les formes d!eg!en!er!ees du graphite dans les fontes G.S, Fonderie 270 (1968) 367e382.
[4] M. Hillert, Y. Lindblom, The growth of nodular graphite, J. Iron Steel Inst. 148 (1954) 388e390.
[5] D.D. Double, A. Hellawell, Cone-helix growth forms of graphite, Acta Metal. 22
(1974) 481e487.
[6] Baihe Miao, Keming Fang, Weimin Bian, Guoxun Liu, On the microstructure of graphite spherulites in cast irons by TEM and HREM, Acta Metal. Mater. 38 (1990) 2167e2174.
[7] Baihe Miao, D.O. Northwood, Weimin Bian, Keming Fang, Minz Heng Fan, Structure and growth of platelets in graphite spherulites in cast iron, J. Mater. Sci. 29 (1994) 225e261.
[8] J.P. Sadocha, J.E. Gruzleski, The mechanism of graphite spheroid formation in pure Fe-C-Si alloys, in: B. Lux, I. Minkoff, F. Mollard (Eds.), The Metallurgy of Cast Iron, Georgi Publishing Company, St. Saphorin, 1975, pp. 443e456. [9] J.E. Gruzleski, On the growth of spherulitic graphite in nodular cast iron,
Carbon 13 (1975) 167e173.
[10] J. Lacaze, K. Theuwissen, L. Laffont, M. V!eron, Misorientations in spheroidal graphite: some new insights about spheroidal graphite growth in cast irons, IOP Conf. Ser. Mater. Sci. Eng. 117 (2016) 012024,http://dx.doi.org/10.1088/ 1757-899X/117/1/012024.
[11] D.D. Double, A. Hellawell, The nucleation and growth of graphite. The modi-fication of cast iron, Acta Metal. Mater. 43 (1995) 2435e2442.
[12] S. Amini, R. Abbaschian, Nucleation and growth kinetics of graphene layers from a molten phase, Carbon 51 (2013) 110e123,http://dx.doi.org/10.1016/ j.carbon.2012.08.019.
[13] D.M. Stefanescu, G. Alonso, P. Larranaga, E. De la Fuente, R. Suarez, On the crystallization of graphite from liquid iron-carbon-silicon melts, Acta Mater. 107 (2016) 102e126,http://dx.doi.org/10.1016/j.actamat.2016.01.047. [14] J. Qing, V.L. Richards, D.C. Van Aken, Growth stages and
hexagonal-rhombohedral structural arrangements in spheroidal graphite observed in ductile iron, Carbon 116 (2017) 456e469, http://dx.doi.org/10.1016/ j.carbon.2017.01.063.
[15] Dongdong Li, Ruixuan Tan, Jingxing Gao, Bingqiang Wei, Zheqiong Fan, Qizhong Huang, Kejian He, Comparison of pyrolitic graphite spheres from propylene with spheroidal graphite nodules in steel, Carbon 111 (2017) 428e438,http://dx.doi.org/10.1016/j.carbon.2016.10.018.
[16] R. Ghergu, L. Magnusson Åberg, J. Lacaze, A possible mechanism for the for-mation of exploded graphite in nodular cast irons, Mater. Sci. Forum 790e791 (2014) 435e440, http://dx.doi.org/10.4028/www.scientific.net/MSF.790-791.435.
[17] W.B. Hillig, A derivation of classical two-dimensional nucleation kinetics and the associated crystal growth laws, Acta Metall. 14 (1966) 1868e1869. [18] J.W. Cahn, W.B. Hillig, G.W. Sears, The molecular mechanism of solidification,
Acta Metall. 12 (1964) 1421e1439.
[19] D. Turnbull, J.C. Fisher, Rate of nucleation in condensed systems, J. Chem. Phys. 17 (1949) 71e73.
[20] J. Lacaze, G. Lesoult, M. Castro, Solidification of spheroidal graphite cast iron. Part II : numerical simulation, Acta Mater. 46 (1998) 997e1010.
[21] U. de la Torre, J. Lacaze, J. Sertucha, Chunky graphite formation in ductile cast irons: effect of silicon, carbon and rare earths, Int. J. Mater. Res. 107 (2016) 1041e1050,http://dx.doi.org/10.3139/146.111434.
[22] M. Hillert, V.V. Subba Rao, Grey and White Solidification of Cast Iron, The Institute of Metals, ISI P110, pp. 204e212.
[23] S.D. Peteves, R. Abbaschian, Growth kinetics of solid-liquid Ga interfaces: Part II. Theoretical, Metall. Trans. A 22A (1991) 1271e1286.
[24] W.A. Tiller, The Science of Crystallizatione Microscopic Interfacial Phenom-ena, Cambridge University Press, 1991, pp. 81.
[25] R.D. Doherty, B. Cantor, Computer modelling of ledge growth kinetics, in: H.I. Aaronson (Ed.), Solid-state Phase Transformations, Met. Soc. AIME, War-rendale, 1982, pp. 547e553; and R.D. Doherty, Diffusive phase trans-formations in the solid state, in: R.W. Cahn, P. Haasen (Eds.), Physical Metallurgy, Elsevier Science Publishers, 1983, pp. 933e1030.
[26] M. Hillert, The role of interfacial energy during solid state phase trans-formations, Jernkont. Ann. 141 (1957) 757e789.
[27] R. Trivedi, The role of interfacial free energy and interface kinetics during the growth of precipitate plates and needles, Metall. Trans. 1 (1970) 921e927. [28] W.P. Bosze, R. Trivedi, On the kinetic expression for the growth of precipitate
plates, Metall. Trans. 5 (1974) 511e512.
[29] N. Cabrera, D.A. Vermilyea, The growth of crystals from solution, in: R.H. Dorelus (Ed.), Growth and Perfection of Crystals, Int. Conf. On Crystal Growth, Wiley and Sons, 1958, pp. 393e410.
[30] N. Albon, J. Dunning, Growth of sucrose crystals: determination of edge en-ergy from the effect of added impurity on rate of step advance, Acta Cryst. 15 (1962) 474e476.