HAL Id: hal-02333511
https://hal.archives-ouvertes.fr/hal-02333511
Submitted on 25 Oct 2019HAL is a multi-disciplinary open access archive for the deposit and dissemination of sci-entific research documents, whether they are pub-lished or not. The documents may come from teaching and research institutions in France or abroad, or from public or private research centers.
L’archive ouverte pluridisciplinaire HAL, est destinée au dépôt et à la diffusion de documents scientifiques de niveau recherche, publiés ou non, émanant des établissements d’enseignement et de recherche français ou étrangers, des laboratoires publics ou privés.
Some paradoxical observations about spheroidal
graphite degeneracy
Jacques Lacaze, Jon Sertucha
To cite this version:
Jacques Lacaze, Jon Sertucha. Some paradoxical observations about spheroidal graphite degeneracy. China Foundry, 2018. �hal-02333511�
Some paradoxical observations about spheroidal graphite degeneracy
Jacques LACAZE1 and Jon SERTUCHA2
1 CIRIMAT, Université de Toulouse, BP 44362, F-31030 Toulouse, France
2 Investigación y Desarrollo de Procesos Metalúrgicos, IK4-Azterlan, Aliendalde auzunea 6, E-48200 Durango (Bizkaia), Spain
Abstract
Differential thermal analysis experiments have been performed on samples machined out from Y2-blocks cast with different high-silicon spheroidal graphite irons. Depending on magnesium, silicon, cerium and antimony content, the as-cast microstructure showed various levels of chunky graphite in the central part of the blocks. In contrast, the microstructure of the materials after remelting and resolidification during differential thermal analysis consisted of lamellar or compacted graphite. The formation of chunky graphite in the as-cast microstructure is rationalized using an index or silicon equivalent that has been recently suggested. The differences in the microstructures after differential thermal analysis are discussed in terms of available free magnesium. Emphasis is finally put on the striking differences in characteristic size of the microstructures made of compacted graphite as compared to lamellar graphite and chunky graphite. This leads to tentative conclusions about growth of compacted and chunky graphite which would be worthy of further experimental investigations.
Keywords: high-silicon spheroidal graphite iron, graphite degeneracy, compacted graphite, chunky graphite
Introduction
The control of graphite shape in spheroidal graphite cast irons is primarily achieved by limited additions of magnesium, though rare earths may also be added to sustain the spheroidization treatment. For avoiding fading of the spheroidization treatment, in particular when casting heavy-section parts, it could be tempting of over-treating the melt. However, it has been recognized since long that magnesium and rare earth over-treatment leads to spheroidal graphite degenerating in chunky graphite. Conversely, under-treatment in magnesium or rare earths is the most usual way of preparing melts for obtaining compacted graphite which may thus be seen as another type of spheroidal graphite degeneracy though a more appropriate way of thinking would consider it as "a balance between flake and nodular graphite" [1].
Except spheroidal graphite, all solidification forms of graphite in graphitic cast irons result from a coupled growth of graphite and austenite, see for example the review by Lacaze et al. [2]. This applies to lamellar, undercooled and coral graphite, and also to chunky and compacted graphite. In practice, it is known that chunky graphite is favoured by lengthy solidification times, high silicon levels and over-treatment in magnesium and cerium. Similarly, Subramanian et al. [3] rationalized
the processing route for obtaining compacted graphite by noting it relates to a given range of oxygen and cerium (or magnesium) activities. However, melt control for compacted graphite castings seems so difficult that the Sintercast process makes use of a complex thermal analysis procedure which has to be carried out on each ladle [4]. Furthermore, the knowledge of some of the process parameters that seem to effect graphite degeneracies such as chunky graphite and
compacted graphite does not give any hint on their precise growth mechanism. It is worth
reminding that lamellar, undercooled and coral graphite grow along the prismatic graphite direction (a direction), while chunky graphite grows along the basal direction (c direction) - as spheroidal graphite also does - and compacted graphite seems to show changes in growth direction.
As part of a study devoted to high-silicon spheroidal graphite cast irons [5], it appeared of interest to perform differential thermal analysis (DTA) on samples machined out from materials showing various amounts of chunky graphite. Indeed, such an analysis had been performed previously on a common SGI which showed DTA samples consisted of either spheroidal/compacted graphite or lamellar graphite after remelting and resolidification [6]. In the present work, as-cast and DTA microstructures of selected high-silicon spheroidal graphite cast irons are described, and results are then discussed to pave the way for a better understanding of graphite growth transition from
spheroidal to chunky or compacted shapes.
Experimental details
All experimental details for melt preparation have already been given [5]. Magnesium treatment was performed following the so-called sandwich method by transferring 50 kg of the prepared melt to a ladle where FeSiMg alloy (grain size 5–25 mm, Si = 46.60, Mg = 6.00, Ca = 0.96, Al = 0.71 and rare earth RE = 0.92, Fe balance, wt.%) had been positioned in an amount of 0.6 kg (1.2 wt.% of the batch weight) and then covered with steel scrap (grain size 5–15 mm). After skimming, the melt was cast in standard Y2 keel-blocks (EN-1563) which were manufactured with chemical bonded sand moulds. Each mould contained one cavity in which 14 g (0.20 wt.% of the total weight of the melt poured in the mould) of a commercial inoculant (grain size 0.2–0.5 mm, Si = 69.9, Al = 0.93, Ca = 1.38, Bi = 0.49, RE = 0.37 and Fe balance, wt.%) was added before pouring the melt. In this previous study, 31 alloys with silicon content from 3.88 to 9.12 wt.% were prepared. To ensure they were all of near-eutectic composition, the carbon content was accordingly adjusted. Four of these alloys have been selected for the present work whose compositions measured on the keel-blocks are listed in table 1. The alloys contained also 0.03−0.05 Cu, 0.04 Cr and 0.03−0.06 Ni (wt.%). Table 1 lists also the carbon equivalent of the alloys calculated as [7]:
CE = C + 0.31⋅Si − 0.027⋅Mn + 0.076⋅Cu + 0.33⋅P + 0.40⋅S
The as-cast microstructure was checked at the macroscopic scale for the presence of chunky
graphite and then a quantitative analysis was performed at the microscopic scale. Graphite particles were classified as class III, V and VI. While the latter two relate to spheroidal graphite, class III particles correspond here to chunky graphite. A number of particles could not be classified automatically, this was performed afterwards.
Samples for DTA were machined out from the central part of the keel-blocks, they had a diameter of 3.9 mm and a height of 4−5 mm. DTA analyses were carried out with a SETARAM SETSYS 16/18 apparatus. The runs consisted in heating and cooling at 10ºC/min from room temperature to 1250°C with an 1800 s hold at the highest temperature.
Table 1 – Composition of the alloys (wt.%), carbon equivalent CE (wt.%), ΩSi index, area fraction of compacted graphite (fCGHA ) and of spheroids of class V (fVA) and VI (fVIA) before DTA,
calculated eutectic temperature Teut (°C), and graphite shape after DTA.
Sample #4 #12 #14 #21 C 3.10 2.91 2.72 2.64 Si 4.45 5.04 5.55 6.11 Mn 0.21 0.18 0.20 0.18 S 0.012 0.010 0.010 0.006 Ti 0.020 0.019 0.010 0.013 Mg 0.040 0.035 0.033 0.046 Ce 0.0063 0.0057 0.0055 0.0063 La 0.0034 0.0031 0.0031 0.0040 Sb <0.0005 0.0036 0.0044 <0.0005 CE 4.49 4.48 4.45 4.54 Ω Ω Ω ΩSi 10.96 8.19 7.83 13.29 A CGH f 0.39 0.04 0.03 0.65 A V f 0.19 0.19 0.19 0.06 A VI f 0.42 0.77 0.79 0.29 Teut 1171.0 1171.3 1171.1 1170.3 Graphite type after DTA Spheroids +
compacted Lamellar Lamellar
Spheroids + compacted
Results
Results of area fraction of chunky graphite,fCGHA , and of spheroids, fVAand fVIA, are given in table 1. It is seen that the two alloys (#12 and #14) to which antimony was added show very little graphite degeneracy in the as-cast samples. On the contrary, a significant amount of chunky graphite is seen in alloy #4 and an even higher amount in alloy #21.
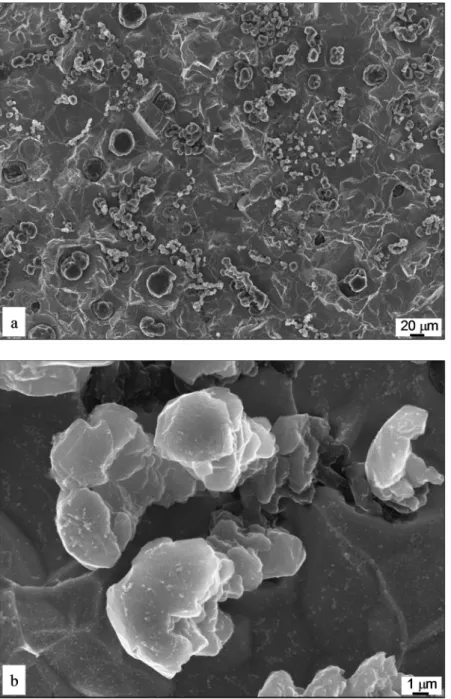
Figure 1-a shows a deep-etched section of casting #4 where spheroids and chunky graphite strings are easily recognized. Figure 1-b presents a view at higher enlargement of chunky graphite strings where the stacking of growth blocks elongated in the a direction is noticed. These blocks are piling up along the growth direction of the strings which is thus the c direction in the same way it is the overall growth direction of spheroidal graphite.
Figure 2 shows the solidification range of the DTA records upon cooling of the four selected alloys. It is clearly seen that these records may be classified according to the fact the alloys have antimony added (#12 and #14) or not (#4 and #21); namely, solidification kinetics appear significantly higher for the former than for the latter. The eutectic temperatures of the alloys as calculated using the Thermocalc software and the SSOL database are reported in table 1, they are all between 1170.3°C and 1171.3°C. Figure 2 thus shows that the solidification of all alloys starts at the eutectic
hypereutectic according to their CE, this would mean there was no significant delay for either austenite or graphite nucleation. Accordingly, the difference in shape between the two sets of curves relates to the growth kinetics of the eutectic, which appears more sluggish for alloys #4 and #21 than for alloys #12 and #14.
Figure 1 – Scanning electron microscopy micrographs of alloy #4 after deep etching: (a) general view and (b) detailed view of chunky graphite strings.
Figure 2 – DTA records of each of the four alloys upon cooling at 10ºC/min.
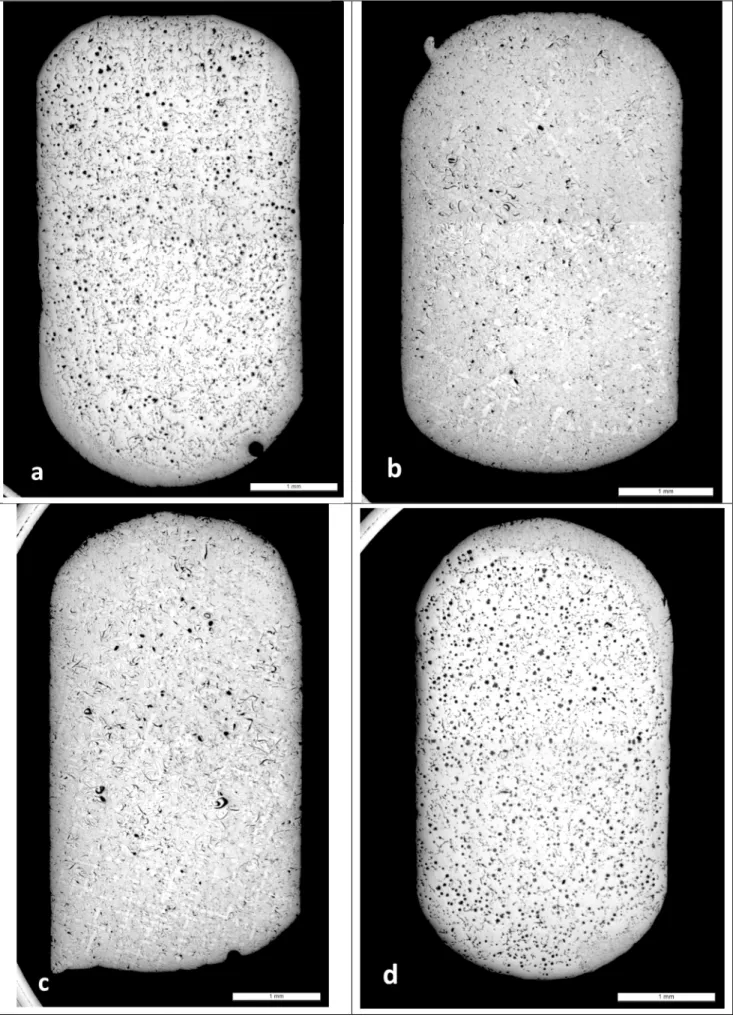
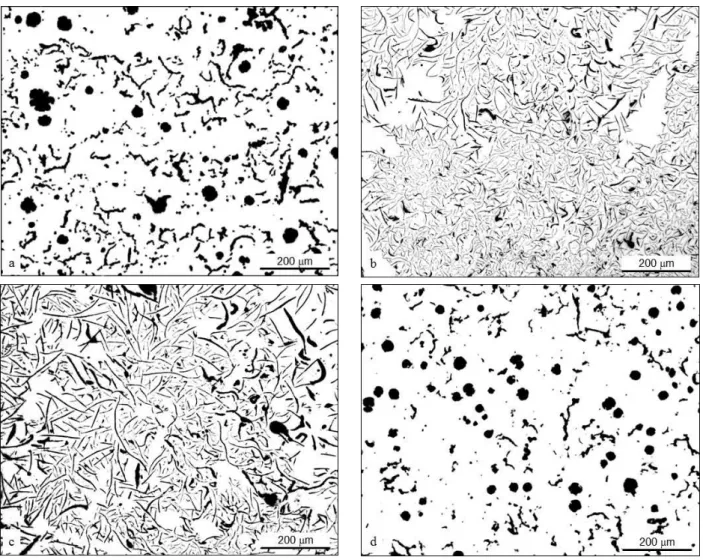
Figure 3 shows a diametrical section of each of the four DTA samples. Apart for small surface layers in the case of alloys #4 and #21, the microstructure appears homogeneous in each of these samples. As a matter of fact, it is observed lamellar graphite in alloys #12 and #14 and nodules plus compacted graphite in alloys #4 and #21. These microstructures are shown at a higher enlargement in figure 4.
The difference in solidification kinetics depicted by DTA records is thus straightforwardly
associated to the graphite shape. The highest solidification kinetics correspond to alloys solidifying with lamellar graphite (#12 and #14) and the lowest to compacted graphite with low (alloys #4) and high (alloy #21) nodularity.
Note that it is quite possible that the thin and limited surface layers observed on the DTA samples of alloys #4 and #21 are responsible for the small additional peaks seen on their DTA records.
-100 -50 0 50 100 150 200 1100 1120 1140 1160 1180 1200 alloy #4: 4.45% Si alloy #12: 5.04% Si alloy #14: 5.55% Si alloy #21: 6.11% Si
D
T
A
s
ig
n
a
l
(a
.u
.)
Temperature (°C)
Figure 4 – Characteristic graphite morphologies found in the central part of the four DTA samples: alloys #4 (a), #12 (b), #14 (c) and #21 (d).
Discussion
Concerning the as-cast microstructures, table 1 shows that the amount of chunky graphite is low for the two alloys with antimony added, while it is significant for the two others. Further, this amount increases in this latter case with either or both increase in silicon and magnesium. Analysis of the series of castings from which the present samples were selected suggested defining the following index [5]: 3 . 24 55 w 50 8 . 121 55 w 2 1 . 140 55 w 800 wSi Ce Sb Mg Si + ⋅ ⋅ ⋅ ⋅ − ⋅ ⋅ + = Ω
The variation of the amount of chunky graphite with ΩSi is shown in figure 5 where the four alloys of the present study have been highlighted. Chunky graphite is found to appear when ΩSi gets larger than 7 wt.%. This critical value is valid for Y2 blocks as studied here but is expected to decrease with increased section size, and vice versa.
Figure 5 – Change of the chunky area fraction with ΩSi for melts cast in Y2 blocks [5]. The open circles show the position of the four alloys selected for the present study.
Note that the derivation of the index assumes that the effect of antimony is due to it combining with Ce to form CeSb2 compounds. Furthermore, it is clear that other impurities could combine as well with Ce and/or Mg and this could be accounted for in the above equation provided precise data were available.
After remelting and resolidification during the DTA run, the graphite is lamellar in the two samples that contained antimony; it is compacted in those samples free of antimony. In the previous DTA study [6], similar changes in graphite shape were observed which were assumed to be related to the remaining magnesium content. From table 1, it is seen that a similar trend applies in the present work, namely that the two alloys with lamellar graphite are those having the lowest amounts of magnesium and cerium, and that higher contents in magnesium and cerium are related to compacted graphite.
One of the interesting outputs from the present DTA study is the observation that the growth rate of compacted graphite is lower than that of lamellar graphite. This is in agreement with work by König et al. [8] who used thermal analysis. Accordingly, for a given heat flux - or cooling rate in DTA - this leads to a higher kinetics undercooling for eutectic growth with compacted graphite than with lamellar graphite. Quite unexpectedly when considering eutectic growth theory, the corresponding eutectic structure is however much coarser for compacted than for lamellar graphite as stressed with the micrographs in figure 6 from DTA samples of alloys #4 and #12.
0 0.2 0.4 0.6 0.8 1 0 5 10 15 A re a f ra c ti o n o f c h u n k y g ra p h it e ΩSi
Figure 6 – Micrographs comparing the lamellar and compacted graphite structures observed in DTA samples cooled at 10°C/min for (a) alloy #4 and (b) alloy #12.
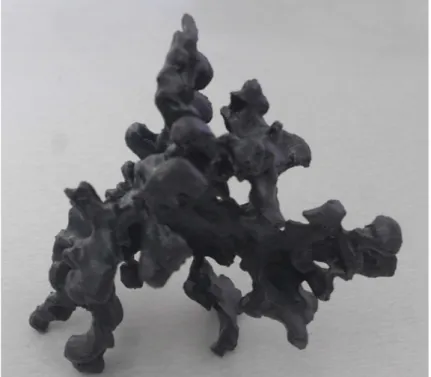
Indeed, graphite in compacted irons appears as more or less larges nodules connected by thick and slightly curved plates that may show a few protuberances with hemispherical ends at their outer boundaries. While these features have been described long ago [9], they were confirmed by a recent tomography study [10] from which could be printed a 3D reconstruction which is illustrated in figure 7. Holmgren et al. [11] observed by electron backscattering diffractometry (EBSD) that worm-like graphite particles are oriented along the prismatic direction as lamellar graphite while protuberances seem to develop in the basal direction as in spheroidal graphite.
Figure 7 – Photograph of a 3D printing of graphite in a compacted graphite eutectic cell. The model was built from a tomographic study [10].
As it is known that the lamellar structures result from easy branching of graphite during eutectic solidification, it may be postulated that the coarse structure of compacted graphite relates to the fact that graphite branching is strongly hindered in this case. At this point, it appeared of interest to go back to reference works on eutectic growth with lamellar graphite, and especially laboratory works by directional solidification. In usual purity cast irons, the coarse type A lamellar graphite is replaced by undercooled type D graphite as the growth rate is increased [12]. The switch is associated with a significant increase in the branching of the graphite lamellae, mostly by twinning onto the large faces of the flakes [13]. Furthermore, it was observed that the critical growth rate for the transition from A to D graphite decreases when the sulphur content was increased [13]. This latter finding has been confirmed by Fujikawa et al. [14] for similar sulphur contents. This suggests that the adsorption of sulphur atoms on the basal planes [15] triggers twinning of graphite lamellae. In pure Fe-C or Fe-C-Si alloys, the graphite is plate-like at low growth rates [16] and is changed to coral graphite at high growth rates. Lux and Grages [17] made A 3D reconstruction of part of a cell of coral graphite that shows a highly branched structure of graphite lamellae. After attaining a certain width, the lamellae narrow off and branch into rod-like extensions which widen and then branch again. Using TEM, Lux et al. [18] showed that the surface of the rods is mostly perpendicular to the c direction, meaning growth of coral graphite proceeds along the prismatic direction as in other lamellar graphite. However, coral graphite presents a large amount of crystalline defects which show up by twisting of the growth blocks relative to each other [18]. It is quite possible that the branching process in coral graphite differs from that in other flake graphite particles, but this does not seem to have been elucidated [15]. Lux and Kurz [19] suggested the transition from lamellar to coral graphite is alike the transition from flake to rod-type eutectic and may be explained at given growth rate by a change in graphite/austenite interface energy; but again, this has not been proven. However, another interesting result for the present study is due to Park and Verhoeven [15] who have demonstrated that decreasing the oxygen level decreases the critical growth rate at which lamellar graphite is replaced by coral graphite. Unlike for sulphur, nothing can be said on the role of oxygen as the mechanism for the transition from lamellar to coral graphite is unclear.
Summing up, removing sulphur and oxygen from the melt through additions of magnesium and/or rare earth limits graphite branching as seen in compacted graphite. The eutectic growth has thus to take place with limited capability of interlamellar spacing change. This leads to much coarser microstructure than in other flake-type eutectics. Also, it may be suggested that the small but definite amount of spheroidizing elements left in the melt is needed for curving of the lamellae and development of spheroids and spheroidal protuberances.
Unfortunately, much less may be said about chunky graphite the growth mechanism of which is still unclear. Holmgren et al. [11] confirmed with EBSD previous reports stating that chunky graphite grows along the c direction. As previously noticed [2], it is however quite astonishing that the characteristic distance between graphite strings in chunky graphite cells is so small, very much similar to the one in coral and undercooled graphite forms. This size characteristic implies that an efficient mechanism for branching does operate during growth of chunky graphite cells. This mechanism has not been characterized on usual chunky cells. However, large protuberances growing in the c direction on top of graphite nodules – either exploded or not - seem twinned when observed under polarized light as illustrated in figure 8 [20]. Skaland [21] suggested that such a twinning mechanism supports chunky graphite growth.
Figure 8 – Polarized light micrograph of spheroidal graphite with twinned protuberances [20].
In a previous work, growth conditions at the liquid/graphite/austenite triple junction were illustrated for lamellar and chunky graphite [22]. For chunky graphite growth, the 2D nucleation growth model valid for thickening flakes in lamellar graphite irons [23] and extended to spheroidal growth [24] must apply. As a matter of fact, Källbom et al. [25] reported that the growth rate of chunky graphite cells is of the order of 0.2-0.5 µm·s-1 for eutectic undercooling from 4 to 10°C. This corresponds to undercoolings of about 20 to 50°C with respect to the graphite liquidus and it may be verified that the above growth rates are very similar to those calculated for spheroidal growth [24]. This suggests that the 2D nucleation growth model could be tentatively accounted for in a description of coupled eutectic growth of chunky graphite.
Conclusions
A group of standard Y2 keel-blocks produced with four different high silicon cast irons have been used in this work to prepare DTA samples and compare as-cast and resolidified microstructures. Graphite degeneracy in the as-cast samples was classified as chunky graphite and quantified. The appearance of chunky graphite could be rationalized as a function of magnesium, silicon, cerium and antimony contents. After DTA tests, graphite appears lamellar or compacted in relation with the initial amount of magnesium and cerium in the cast alloys.
DTA records clearly illustrate that the eutectic growth kinetics is much slower for compacted graphite than for lamellar graphite, leading to much higher growth undercoolings for the former than for the latter structures. The observation that the microstructure of compacted graphite is much coarser is then quite astonishing and suggests that graphite branching is strongly hindered in compacted graphite when comparing to lamellar graphite. This is in agreement with literature reports on the effect of sulphur and oxygen on graphite branching but would be worthy of further studies on compacted graphite.
In case of chunky graphite, which is known to grow along the c crystallographic direction of graphite, the observation that the characteristic distance between graphite strings is small suggests
that some highly efficient branching mechanism does operate during growth of chunky graphite cells. However, this mechanism has still to be clarified.
References
[1] S.E. Franklin, A study of graphite morphology control in cast iron, PhD thesis, Loughborough University, 1986.
[2] J. Lacaze, L. Magnusson Åberg, J. Sertucha, Review of microstructural features of chunky graphite in ductile irons, Keith Millis symposium proceedings, AFS, 2013, 232-240.
[3] S.V. Subramanian, D.A.R. Kay, G.R. Purdy, Compacted graphite morphology control, AFS Trans., 90, 1982, 589-603.
[4] S. Dawson, P. Popelar, Thermal analysis and process control for compacted graphite iron and ductile iron, Keith Millis symposium proceedings, AFS, 2013, 32-39.
[5] R. González-Martínez, U. de la Torre, J. Lacaze, J. Sertucha, Effects of high silicon contents on graphite morphology and room temperature mechanical properties of as-cast ferritic ductile cast irons. Part I – Microstructure, Materials Science and Engineering A, 712, 2018, 794-802.
[6] J. Lacaze, I. Asenjo, S. Mendez, J. Sertucha, P. Larrañaga, R. Suarez, Experimental evidence for metallurgical modification associated to chunky graphite in heavy-section ductile iron castings, Int. J. Metalcasting, winter issue, 2012, 35-42.
[7] D. M. Stefanescu, J. Lacaze, Thermodynamics principles as applied to cast iron, ASM Handbook, vol 1A, Cast Iron Science and Technology, 2017, 31−45.
[8] M. König, Microstructure formation during solidification and solid state transformation in compacted graphite iron, PhD thesis, Chalmers University of Technology, Gothenburg, 2011. [9] Den Xijun, Zhu Peiyue, Liu Qifu, Structure and formation of vermicular graphite, Mat. Res. Soc. Symp. Proc., 34, 1985, 141-150.
[10] C. Chuang, D. Singh, P. Kenesei, J. Almer, J. Hryn, R. Huff, 3D quantitative analysis of graphite morphology in high strength cast iron by high-energy X-ray tomography, Scripta Mater., 106, 2015, 5-8; and https://www.anl.gov/article/highenergy-xrays-give-industry-affordable-way-to-optimize-cast-iron.
[11] D. Holmgren, R. Källbom, I.L. Svensson, Influences of the graphite growth direction on the thermal conductivity of cast iron, Metall. Mater. Trans. A, 38, 2007, 268-275.
[12] M. Hillert, V.V. Subba Rao, Grey and white solidification of cast iron, ISI Pub. 110, 1968, 204-212.
[13] H. Nieswaag, A.J. Zuithoff, The effects of S, P, Si and Al on the morphology and graphite structure of directionally solidified cast iron, The Metallurgy of Cast Iron, Ed. Georgi, St-Saphorin, 1975, 327-351.
[14] T. Fujikawa, K. Nakamura, H. Sumimoto, S. Kiguchi, M. Hatate, Effects of tertiary elements on the critical solidification rate of the flake-undercooled graphite transition of Fe-C alloys, Int. J. Cast Metals Res., 11, 1999, 313-318.
[15] Park, J.S., Verhoeven, J.D., Transition between type A flake, type D flake, and coral graphite eutectic structures in cast irons, Metall. Mater. Trans. A, Vol. 27A, 1996, 2740-2753.
[16] J.C. Ruth, M. Turpin, Structures de solidification unidirectionnelle des eutectiques fer-carbone, Mém. Sci. Rev. Métall., 66, 1969, 633-640.
[17] B. Lux, M. Grages, The spatial structure of graphite in pure Fe-C-Si alloys, Prakt. Metall., 5, 1968, 123-126.
[18] B. Lux, W. Bollmann, M. Grages, On the structure of graphite in pure Fe-C-Si alloys, Prakt. Metall., 6, 1969, 530-535.
[19] B. Lux, W. Kurz, Eutectic growth of iron-carbon-silicon and iron-carbon-silicon-sulphur alloys, ISI Pub. 110, 1968, 193-203.
[20] B. Tonn, J. Lacaze, S. Duwe, Degenerated Graphite Growth in Ductile Iron, Proceedings of Science and Processing of Cast Iron, SPCI-XI, Mat. Sci. Forum, 925, 2018, 62-69.
[21] T. Skaland, private communication, 2017.
[22] U. de la Torre, J. Lacaze, J. Sertucha, Chunky graphite formation in ductile cast irons: effect of silicon, carbon and rare earths, Int. J. Mater. Res., 107, 2016, 1041-1050.
[23] S. Amini, R. Abbaschian, Nucleation and growth kinetics of graphene layers from a molten phase, Carbon, 51, 2013, 110-123.
[24] J. Lacaze, J. Bourdie, M.J. Castro Roman, A 2-D nucleation-growth model of spheroidal graphite, Acta Mater., 134, 2017, 230-235.
[25] R. Källbom, K. Hamberg, M. Wessen, L.E. Björkegren, On the solidification of ductile iron castings containing chunky graphite, Mater. Sci. Eng. A, 413-414, 2005, 346-351.


![Figure 5 – Change of the chunky area fraction with Ω Si for melts cast in Y2 blocks [5]](https://thumb-eu.123doks.com/thumbv2/123doknet/14407935.511154/9.892.250.646.84.411/figure-change-chunky-area-fraction-ω-melts-blocks.webp)
![Figure 8 – Polarized light micrograph of spheroidal graphite with twinned protuberances [20]](https://thumb-eu.123doks.com/thumbv2/123doknet/14407935.511154/12.892.244.653.83.424/figure-polarized-light-micrograph-spheroidal-graphite-twinned-protuberances.webp)
