HAL Id: hal-02954210
https://hal.archives-ouvertes.fr/hal-02954210
Submitted on 30 Sep 2020HAL is a multi-disciplinary open access
archive for the deposit and dissemination of sci-entific research documents, whether they are pub-lished or not. The documents may come from teaching and research institutions in France or abroad, or from public or private research centers.
L’archive ouverte pluridisciplinaire HAL, est destinée au dépôt et à la diffusion de documents scientifiques de niveau recherche, publiés ou non, émanant des établissements d’enseignement et de recherche français ou étrangers, des laboratoires publics ou privés.
Revisiting thermal analysis of hypereutectic spheroidal
graphite cast irons 1 2
M. Castro-Román, J. Lacaze, A. Regordosa, J. Sertucha, R. del Campo-Castro
To cite this version:
M. Castro-Román, J. Lacaze, A. Regordosa, J. Sertucha, R. del Campo-Castro. Revisiting thermal analysis of hypereutectic spheroidal graphite cast irons 1 2. Metallurgical and Materials Transactions A, Springer Verlag/ASM International, In press, �10.1007/s11661-020-06005-7�. �hal-02954210�
1
Revisiting thermal analysis of hypereutectic spheroidal graphite cast irons
1 2
M. J. Castro-Román1, J. Lacaze2, A. Regordosa3, J. Sertucha3, R. del Campo-Castro1
3 4
1. Cinvestav Unidad Saltillo, Av. Industria Metalúrgica 1062, Parque Industrial Saltillo-Ramos
5
Arizpe, Ramos Arizpe, Coahuila, Mexico, C.P. 25900.
6
2. CIRIMAT, Université de Toulouse, 31030 Toulouse, France
7
3. Azterlan, Basque Research Technological Alliance, Aliendalde Auzunea 6, 48200 Durango
8
(Bizkaia), Spain
9 10
Corresponding author: J. Lacaze (jacques.lacaze@ensiacet.fr)
11 12
Abstract 13
This study deals with early solidification of hypereutectic cast irons at varying carbon content
14
and roughly constant alloying additions. Thermal analysis of such alloys shows that the start
15
of the eutectic reaction occurs at a nearly constant temperature for mildly hypereutectic
16
compositions. A similar trend is observed with more hypereutectic compositions but at a
17
higher starting temperature. This jump in the start temperature of the eutectic reaction has
18
not been previously evidenced and is here addressed by considering primary precipitation of
19
graphite.
20 21
Limiting the analysis to spheroidal graphite cast irons, it is demonstrated that simulation of
22
primary graphite precipitation based on a 2D - nucleation/lateral growth model allows
23
substantiating the experimental distinction found between mildly and highly hypereutectic
24
cast irons. This modelling explains that highly hypereutectic alloys start eutectic solidification
25
in a limited temperature range that is nearly insensitive to the initial carbon equivalent of
26
the alloy and to inoculation. This approach also suggests that the start of the eutectic
27
solidification of mildly hypereutectic cast irons is shifted to lower temperature until growth
28
of austenite enriches the liquid in carbon to such an extent that growth of graphite becomes
29
possible.
30 31
Keywords: thermal analysis; hypereutectic cast iron, spheroidal graphite 32
2 33
1. Introduction 34
In cast iron foundry shops, thermal analysis (TA) has slowly evolved over the years as an
35
essential tool for melt control before pouring, but also as a predictive tool of microstructure
36
and casting properties. The possibilities of thermal analysis have been often reviewed, e.g. in
37
the recent works by Dioszegi et al. [1] and Stefanescu [2-4]. TA is expected first to give the
38
so-called carbon equivalent, CE, which is used to locate hypoeutectic alloys with respect to
39
the austenite-graphite eutectic but much more has been looked for, e.g. graphite shape and
40
inoculation level. In practice, foundries rely on experimental calibration of their processing
41
route and state that an alloy behaves as eutectic when the corresponding thermal record
42
shows one single plateau that encompasses the whole solidification process [5]. However,
43
results by Chaudhari et al. [6] have long ago demonstrated that mildly hypereutectic alloys
44
may show eutectic-type records while being of varying CE. This behavior could result from
45
the solidification conditions in the TA cup, whilst other microstructures could be revealed in
46
parts with varying size and cooling rate cast with such a melt, thus generating some
47
confusions.
48 49
As a matter of fact, the conditions for growth of graphite and austenite are affected by tiny
50
changes in the process parameters, e.g. melt composition, graphite nucleation and growth
51
or else cooling rate. Accepting that growth of austenite is easier than that of graphite,
52
graphite growth is thus the key in understanding TA records as it is for analyzing the
53
microstructure of cast iron parts. In the literature, the basic knowledge of graphite growth
54
was largely obtained in relation to the eutectic reaction, while little research has been done
55
on the primary growth of graphite, i.e. the precipitation of graphite alone directly from the
56
liquid. Rare studies on primary growth have been carried out by quenching samples during
57
solidification or by investigating the microstructure of highly hypereutectic alloys [7, 8].
58
There is also one outstanding experimental work based on TA analysis including highly
59
hypereutectic cast irons which is of main concern for the present study. This work was
60
performed over several years and led to two final contributions dedicated to the possibility
61
of extending thermal analysis for predicting as-cast microstructure of industrial cast irons [9]
62
and laboratory alloys [6]. There were two essential outputs from this work which are: i) the
63
thermal records of mildly hypereutectic cast irons often show one single eutectic plateau; ii)
3
in the highly hypereutectic composition range, the thermal records may show an arrest
65
which corresponds to primary deposition of graphite.
66 67
The aim of the present work is to relate graphite precipitation with the features of the TA
68
records for mildly- and hyper-eutectic alloys. It will be shown that making use of equilibrium
69
phase diagram is of definite help for a better understanding of cast iron solidification. For
70
achieving this aim, the first part of this contribution is dedicated to analyzing the results by
71
Chaudhary et al. [6, 9] as well as more recent results with emphasis put on hypereutectic
72
alloys. A number of clear features are obtained which are then discussed in the second part
73
with the support of a simple modelling approach applied to primary spheroidal graphite
74
precipitation. This leads to a tentative conclusion on the reason for the difficulty in
75
controlling mildly hypereutectic spheroidal graphite cast irons by thermal analysis.
76 77
2. Characteristic solidification temperatures and their dependence on carbon equivalent 78
2.1. TA records from Chaudhari et al. [6]
79
The so-called eutectomer samples used by Chaudhari et al. [6] were cylinders 40 mm in
80
diameter and 60 mm in length, weighing 680 g. Castings were carried out with: i) untreated
81
base melts; ii) after Ni-Mg alloy addition for spheroidization but no inoculation or
post-82
inoculation; iii) and after the same spheroidization treatment and post-inoculation. Before
83
casting, the melts were maintained for a while at a high temperature of 1510-1538°C to
84
ensure obtaining the liquid cooling part of the cooling curve. The carbon equivalent CE of the
85
melts was modified by changing both carbon and silicon contents and was expressed as
86
CE=wC+wSi/3, where wi is the alloy content in element i (wt.%). The spheroidizing treatment
87
led to a 0.4-1.7 wt.% (0.85 wt.% on average) addition of nickel to the cast irons for a final Mg
88
content of 0.042-0.067 wt.%.
89 90
The series of thermal records for base melts and for Ni-Mg treated alloys showed similar
91
features which are illustrated in Fig. 1 in the case of the Ni-Mg treated alloys. Note that the
92
original curves were copies of the chart records with the time increasing from right to left.
93
The curves were also shifted along the time axis so that they could be arranged in order of
94
ascending value of CE, from left to right. After picking up the data from the original figure,
95
the temperature was converted from Fahrenheit to Celsius for drawing Fig. 1. Hypoeutectic
4
irons showed a prolonged primary liquidus arrest which corresponds to formation of
97
austenite and was denoted TAL. Generally, this arrest was not of the recalescent type and its
98
temperature gradually decreased with increasing CE as shown with the downwards dashed
99
arrow labelled TAL in Fig. 1. This initial arrest is followed by a eutectic plateau at a
100
temperature that can be associated either to the stable system or to the metastable system.
101
For these hypoeutectic alloys, Chaudhari et al. [6] noticed that the transition from the
102
austenite thermal arrest to the eutectic plateau was smooth, which they understood as
103
indicating that there was no appreciable amount of eutectic forming before the eutectic
104
plateau.
105 106
107
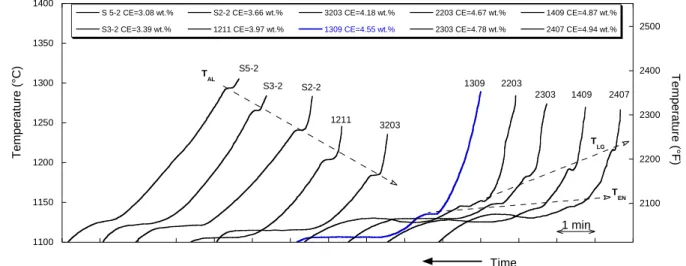
Figure 1 – Cooling curves at increasing CE value (from left to right) of Ni-Mg treated but
not-108
inoculated Fe-C-Si alloys of various carbon and silicon contents. Adapted from Chaudhari et
109
al. [6].
110 111
For mildly hypereutectic alloys with CE in the range from 4.26 wt.% to 4.60 wt.%,
112
solidification is expected to start with precipitation of graphite. However, for these alloys, a
113
thermal arrest similar to the austenite liquidus arrest was observed at a temperature lower
114
than the equilibrium eutectic temperature, TEUT, but higher than that of the eutectic plateau.
115
An example is the bold blue record of alloy #1309 (CE=4.55 wt.%) in Fig. 1. Chaudhari et al.
116
suggested to call it “initial eutectic arrest”, TEN, hence implicitly assuming that the eutectic
117
reaction started with this arrest. As graphite was assumed to have already appeared because
118
of the hypereutectic composition, this arrest must correspond to the formation of austenite.
119 120 1100 1150 1200 1250 1300 1350 1400 S 5-2 CE=3.08 wt.% S3-2 CE=3.39 wt.% S2-2 CE=3.66 wt.% 1211 CE=3.97 wt.% 3203 CE=4.18 wt.% 1309 CE=4.55 wt.% 2203 CE=4.67 wt.% 2303 CE=4.78 wt.% 1409 CE=4.87 wt.% 2407 CE=4.94 wt.% 2100 2200 2300 2400 2500 T e mp e ra ture (° C ) Time 1 min S5-2 S3-2 S2-2 1211 3203 1309 2203 2303 1409 2407 Temp e ra tu re ( °F ) T AL T LG T EN
5
With increase in CE beyond 4.60 wt.%, a primary liquidus arrest corresponding to
121
precipitation of pro-eutectic graphite was observed. This latter arrest was associated with
122
considerable recalescence (up to 5.5°C) and its duration was up to 15 s. The temperature of
123
this latter arrest rose steeply with the CE value as shown with the upwards dashed arrow
124
labelled TLG in Fig. 1. This was considered by Chaudhari et al. [6] as a proof that a graphite
125
liquidus can occur on a cooling curve. Upon further cooling, all four records for highly
126
hypereutectic alloys showed a TEN arrest and then a eutectic plateau at a temperature
127
corresponding to the stable system. According to Chaudhari et al., the TEN arrest rises slightly
128
with increase of the CE value as illustrated with the corresponding dashed arrow in Fig. 1.
129 130
The third series of alloys prepared by Chaudhari et al. [6], i.e. the hypereutectic Ni-Mg
131
treated and inoculated alloys, showed the same kind of features as above with the exception
132
of the graphite liquidus arrest which was not observed even for highly hypereutectic alloys.
133
The authors felt that this absence was due to the fact that the increased number of nuclei
134
"was able to control the precipitation of graphite from the melt" which may be translated to
135
"nucleation of graphite was more regular in inoculated alloys". However, the same authors
136
also reported records with a graphite liquidus arrest for highly hypereutectic commercial
137
cast irons which had been spheroidized with a Fe-Si-Mg (FSM) alloy and inoculated [9]. In
138
any case, one of the conclusions drawn by Chaudhari et al. from their experimental
139
campaigns is that the solidification of hypoeutectic, eutectic and strongly hypereutectic
140
alloys is readily identifiable with TA, while records for mildly hypereutectic alloys show
141
uncertain variability which is further detailed below. Clarifying this issue appeared quickly as
142
an important aim when we started the present work.
143 144
2.2. Characteristic temperatures from Chaudhari et al. [6, 9]
145
When analyzing their results, Chaudhari et al. [6] reported the temperature of the thermal
146
arrests as function of the alloy CE values. However, the silicon content of their alloys was
147
varied in a large range - from 1.06 wt.% to 2.84 wt.% - when it is known that the austenite
148
and graphite liquidus as well as the eutectic temperature all change with the silicon content.
149
Noticing that all their hyper-eutectic alloys had a silicon content higher than 2.40 wt.%, it
150
appeared of interest for further analysis to first select only alloys with such silicon content,
151
i.e. with silicon content within the limited range in between 2.40 and 2.84 wt.%. Available
6
data fulfilling this condition encompasses a few hypo-eutectic alloys and untreated alloys,
153
but these were mainly hypereutectic spheroidized industrial alloys [9] and laboratory alloys
154
[6]. Tables A-I and A-II in appendix A list the reference of all the alloys that were selected for
155
analysis, also including their carbon and silicon contents as well as a few microstructure
156
information for those alloys that were spheroidized. The values of the characteristic
157
temperatures reported below are those that were written along the records in the papers by
158
Chaudhari et al. which were then converted to Celsius.
159 160
The carbon equivalent CE which was used by Chaudhari et al. [6, 9] is expected to take a
161
value of 4.26 wt.% at the eutectic composition. However, the assessment of the Fe-C
162
diagram which is presently accepted [10] indicates that the eutectic is at 4.34 wt.%. This
163
difference is certainly to be related to the kinetics aspects of thermal analysis as opposed to
164
equilibrium [5]. Furthermore, the expression CE=wC+wSi/3 which was selected by Chaudhari
165
et al. goes against current knowledge of the Fe-C-Si phase diagram which indicates a lower
166
coefficient for silicon [2, 11, 12]. It is proposed here to analyze the results of Chaudhari et al.
167
by properly locating their alloys with respect to equilibrium phase diagram. Based on an
168
assessment of the Fe-C-Si phase diagram [13], a linearization of the austenite liquidus, TL,
169
and graphite liquidus, TLg, for silicon content up to 3 wt.% has been previously proposed
170
[12]. This linearization was extended to account for addition of several elements up to 1
171
wt.% for most of them. Limited to the alloys considered in the present work that could
172
contain some Cu, Mn and Ni, the following equations apply:
173 Si Ni Mn Cu C L 1576.3 97.3 w 4.08 w 5.66 w 7.86 w 23.0 w T (1) 174 Si Ni Mn Cu C g L 534.7 389.1 w 40.62 w 2.40 w 18.421 w 113.2 w T (2) 175 176
The eutectic trough is then obtained at the intersection of these two liquidus surfaces. From
177
this, the carbon equivalent according to this description of the phase diagram writes:
178 Si Ni Mn Cu C 99 w 0.092 w 0.007 w 0.054 w 0.28 w CE (3) 179 180
7
The carbon content at the eutectic, eut C
w , is such that CE99=4.34 wt.%. The equilibrium
181
eutectic temperature, TEUT, is thus obtained by inserting weutC in either of the above liquidus
182 expressions: 183 Si Ni Mn Cu EUT 1154.02 4.86 w 5.00 w 2.60 w 4.246 w T (4) 184 185
The values of the first arrest detected on the cooling curves reported by Chaudhari et al. [6,
186
9] for alloys with silicon content higher than 2.40 wt.% are plotted in Fig. 2 as function of
187
CE99. There are four points for hypoeutectic alloys, two base melts and two after Ni-Mg
188
treatment, while all other results are for hypereutectic alloys. The first arrest for
189
hypoeutectic alloys is TAL, while for hypereutectic alloys only arrests corresponding to TLG are
190
reported in Fig. 2. The solid lines represent the calculated austenite and graphite liquidus
191
(equations 1 and 2) for wSi set at an average value of 2.6 wt.% Si and no Ni.1 Please note that
192
these liquidus lines are metastable below the equilibrium eutectic temperature TEUT.
193 194
On the hypoeutectic side, equation 1 suggests that near-eutectic alloys present an
195
undercooling of 5 to 10°C with respect to the austenite liquidus, a value which is well within
196
the range of values observed by Heine [11]. It appeared of interest to compare the austenite
197
liquidus given by equation (1) to the expressions proposed by Chaudhari et al. [9] for the
198
base alloys, TAL,base, and for the Ni-Mg treated alloys, TAL,Ni-Mg:
199 TAL,base = 2929-195.7·wC-42.6·wSi [°F] = 1609.4-108.7·wC-23.7·wSi [°C] (5) 200 TAL,Ni-Mg = 2927-193.4·wC-49.0·wSi+132.9·wMg [°F] = 1608.3-107.4·wC-27.2·wSi+73.8·wMg [°C] (6) 201 202
These expressions have been drawn in figure 2 with short dashed (equation 5) and dotted
203
(equation 6) lines, setting the silicon content at 2.6 wt.% and the magnesium content at 0.05
204
wt.%. It is seen that these two interrupted lines are nearly superimposed to each other and
205
do fit nicely with the experimental results for hypoeutectic alloys.
206 207
In the hypereutectic range, the liquidus arrests show a high undercooling with respect to the
208
equilibrium graphite liquidus. This undercooling, which will be denoted TLgra, is illustrated
209
1Owing to the simultaneous change in CE
99, the liquidus lines when accounting for the
addition of Ni are practically superimposed to those shown in Fig. 2 and have thus not been plotted.
8
with the double arrow in Fig. 2. It can be noted that the undercooling below the graphite
210
liquidus is nearly twice as large for Mg-treated alloys as for base melts. It is worth further
211
stressing that the fact the Mg-treated alloys had been inoculated or not does not appear to
212
significantly change this undercooling. Accordingly, this much higher undercooling shown by
213
the spheroidized alloys must be related to graphite growth kinetics. This is what is expected:
214
growth of lamellar graphite is much quicker than growth of spheroidal graphite, hence the
215
lower TLgraundercooling detected on thermal records of base melts. A dashed line has been
216
drawn in Fig. 2 through each of the two series of data, i.e. those for base melts and those for
217
spheroidized alloys. They are both nearly parallel to the graphite liquidus indicating that the
218
arrest occurred at nearly constant undercooling whatever the carbon equivalent of the
219
alloys was.
220 221
222
Figure 2 – Values of the first arrest on the cooling curves as function of CE99 for laboratory
223
not-inoculated alloys [6] and FSM treated industrial alloys [9] with silicon content between
224
2.40 and 2.84 wt.%. The solid lines are the austenite and graphite liquidus (equations 1 and 2
225
at 2.6 wt.% Si); their intersection at CE99=4.34 wt.% represents the eutectic point in the Fe-C
226
isopleth section. Dotted and short dashed lines show the austenite liquidus according to
227
equations 5 and 6, respectively. The two dashed lines have been drawn through the
228
available data for hypereutectic base melts and Mg-treated alloys, respectively. The double
229
arrow shows how is defined the undercooling TLgra with respect to graphite liquidus.
230 1100 1150 1200 1250 1300 1350 3.0 3.5 4.0 4.5 5.0 Ni-Mg base melt FSM not inoculated FSM inoculated T emp e ra tur e (° C) Carbon equivalent, CE 99 (wt.%) T EUT
9 231
The next step in the analysis of the thermal records reported by Chaudhari et al. [6, 9] was to
232
consider the eutectic arrest limiting our investigation to hypereutectic spheroidized alloys.
233
This has been done first with the same series of alloys as those selected for Fig. 2, i.e. with Si
234
content higher than 2.4 wt.%. As described by these authors, the eutectic reaction may show
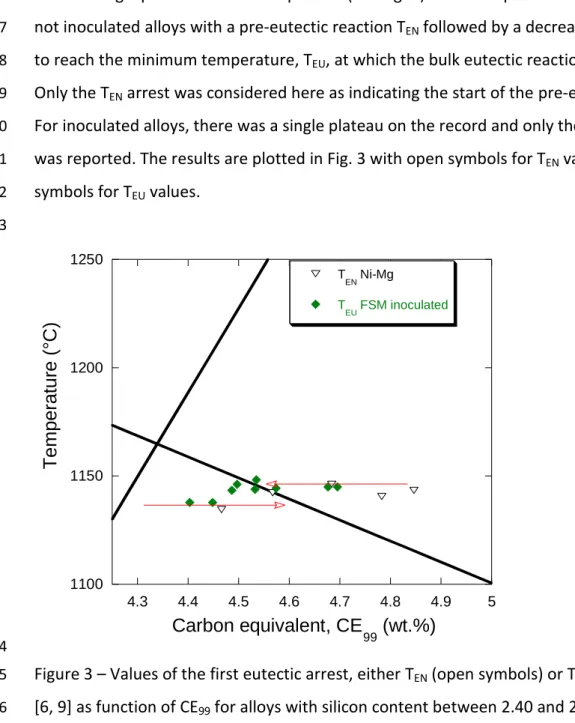
235
either a single plateau or a double plateau (see Fig. 1). A double plateau was observed for
236
not inoculated alloys with a pre-eutectic reaction TEN followed by a decrease in temperature
237
to reach the minimum temperature, TEU, at which the bulk eutectic reaction takes place.
238
Only the TEN arrest was considered here as indicating the start of the pre-eutectic reaction.
239
For inoculated alloys, there was a single plateau on the record and only the TEU temperature
240
was reported. The results are plotted in Fig. 3 with open symbols for TEN values and solid
241
symbols for TEU values.
242 243
244
Figure 3 – Values of the first eutectic arrest, either TEN (open symbols) or TEU (solid symbols)
245
[6, 9] as function of CE99 for alloys with silicon content between 2.40 and 2.84 wt.%. The
246
solid lines are the austenite and graphite liquidus (equations 1 and 2) calculated at 2.6 wt.%
247
Si. In the caption, Ni-Mg is for laboratory alloys [6] while FSM stands for industrial alloys [9].
248 249 1100 1150 1200 1250 4.3 4.4 4.5 4.6 4.7 4.8 4.9 5 T EN Ni-Mg T EU FSM inoculated T e mp e ra tur e (° C ) Carbon equivalent, CE 99 (wt.%)
10
In Fig. 3 appears a jump of nearly 10°C for the start of the eutectic reaction between mildly
250
and strongly hypereutectic alloys. This was not pointed out by Chaudhari et al. and could be
251
made evident here only by limiting the range of silicon contents. This will be supported by
252
other results presented later in this section where the transition zone will also be detailed.
253
What is seen in Fig. 3 is that the formation of austenite for all highly hypereutectic alloys
254
occurs at about 1146°C which may be associated with a liquid at CE99≈4.53 wt.% (upper
255
horizontal arrow pointing to the left). The TEN or TEU temperature of mildly hypereutectic
256
alloys (CE99 less than about 4.46 wt.%) corresponds to a temperature of 1136.5°C which is
257
then related to a liquid composition at CE99≈4.63 wt.% (lower arrow pointing to the right).
258 259
In Fig. 3, another observation was of concern which is that a pre-eutectic reaction TEN did not
260
show up for the mildly hypereutectic inoculated alloys. Such a pre-eutectic arrest was
261
however reported by Chaudhari et al. for most of their near-eutectic industrial alloys [9].
262
However, these latter alloys were not inoculated and then had a much lower silicon content
263
than that of the alloys shown in Fig. 3. Following the same way as before, alloys with silicon
264
content between 1.86 and 2.20 wt.% were selected, see table A-I for details. The results for
265
the first arrest, either TAL or TEN, and the bulk eutectic arrest, TEU, are reported in Fig. 4. As
266
expected, the temperature of the first arrest decreases when CE99 increases suggesting a
267
continuity between TAL for hypoeutectic alloys and TEN for mildly hypereutectic alloys as they
268
both relate to formation of austenite. Chaudhari et al. [9] noticed that "TEN may be mistaken
269
for TAL, though the former should be considerably longer". This statement implies they were
270
expecting some eutectic would form in hypereutectic alloys as soon as the austenite liquidus
271
was reached, which has in fact been the basis of later modelling approaches of cast iron
272
solidification. However, the records reported by Chaudhari et al. did not evidence any
273
lengthening of the arrest when shifting from TAL to TEN implying that no appreciable amount
274
of eutectic formed until some high enough undercooling was reached.
275 276
11 277
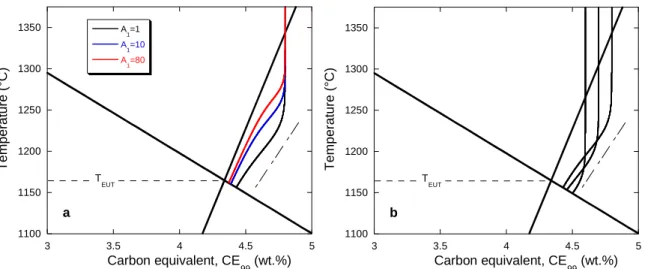
Figure 4 - Values of the TAL or TEN (open symbols) and of TEU (solid symbols) arrests as
278
function of CE99 for alloys with silicon content between 1.86 and 2.20 wt.% [9]. The bold
279
solid lines are the austenite and graphite liquidus (equations 1 and 2) and the dotted line is
280
the TAL,base austenite liquidus (equation 5), all calculated at 2.0 wt.% Si. The red arrow is
281
located at the same eutectic undercooling as in Fig. 3, TEUT=28°C.
282 283
In Fig. 4, it appears also that the temperature for the start of the bulk stable eutectic
284
reaction for near-eutectic and mildly hypereutectic alloys is 26-34°C below the equilibrium
285
eutectic temperature. The red arrow pointing to the right has been located as in Fig. 3 at
286
28°C below the equilibrium eutectic to illustrate the similarity of this result for inoculated
287
(Fig. 3) and for not-inoculated (Fig. 4) Mg-treated alloys. It is worth stressing that previous
288
modelling approaches, e.g. those by Lacaze et al. [14] and others [15, 16], that were based
289
on the same understanding as proposed by Chaudhari et al. [6] and described above,
290
predicted an increase of the bulk eutectic temperature with carbon equivalent (see the TEN
291
arrow in Fig. 1). This expected increase is not consistent with experimental observations,
292
suggesting that the modelling of solidification of hypereutectic alloys needs to be improved.
293 294
Another feature of the TAL arrest in Fig. 4 is that it shows a variable undercooling with
295
respect to the austenite liquidus (equation 1). The dotted line shows the TAL calculated with
296 1100 1150 1200 1250 4.3 4.4 4.5 4.6 4.7 4.8 4.9 5 T AL/TEN T EU T e mp e ra tu re (° C) Carbon equivalent, CE 99 (wt.%)
12
equation 5 and it is seen that it gives the lower limit of the experimental values. The
297
intersection with the arrow is at CE99=4.49 wt.% which corresponds to CE=4.60 wt.% for
298
these alloys at 2 wt.% Si. This latter value of CE is exactly the value obtained by Chaudhari et
299
al. when performing a similar extrapolation. They associated this limit to the transition
300
between mildly and highly hypereutectic alloys. Confusions may occur easily for the alloys in
301
between the eutectic and this limit because TEN may appear or not, and furthermore show a
302
variable undercooling when present.
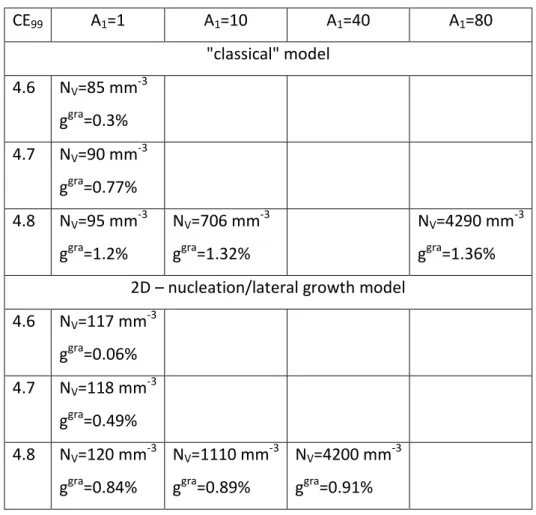
303 304
Before analyzing further and discussing these findings in section 3, it was felt necessary to
305
check the reproducibility of the experimental observations reported above with more recent
306
data.
307 308
2.3. Other series of TA records
309
The first additional series that was considered deals with base melts which have not been
310
spheroidized or inoculated, from which 24 high carbon hypereutectic alloys have been
311
selected. The selected alloys have 1.70 to 1.91 wt.% Si and their chemical analysis showed
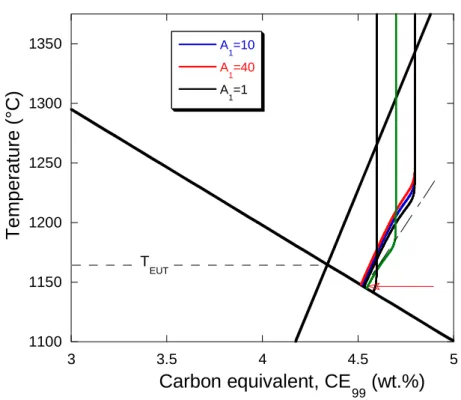
312
they contained 0.14-0.24 wt.% Mn, 0.03-0.10 wt.% Cu and 0.021-0.045 wt.% P. The castings
313
were performed at the experimental TQC foundry laboratory (Spain) using standard thermal
314
cups. According to the manufacturers of these cups and of the connecting wires, the
315
standard deviation on the temperature reading is less than 2°C. In the temperature range
316
where primary precipitation of graphite could be expected, the cooling curves did not show
317
any recalescent arrest, but a clear arrest marked by slope change. The temperature of this
318
arrest was evaluated at the maximum of the first time derivative of the recorded cooling
319
curves (see Fig. 6 for an example). It was found to increase with the value of CE99 as shown in
320
Fig. 5 where have also been drawn the liquidus lines (equations 1 and 2) for an average
321
composition of 1.80 wt.% Si, 0.19 wt.% Mn and 0.07 wt.% Cu. Also, the dashed line in Fig. 5
322
has been located at the same gra L
T
values as the line for base melts in Fig. 2. A good
323
agreement is thus seen between the two series of data which supports the claim that this is
324
effectively the graphite liquidus arrest that was recorded.
325 326
13
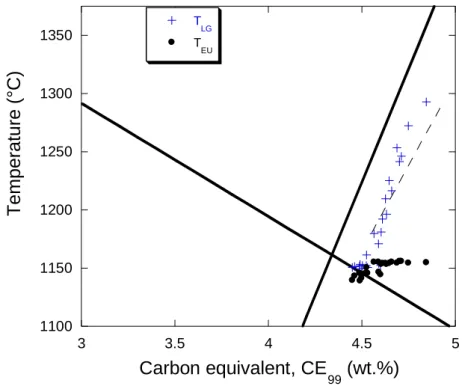
The TEU values have also been plotted in Fig. 5 and show exactly the same features as
327
noticed in Fig. 3, namely a jump between mildly and strongly hypereutectic alloys and a
328
nearly constant TEU temperature for strongly hypereutectic alloys. The difference with
329
spheroidized alloys is that the eutectic reaction of highly hypereutectic alloys takes place at a
330
eutectic undercooling of 6°C only thus stressing the importance of primary graphite
331
precipitation on the course of the solidification of cast irons.
332 333
334
Figure 5 – Values of the TLG (crosses) and TEU (solid dots) arrests as function of CE99 for alloys
335
with silicon content between 1.70 and 1.91 wt.% Si. The bold solid lines are the austenite
336
and graphite liquidus (equations 1 and 2) calculated at 1.8 wt.% Si, 0.19 wt.% Mn and 0.07
337
wt.% Cu. The dashed line is positioned at the same undercooling with respect to the graphite
338
liquidus as the one for base melts in Fig. 2.
339 340
Finally, a series of 36 industrial cast irons melts which have been spheroidized and
pre-341
inoculated in the ladle was analyzed, again selecting alloys with silicon content in a limited
342
range, namely 2.03 to 2.42 wt.%. They also contained 0.40 wt.% Cu and 0.47 wt.% Mn on
343
average and the magnesium content was at 0.031-0.038 wt.%. These alloys were cast for
344
thermal analysis either without post-inoculation or with 0.10 wt.% by weight of a
345
commercial inoculant added at the bottom of the thermal cup. In this latter case, an increase
346 1100 1150 1200 1250 1300 1350 3 3.5 4 4.5 5 T LG T EU T e mpe rature (° C ) Carbon equivalent, CE 99 (wt.%)
14
of 0.075 wt.% in silicon was considered. The cups and recording equipment were the same
347
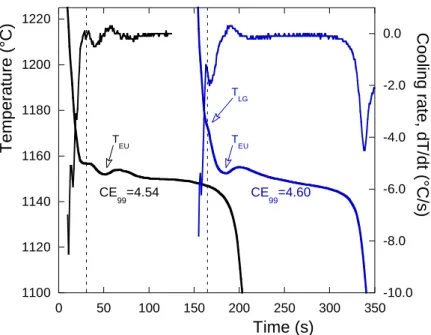
as for the previous series. As an example, Fig. 6 shows the TA record of two inoculated
348
alloys, one at CE99=4.54 wt.% and the other at CE99=4.60 wt.%. For easing reading, this latter
349
curve has been shifted along the time axis. Determining the characteristic temperature for
350
the start of solidification was quite easy on these records by using the cooling rate, dT/dt,
351
curve which has also been plotted in part in Fig. 6. As a matter of fact, both cooling rate
352
curves show a peak corresponding to the onset of solidification which has been indicated
353
with a vertical interrupted line. For the alloy at lower CE99 value, the corresponding arrest is
354
clearly of the TEN type. For the more hypereutectic alloy, it corresponds to a slope change
355
which indicates primary precipitation of graphite at TLG. The second characteristic
356
temperature on both of these records is the temperature TEU at the minimum before the
357
bulk eutectic plateau. This temperature has been indicated with an arrow pointing to the
358
curve in Fig. 6.
359 360
361
Figure 6 – Cooling curves of two spheroidized and inoculated alloys with CE99 at 4.54 wt.%
362
and 4.60 wt.%. The vertical interrupted lines correspond to the local maximum on the
363
cooling rate curves which relates to the start of solidification.
364 365
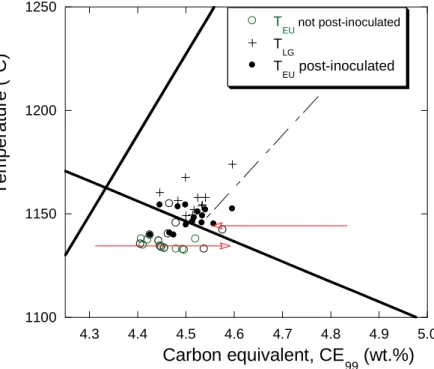
In Fig. 7 has been plotted the TLG temperature for those records showing it, and the TEU
366
temperature for all records of this second series. Some records in the range of CE99 values
367
between 4.40 and 4.55 wt.% showed also a TEN arrest which has not been shown to ease the
368 1100 1120 1140 1160 1180 1200 1220 -10.0 -8.0 -6.0 -4.0 -2.0 0.0 0 50 100 150 200 250 300 350 Time (s) T empe rat u re (° C) Cool in g rate, dT /dt (° C/s) CE 99=4.54 CE99=4.60 T EU TEU T LG
15
description of the figure. The solid lines represent as before the austenite and graphite
369
liquidus calculated for an average silicon content of 2.18 wt.%, 0.47 wt.% Mn and 0.39 wt.%
370
Cu. Concerning the TLG arrest, and for comparison, the dashed line for spheroidized alloys in
371
Fig. 2 has been located in Fig. 7 at the same TLgravalues as in Fig. 2. Seven of the crosses
372
representing the TLG arrest are quite close to this dashed line while three show smaller TLgra
373
value. On the whole, there is a good agreement between the present results and those
374
reported 45 years ago by Chaudhari et al. [6]. The slightly lower values of TLgrain the
375
present series could well be expected as the amount of Mg was in the range 0.031-0.038
376
wt.% while it was reported at 0.042-0.067 wt.% by Chaudhari et al. (see appendix A).
377 378
379
Figure 7 - Values of TLG (plus signs) and TEU (circles and dots) as function of CE99 for industrial
380
alloys with silicon content between 2.03 and 2.42 wt.% Si. The bold solid lines are the
381
austenite and graphite liquidus (equations 1 and 2) calculated at 2.18 wt.% Si, 0.47 wt.% Mn
382
and 0.39 wt.% Cu. The dashed line is at the same undercooling gra L
T
as the one for
383
spheroidized alloys in Fig. 2. The red arrows are located at the same eutectic undercoolings
384
as in Fig. 3.
385 386
Concerning the eutectic reaction, the same jump in temperature from mildly to highly
387
hypereutectic alloys as observed in Fig. 3 is noticed in Fig 7 though there is also an
388 1100 1150 1200 1250 4.3 4.4 4.5 4.6 4.7 4.8 4.9 5.0 T EU not post-inoculated T LG T EU post-inoculated T e mpe ratu re (° C) Carbon equivalent, CE 99 (wt.%)
16
overlapping zone. A well-defined transition zone is however observed in between CE99=4.45
389
wt.% and CE99=4.48 wt.%. For comparison, the upper and lower arrows have been
390
positioned at the same eutectic undercoolings as in Fig. 3. Most of the alloys which have not
391
been post-inoculated show a TEU temperature corresponding to the lower arrow, thus
392
shifting the transition zone to higher CE99 values. Post-inoculated alloys with CE99 equal to or
393
higher than 4.48 wt.% show a TEU temperature which is slightly above the upper arrow as
394
expected. Finally, there are two alloys with CE99 lower than 4.48 wt.% but showing high TEU
395
value which may illustrate uncertainty in chemical analysis (the standard deviation on
396
carbon content is 0.05 wt.%) and possible variations in pre-inoculation efficiency.
397 398
According to the most generally accepted understanding of cast iron solidification, the
set-399
up of the bulk eutectic reaction at TEU depends essentially on the eutectic undercooling,
400
namely when latent heat release becomes sufficiently rapid thanks to growth of both
401
graphite and austenite [4]. On this basis, it was predicted that TEU would increase
402
continuously from hypoeutectic to mildly and then strongly hypereutectic alloys [14]. The
403
above detailed analysis demonstrates that this conclusion is in contradiction with
404
experimental information and thus that the basic assumption was not correct. The results
405
for highly hypereutectic alloys in Figs. 3, 5 and 7 suggest that an appropriate description of
406
the formation of primary graphite had been missing in the previous modelling descriptions.
407
This is the objective of the following discussion to provide an analysis that would allow
408
retrieving the features described in this section 2.
409 410
3. Discussion 411
This discussion is organized in two steps: i) calculation of the solidification path of highly
412
hypereutectic alloys following two models for spheroidal graphite growth from the liquid;
413
and ii) consequences on the understanding of TA records for mildly hypereutectic spheroidal
414
graphite cast irons.
415
416
3.1. Modelling primary precipitation of graphite
417
Cooling and solidification of small castings such as eutectometer samples could be described
418
quite satisfactorily considering the thermal gradients are small enough and thus assuming
17
their temperature is homogeneous at any time. Hence, the following heat-balance equation
420 applies: 421 dt dV H dt dT C V q A S iron p iron (7) 422
where q is the density of the heat flux exchanged by the metal with the mold (q<0 for usual
423
casting conditions), V and A are the volume of the casting and its outer surface, respectively,
424
V/A being the thermal modulus, iron and iron p
C are the density and the heat capacity (per
425
unit mass) of the metal, respectively, T is the sample temperature, H is the latent heat of
426
melting per unit volume, VS is the solidified volume and t is time.
427 428
It has been shown previously [12] that cooling and solidification of thermal cups may be
429
described by setting q in equation (7) to the following expression:
430
0
0.5 t T T q (8) 431where is defined by the properties of the cup and T0 is the ambient temperature. This will
432
be used here by inserting q in equation (7) with the value of the parameters as listed in table
433
I. They come from previous work [14] apart for which has been adapted to thermal cups. It
434
has been verified that the cooling rate at 1250°C is of the order of the 3°C/s mentioned by
435
Chaudhari et al. All calculations will start at the pouring temperature of 1525°C as an
436
average of the holding temperature used by Chaudhari et al. [6]. Only primary precipitation
437
of spheroidal graphite will be considered, describing first the nucleation stage and then
438
growth.
439 440
Table I – Values of the parameters used for simulations.
441 V/A [m] [J·m-2·K-1·s-0.5] liquid p C [J·K-1·kg-1] solid p C [J·K-1·kg-1] liquid [kg·m-3] [kg·m-3] gra [kg·m-3] Hgra [J·kg-1] 0.009 728 920 750 6800 7000 2200 1.62·106 442
Nucleation kinetics has sometimes been described as a function of the cooling rate with a
443
cooling rate dependent coefficient fitted so as to retrieve the final nodule counts. Another
444
approach describes nucleation as a function of undercooling with respect to graphite
445
liquidus, TLgra, which expresses the actual driving force for graphite nucleation. This latter
18
description must be coupled with the growth of the graphite phase to describe carbon
447
desaturation in the liquid [17]. It is assumed that there exists in the liquid a distribution of
448
potential nuclei that can be activated at increasing undercooling, see Dantzig and Rappaz
449
[18] for a comprehensive description. New nuclei start being activated as soon as the
450
temperature falls below the liquidus temperature and their number increases as the
451
undercooling increases. However, if during cooling of the melt the undercooling TLgra
452
decreases because of growth of graphite precipitates, nucleation of new particles stops. In
453
this way, the effect of cooling rate on the number of nucleated graphite particles is closely
454
related to growth of graphite precipitates as it should be. For the present work, we selected
455
the simplest possible nucleation law which is written:
456 gra L 1 V A T N (9) 457
where A1 is a constant which depends on the inoculation treatment of the melt, and is thus a
458
parameter that may be changed from one melt to another in relation to the amount of
459
inoculant added. Such a law has been shown to be appropriate for analyzing continuous
460
nucleation observed on samples quenched during directional solidification [19] and has been
461
considered also in the analysis of in-situ experiments followed with 4D-XRD [20].
462 463
Growth of primary graphite precipitates will be described according to two models, a
464
"classical" one which accounts for interfacial kinetics [17] and a more recent one which is
465
based on a 2D – nucleation/lateral growth of new layers at the outer surface of the
466
spheroids [21]. The main features of these two models are reminded in appendix B and their
467
predictions described below. During cooling, a new class of nodules is generated at each
468
time step of calculation according to equation (9). These nodules then grow as described by
469
either of the two growth models, leading to a decrease of the carbon content in the liquid
470
which is estimated with the following approximate overall carbon balance:
471 gra C gra gra C liquid liquid 0 C liquid 0 w V w V w V (10) 472
in which V0, Vliquid and Vgra are the initial volume, the volume of remaining liquid and the
473
volume of precipitated graphite; 0 C
w and wC are the initial carbon content in the alloy and
474
the carbon content remaining in the liquid at time t, respectively; wgraC 100wt.%is the 475
carbon content in graphite. 476
19
At any time, the volume of graphite that has precipitated is the sum of the volume of the
478
nodules in all activated classes, and the change of graphite volume between two time steps
479
may be inserted in equation (7) to calculate the related change in temperature. Calculations
480
were carried out using the parameters in Table I and in appendix B for those specific to each
481
growth model. The calculations were stopped when the extrapolation of the austenite
482
liquidus below TEUT was reached.
483 484
As expected from previous study [14], the latent heat release during primary graphite
485
growth leads only to a slight slope change which could hardly be seen on the calculated
486
cooling curves. However, it could be inferred that an abrupt increase of graphite
487
precipitation at some stage during primary precipitation explains the liquidus arrests
488
reported in the previous section. Such an abrupt increase should lead to carbon desaturation
489
of the liquid according to equation (10) and can thus be followed by drawing the
490
solidification path, i.e. the change in carbon content in the liquid wC with decreasing
491
temperature. For a direct comparison with Fig. 2, this is the change of CE99 wC 0.28wSi
492
which will be plotted, and the calculations were carried out with wSi set at 2.60 wt.%.
493 494
Fig. 8 presents the calculations done with the "classical" growth model for Fe-C-Si alloys
495
having CE99 at 4.6 wt.%, 4.7 wt.% and 4.8 wt.%. Preliminary calculations showed that values
496
of A1 set between 1 and 80 mm-3·K-1 give nodule counts NV varying between about 100 mm-3
497
and 4000 mm-3, in agreement with the range of NV values evaluated from the experimental
498
information of Chaudhari et al. (see appendix A). Fig. 8-a shows calculations made for
499
CE99=4.8 wt.% and A1 set to 1, 10 and 80 mm-3·K-1. The predicted nodule count and fraction
500
of graphite, ggra, at the end of primary graphite precipitation are listed in Table II.
501 502
Upon cooling, the carbon content in the liquid first does not change and then suddenly
503
decreases at a temperature that is higher and higher as A1 increases. Once the carbon
504
content has started to decrease, it may be noticed that the undercooling with respect to the
505
graphite liquidus decreases also, meaning that nucleation of new nodules has stopped and
506
only growth of the pre-existing nodules proceeds. The sudden curving of the solidification
507
path may thus be associated with the thermal arrest observed on the TA records. It is further
20
seen in figure 8-a that the solidification path hits the austenite liquidus at a temperature
509
that is closer and closer to the eutectic temperature as the nucleation constant is increased.
510
It is thus predicted a TEN or TEU value much closer to the stable eutectic temperature, TEUT,
511
than observed, see Fig. 3.
512 513
514
Figure 8 – Solidification path of highly hyper-eutectic alloys shown in the CE99-T plane. a:
515
calculations for CE99=4.8 wt.% and three values of the nucleation constant A1 (mm-3·K-1) as
516
indicated in the caption. b: calculations for A1 set equal to 1 mm-3·K-1 for three starting
517
values of CE99 (4.6, 4.7 and 4.8 wt.%). In both graphs, the dashed line represents the thermal
518
arrest for Mg-treated alloys as in Fig. 2. The bold solid lines are the austenite and graphite
519
liquidus (equations 1 and 2) calculated for 2.6 wt.% Si.
520 521
In Fig. 8-b, calculations for CE99 at 4.6, 4.7 and 4.8 wt.% were reported only for A1=1 mm-3·K-1
522
because the same features as above were observed for higher A1 values. It is noted that the
523
curving of the solidification path for A1=1 mm-3·K-1 occurs at an undercooling which is almost
524
independent of the CE99 value. This curving corresponds to a temperature at nearly constant
525
gra L
T
value. However, because of graphite growth during further cooling below this
526
temperature, the solidification path reaches the austenite liquidus at a higher and higher
527
temperature as the alloy's CE99 value is increased which again disagrees with Fig. 3.
528 529
Calculations with the 2D – nucleation/lateral growth model were carried out with the same
530
CE99 values as above and with A1 at 1, 10 and 40 mm-3·K-1 to span the same range of nodule
531
count. The solidification paths are shown in Fig. 9 and the main output values are also listed
532 1100 1150 1200 1250 1300 1350 3 3.5 4 4.5 5 A 1=1 A1=10 A 1=80 T e mpe ra ture (° C) Carbon equivalent, CE 99 (wt.%) a T EUT 1100 1150 1200 1250 1300 1350 3 3.5 4 4.5 5 T e mpe ra ture (° C) Carbon equivalent, CE 99 (wt.%) b T EUT
21
in Table II. It is first seen in Fig. 9 that the solidification path curves at about the same
533
undercooling with respect to the graphite liquidus whichever is the CE99 value. More
534
important, it is then noticed that the solidification path of the alloy at CE99=4.8 wt.%
535
depends very little on the A1 value. This is directly related to the fact that growth of graphite
536
in this model is triggered by nucleation of new growth blocks at the surface of the spheroids
537
which varies exponentially with the driving force expressed as a function of the undercooling
538
of the liquid with respect to the graphite liquidusTLgra. The trends shown in Fig. 3 are
539
therefore reproduced in the calculations shown in Fig. 9 when this was not the case with Fig.
540
8.
541 542
Table II – Output of calculations using various values of CE99 (wt.%) and A1 (mm-3·K-1)
543
according to the "classical" and 2D – nucleation/lateral growth models.
544 CE99 A1=1 A1=10 A1=40 A1=80 "classical" model 4.6 NV=85 mm-3 ggra=0.3% 4.7 NV=90 mm-3 ggra=0.77% 4.8 NV=95 mm-3 ggra=1.2% NV=706 mm-3 ggra=1.32% NV=4290 mm-3 ggra=1.36% 2D – nucleation/lateral growth model
4.6 NV=117 mm-3 ggra=0.06% 4.7 NV=118 mm-3 ggra=0.49% 4.8 NV=120 mm-3 ggra=0.84% NV=1110 mm-3 ggra=0.89% NV=4200 mm-3 ggra=0.91% 545
The results in figure 9 are striking: whatever the alloy's CE99 value equal to or higher than 4.6
546
wt.% and whatever the inoculation level (A1 value) of the cast iron, the solidification path
547
will reach the austenite liquidus at a temperature 17-24°C below the eutectic temperature.
22
The similarity with the experimental results in Fig. 3 is worth being stressed and this has
549
been emphasized with the horizontal arrow pointing to the left of the hypereutectic
550
composition domain which is exactly the same as in Fig. 3. For a given CE99 value, the
551
temperature at which the austenite liquidus is reached increases only little when the
552
inoculation level is increased, in contrast with the results in Fig. 8-a. It may thus be stated
553
that the 2D - nucleation/lateral growth model allows retrieving the main features of primary
554
graphite precipitation while the "classical" model does not.
555 556
557
Figure 9 – Solidification path of hyper-eutectic alloys shown in the CE99-T plane. Calculations
558
for CE99=4.8 wt.% were performed for three A1 values, 1, 10 and 40 mm-3·K-1. Calculations for
559
CE99 at 4.6 wt.% and 4.7 wt.% were carried out with A1=1 mm-3·K-1. The bold solid lines are
560
the austenite and graphite liquidus (equations 1 and 2) calculated at 2.6 wt.% Si. The dashed
561
line represents the thermal arrest for Mg-treated alloys as in Fig. 2.
562 563
3.2 consequences on the understanding of TA records for mildly hypereutectic cast irons
564
If calculations had been made for mildly hypereutectic alloys with CE99 in between the
565
eutectic value at 4.34 wt.% and a maximum value slightly lower than 4.6 wt.%, growth of
566
graphite would not have taken place before the austenite liquidus is reached. Accordingly,
567
the austenite liquidus would be reached at a temperature that corresponds to the CE99 value
568 1100 1150 1200 1250 1300 1350 3 3.5 4 4.5 5 A 1=10 A 1=40 A 1=1 T e mpe ra ture (° C) Carbon equivalent, CE 99 (wt.%) T EUT
23
of the alloy. It has been seen that the formation of austenite can occur with some
569
undercooling (Fig. 4) or may even not be detected (Fig. 3). In either case, Figs. 3, 4 and 7
570
suggest that the bulk eutectic reaction of these mildly hypereutectic alloys takes place only
571
when the temperature has decreased to a value which seems independent of the CE99 value.
572
This temperature relates to a carbon enrichment of the liquid corresponding to a carbon
573
equivalent of about 4.63 wt.% in Fig. 3. In previous modelling approaches, this carbon
574
enrichment was seen as corresponding to an eutectic undercooling high enough for the
575
eutectic to start growing to some extent. It is however striking to note that this also
576
corresponds to an undercooling TLgrawhich is on the range of value necessary for primary
577
graphite to grow to a significant extent according to the 2D – nucleation/lateral growth
578
model. In line with this conclusion, it is worth noting that Bjerre et al. [16] observed the first
579
graphite precipitates in their 4D-XRD synchrotron experiments on an hypo-eutectic
580
spheroidal graphite cast iron at an undercooling with respect to the graphite liquidus higher
581
than 100°C. These findings suggest the following tentative schematic for solidification of
582
mildly hypereutectic alloys.
583 584
Fig. 9 is reproduced in Fig. 10 without the calculated solidification paths. The lower arrow
585
pointing to the right has been located at an eutectic undercooling TEUT =28°C. Its
586
intersection with the austenite liquidus is at CE99=4.62 wt.%. From this intersection is drawn
587
the vertical dotted line which separates highly hypereutectic cast irons to the right of it from
588
mildly hypereutectic cast irons to the left of it. The undercooling TLgra at the intersection
589
amounts to 137°C, high enough for significant growth of graphite from the liquid according
590
to the 2D - nucleation/lateral growth model. Primary solidification of alloys with CE99 larger
591
than 4.60 wt.% have been seen to end at a temperature nearly insensitive to the CE99 value.
592
This is represented with the arrow pointing to the left in Fig. 10 which has been located 10°C
593
above the lower arrow and points to a liquid of composition CE99=4.53 wt.%. Increase of the
594
inoculation level of the melt and probably also decrease of the Mg content will move it
595
slightly upwards.
596 597
A tentative description of solidification of mildly hypereutectic alloys may then be suggested
598
which should be further substantiated in the future with dedicated experiments. Fig. 9
24
showed that the primary solidification path for an alloy with CE99=4.6 wt.% is nearly straight,
600
curving only at its bottom end. This means that for alloy's CE99 values between 4.34 and 4.60
601
wt.%, the primary solidification path will be straight down, i.e. no significant growth of
602
primary graphite would have occurred when the austenite liquidus extrapolation is reached.
603
At that temperature, austenite starts forming, possibly with some limited undercooling, and
604
then grows rapidly so that the remaining liquid gets quickly enriched in carbon. With further
605
decrease in temperature, this enrichment is such that the liquid reaches a CE99 value
606
corresponding to an undercooling TLgra high enough for growth of spheroidal graphite, and
607
hence sufficient for the eutectic solidification to start. This straightforward schematic
608
explains that the TEU temperature is constant for near-eutectic hypereutectic alloys.
609 610
611
Figure 10 – Schematic showing how to define highly hypereutectic alloys to the right of the
612
vertical dotted line from mildly hypereutectic alloys to the left. The greyed area is the
613
transition zone, see text. The bold solid lines are the austenite and graphite liquidus
614
(equations 1 and 2) calculated at 2.6 wt.% Si.
615 616
The transition zone between the two types of hypereutectic alloys may be defined with the
617
greyed area in Fig. 10. This area is here drawn for not inoculated alloys which have been
618
strongly spheroidized, it is expected to move slightly to the left with inoculation and lower
619
Mg treatment. Alloys in this range showed an erratic behavior which has certainly to be
620
related to the efficiency of the nucleation and growth processes of primary graphite. The
621
fact that the formation of austenite is not always detected and this "erratic" primary
25
graphite precipitation might explain the confusion stated by Chaudhari et al. when analysis
623
the TA records of mildly hypereutectic alloys.
624 625
4. Conclusion 626
Detailed analysis of the thermal records of hypereutectic cast irons has evidenced a
627
transition between mildly hypereutectic and highly hypereutectic compositions. Highly
628
hypereutectic alloys often show an arrest that can be associated with primary graphite
629
precipitation and which occurs at a high undercooling with respect to graphite liquidus.
630
Solidification of these alloys then proceeds with a bulk eutectic reaction taking place at a
631
temperature which is nearly insensitive to the carbon equivalent of the alloy. Mildly
632
hypereutectic alloys do not show such a primary arrest and undergo a eutectic reaction that
633
starts at a temperature significantly lower, but yet also independent of their carbon
634
equivalent. This difference has been described as demonstrating the need for the liquid to
635
reach a high enough undercooling with respect to the graphite liquidus for allowing effective
636
graphite growth. This undercooling is reached during primary solidification in the case of
637
highly hypereutectic alloys while it needs that growth of austenite enriches the liquid in
638
carbon in the case of mildly hypereutectic alloys.
639 640
Simulation of primary spheroidal graphite precipitation based on a 2D - nucleation/lateral
641
growth model has allowed substantiating this distinction between mildly and highly
642
hypereutectic cast irons which has been proposed a long time ago by Chaudhari et al. The
643
transition occurs in a limited range of CE99 values, namely 4.53 to 4.62 wt.%
644
for the cooling conditions encountered in standard thermal analysis. Inoculation of the melt
645
shifts this transition to slightly lower CE99 values. The very good agreement between
646
predicted trends and experimental results suggests further work in two directions: 1)
647
investigating the effect of cooling rate and magnesium content; 2) extending the analysis to
648
lamellar and compacted graphite cast irons.
649 650
Acknowledgment 651
R.D.C.C. is pleased to acknowledge the support of Fundación Azterlan for performing his PhD
652
research.
653 654
26 References
655
[1] A. Dioszegi, V.L. Diaconu and V. Fourlakidis: J. Therm. Anal. Calorim., 2016, Vol. 124, pp.
656
215–225.
657
[2] D.M. Stefanescu: Int. J. Metalcast., 2015, Vol. 9, pp. 7-22.
658
[3] H. Fredriksson and D.M. Stefanescu: Cast Iron Science and Technology, ASM
659
International, OH, ASM Handbook, Vol. 1, 2017, pp. 81-86.
660
[4] D.M. Stefanescu, R. Suarez and Sung Bin Kim: China Foundry, 2020, Vol. 17, pp. 69-84.
661
[5] S. Dawson and P. Popelar: Proceedings of the Keith Millis symposium, AFS, 2013, pp.
59-662
66.
663
[6] M.D. Chaudhari, R.W. Heine and C.R. Loper: AFS Cast Metals Res. J., 1975, Vol. 11, pp.
52-664
60.
665
[7] M. Hillert and V.V. Subba Rao: ISI Publ. 110, The Iron and Steel Institute, London (UK),
666
1969, pp. 204-212.
667
[8] S. Amini and R. Abbaschian: Carbon, 2013, Vol. 51, pp. 110-123.
668
[9] M.D. Chaudhari, R.W. Heine and C.R. Loper: AFS Trans., 1974, Vol. 82, pp. 379-386.
669
[10] P. Gustafsson: Scand. J. Metall., 1985, Vol. 14, pp. 259-267.
670
[11] R.W. Heine: AFS Trans., 1995, Vol. 103, pp. 199-206.
671
[12] M. Castro, M. Herrera, M.M. Cisneros, G. Lesoult and J. Lacaze: Int. J. Cast Met. Res.,
672
1999, Vol. 11, pp. 369-374.
673
[13] J. Lacaze and B. Sundman: Metall. Trans., 1991, Vol. 22A, pp. 2211-2223.
674
[14] J. Lacaze, G. Lesoult and M. Castro: Acta mater., 1998, Vol. 46, pp. 997-1010.
675
[15] K.M. Pedersen and N.S. Tiedje: Int. J. Cast Met. Res., 2007, Vol. 20, pp. 145-150.
676
[16] M. Bjerre, N.S. Tiedje, J. Thorborg and J.H. Hattel: IOP Conf. Ser.: Mater. Sci. Eng., 2015,
677
Vol. 84, 012038.
678
[17] G. Lesoult M. Castro and J. Lacaze: Acta mater., 1998, Vol. 46, pp. 983-995.
679
[18] J.A. Dantzig and M. Rappaz: Solidification, Engineering Science, EPFL Press, Lausanne,
680
Switzerland, 2009, pp. 268-275.
681
[19] J. Lacaze, M. Castro, N. Aichoun and G. Lesoult: Mem. Etudes Sci. Rev. Metall., 1989, pp.
682
85-97.
683
[20] M.A. Azeem, M.K. Bjerre, R.C. Atwood, N.S. Tiedje and P.D. Lee: Acta Mater., 2018, Vol.
684
155, pp. 393-401.
685
[21] J. Lacaze, J. Bourdie and M.J. Castro-Roman: Acta mater., 2017, Vol. 134, pp. 230-235.
27
[22] M. Coster and J.L. Chermant: Précis d’analyse d’images, Presses du CNRS, Paris, France,
687
1989, pp. 144-148.
688
[23] W.B. Hillig: Acta metall., 1966, Vol. 14, pp. 1868-1869.
689
[24] D. Turnbull and J.C. Fisher: J. Chem. Phys., 1949, Vol. 17, pp. 71-73.
690
[25] J.W. Cahn, W.B. Hillig and G.W. Sears: Acta metall., 1964, Vol. 12, pp. 1421-1439.
691
[26] K.A. Jackson, D.R. Uhlmann and J.D. Hunt: J. Crystal Growth, 1967, Vol. 1, pp. 1-36.
692
[27] W.P. Bosze and R. Trivedi: Metall. Trans., 1974, Vol. 5, pp. 511-512.
28 Appendix A
694
Tables A-I and A-II list the results selected from the works by Chaudhari et al. [6, 9]. Table A-I
695
gives the reference of the alloys, their carbon and silicon contents as well as the CE and CE99
696
values for industrial alloys [9]. For those alloys that have been spheroidized, the surface
697
nodule count, NA, and nodularity are listed when they were reported. For alloys that
698
solidified mostly in the stable system, the NA values were converted to volume number of
699
graphite particles, NV, by means of
2 A V D N 2 N
, whereD2 is the average diameter of these
700
particles in a 2D metallographic section [22]. For doing so, D2was evaluated by setting the
701
area fraction of graphite to an average value ggra=0.09:
5 . 0 A gra 2 N g 4 D
. NV values are not
702
given for alloys that showed essentially metastable solidification. Table A-II gives the same
703
information for laboratory alloys [6].
704 705
Table A-I – alloy reference, carbon and silicon contents, carbon equivalents CE and CE99,
706
magnesium content, surface and volume nodule counts, and nodularity for industrial alloys
707
[9]. In the reference name, T stands for spheroidized and not inoculated, L for spheroidized
708
and inoculated.
709
Alloy reference %C %Si CE CE99 %Mg NA
(mm-2) NV (mm-3) Nodularity (%) 7T10 3.73 2.02 4.40 4.30 0.061 144 3250 97 7T1 3.75 2.01 4.41 4.31 0.058 140 3120 97
7T4 3.89 1.86 4.51 4.41 0.057 Not given Not given
7T11 3.86 2.05 4.54 4.43 0.058 100 1880 93
6T13 3.80 1.91 4.43 4.33 0.055 Not given Not given
6T12 3.83 1.89 4.49 4.36 0.053 64 960 89
6T11 3.89 1.96 4.53 4.44 0.056 96 1770 92
6T1 3.81 2.66 4.67 4.55 0.048 Not given Not given
4L27 3.72 2.44 4.53 4.40 0.045 190 4930 100 4L17 3.79 2.66 4.58 4.53 0.056 116 2350 99 4L24 3.86 2.55 4.71 4.57 0.048 142 3180 99 4L23 3.96 2.56 4.81 4.68 0.054 173 4280 99 4L18 3.99 2.52 4.83 4.70 0.055 180 4540 99 3L20 3.74 2.53 4.58 4.45 0.058 144 3250 100 6L11 3.78 2.56 4.63 4.50 0.051 144 3250 100
3L31 3.81 2.58 4.67 4.53 0.053 Not given Not given 7L11-inoc 3.75 2.63 4.63 4.49 0.057 112 2230 95
29 710
Table A-II – alloy reference, carbon and silicon contents, carbon equivalents CE and CE99,
711
magnesium content, surface and volume nodule counts, and nodularity for laboratory alloys
712
[6]. In the reference name has been added "base" for base melts, "NiMg" for spheroidized
713
alloys without inoculation or "inoc" for spheroidized and inoculated alloys. For the
714
spheroidized alloys, the CE99 values account for an average of 0.85 wt.% Ni added due to the
715 treatment. 716 Alloy reference %C %Si CE CE99 %Mg NA (mm-2) NV (mm-3) Nodularity (%) 1101 – base 2.80 2.84 3.75 3.60 -- 1203 – base 3.16 2.64 4.04 3.90 -- 1301 – base 3.74 2.46 4.56 4.43 -- 2201 – base 3.84 2.63 4.72 4.58 -- 1401 – base 4.06 2.56 4.91 4.78 -- 2402 – base 4.11 2.54 4.96 4.82 -- 1211 – NiMg 3.13 2.53 3.97 3.88 0.067 36 –mainly carbides 57 1309 – NiMg 3.74 2.43 4.55 4.47 0.058 29 – mainly carbides 85 2203 – NiMg 3.76 2.72 4.67 4.57 0.056 33 360 81 2303 – NiMg 3.91 2.60 4.78 4.68 0.055 70 1100 92 1409 – NiMg 4.02 2.56 4.87 4.78 0.060 120 2360 100 2407 – NiMg 4.07 2.61 4.94 4.85 0.042 107 2210 96 3403 – NiMg 4.03 2.34 4.81 4.73 0.060 Not given
3208 - inoc 3.42 2.62 4.29 4.20 0.048 67 1030 59
717 718
30 Appendix B
719
Classical model [17]
720
The growth rate drgra/dt of a spherical particle of graphite of radius rgra is related to a carbon
721
flux from the liquid through the following mass balance:
722
dt dr w w gra i C gra C gra (B-1) 723 where gra C w and i Cw are the carbon content in graphite and in the liquid at the
724
liquid/graphite interface, respectively.
725 726
The transfer of carbon to a graphite precipitate proceeds through two steps in series:
727
diffusion in the liquid on the one hand and interfacial reaction on the other hand. Writing
728
that the flux of carbon is the same for these two steps leads to the following equation:
729
l/gra
2 C i C l gra r l C l l C K w w r w D (B-2) 730 where l CD is the carbon diffusion coefficient in the liquid, wlCis the carbon content in the
731
liquid, K the interfacial kinetics constant and l/gra C
w is the liquid carbon content at the
732
equilibrium graphite liquidus.
733 734
Assuming a steady state carbon profile around the growing graphite nodule, equation (B-2)
735
may be solved for i C
w which is then inserted in equation (B-1) to give drgra/dt. Calculations
736
were carried out with an initial nodule radius of 1 µm, l 9 C 5 10 D m2·s-1 and K=0.5 m·s-1 as 737 previously used [14]. 738 739
2D – nucleation/lateral growth model [21]
740
In this approach, a spherical shape is assumed which grows by continuous nucleation of new
741
disc-shaped growth blocks at the outer surface of the spheroid on top of the so-called
742
sectors, see figure B1. The new blocks nucleate in epitaxy or semi-epitaxy with the
743
underlying graphite, and then extend laterally along the surface. The overall growth
744
direction thus remains parallel to the basal c crystallographic direction of graphite, while
745
growth proceeds in the prismatic a direction along the outer surface of each sector.
746 747