Greece……….dionysios georgopoulos & ioannis c. Demetriou
Revue des Sciences Économiques et de Gestion N°13 (2013)1 Abstract
THE DEPENDENCY OF THE GREEK SOFTWARE INDUSTRY ON THE PUBLIC INVESTMENT PROGRAM OF GREECE
Dionysios Georgopoulos & Ioannis C. Demetriou Software Project Manager, Quality
and Reliability S.A
Department of Economics, National and Kapodistrian University of Athens
The dependency of the Greek Software Industry (GSI) sector on the Public Investment Program (PIP) of Greece and on certain macroeconomic and sector-specific indices is investigated together with the prospect of expansion of GSI to foreign markets. The main characteristics, a brief historical background and an analysis of the GSI Sector are presented. On the other hand, PIP along with its development over the last fifteen years, has been in incremental relation with the Community Operational Frameworks of the EU. An econometric model is presented that attempts to estimate the dependency of the software sector turnover upon PIP and the following indices: gross domestic product, disposable income, average labor cost, interest rate and change in broadband relations. The process is described in detail and the results show the statistical significance of the independent PIP variable together with seasonality, as the main factors of dependence of the software sector turnover. The model may be further useful to decision making and economic policy regarding the development of the Greek software sector. Finally, after a short description of the current macroeconomic environment, the prospects of expansion of the Greek Software Industry to foreign markets are considered and the most important growth factors, according to a recent survey among sector executives, are presented.
1. Introduction
The Greek Software Industry, an industry younger than two decades, is trying to find its place in a market that is almost totally globalized, while facing the fierce consequences of the current economic crisis.
The aim of this work is to examine the current status of the Greek Software Industry and analyze its strengths and weaknesses. In order to find the level of awareness of the industry towards the changes that the new technological and macroeconomic environment will bring, we address the question of the dependency of the software industry on the government expenditure, especially the Public Investment Program.
Therefore, we apply statistical analysis, having the turnover of the Greek Software Industry as the dependent variable, and examine its dependency on various macroeconomic and sector-specific variables. The main problem that we confronted with in data collection relating to the Software Industry is its indivisibility with its associated industries, namely the Information Technology industry and the Communication industry. Another obstacle was the absence of reliable data concerning the years before 2000, because, during that period, the sector was actually immature.
The outcome of the statistical analysis is quite revealing. The execution of a stepwise regression procedure resulted to the elimination of all the -under examination- independent variables, but the one representing the Public Investment
Greece……….dionysios georgopoulos & ioannis c. Demetriou
Revue des Sciences Économiques et de Gestion N°13 (2013)2 Program amount. This result allows for interesting conclusions and discussion about the future prospects of the Greek Software Industry.
Section 2 provides a detailed analysis of the Greek Software Industry. It explains the main characteristics of the industry and presents briefly the history of the Greek Software Industry. Moreover, Porter's five forces model enhances the analysis of the current market conditions of the sector. Section 3 gives an overview of the Greek Public Investment Program, its purpose and its relation to the EU funding. The European Regional Policy is outlined and the European Regional Policy towards Greece is stated. Also some data concerning the implementation of the Greek PIP over the last 15 years are presented. Section 4 by means of regression analysis investigates whether PIP is a significant factor of the software industry turnover, along with some other variables, mainly macroeconomic. The variables are theoretically justified and the steps of this analysis are explained. Section 5 examines the prospects of the software sector. A brief analysis of the current macroeconomic environment is made, followed by an analysis of the expansion prospects of the software industry to foreign countries. Moreover, the software industry's opinion about its future growth is analyzed, according to the results of an important research survey that was made among industry's executives. Section 6 presents concluding remarks and discusses on the possibility of future direction of this study, which was initiated by the MBA thesis of one of the authors [36].
2. The Greek Software Industry
An analysis of the Greek Software Industry is provided. Section 2.1 explains the main characteristics of the industry. The following two sections provide a brief history of the Greek Software Industry. At the last section, Porter's five forces model enhances the analysis of the current market conditions of the Information Technology sector.
2.1 Current Status
In general, the main problem that one faces in examining the software industry is its inseparability from the other two relative industries, in which it is embedded. One is the IT (Information Technology) industry, which includes hardware and software products, and the other one is ICT (Information and Communications Technology), which also encapsulates the communications sector and occupies an increasing part of the software production. The problem is biased on the fact that the majority of software production companies are also involved with the production and trade of hardware and communication products, like personal computers and mobile phones. However, there are various studies that attempt to isolate the software market from its relative ones. According to one of these [8], the global software market was estimated at 238.5 billion € in 2008. First country market in size is the USA with 105.6 billion €, which covers the 44.3% of the global market. Europe follows with 85.9 billion € (36% of the global market) and Japan, with 10.3%, and the rest of the world with 9.4% follow in distance. Moreover, market researches show that the global software market is the 23% of
Greece……….dionysios georgopoulos & ioannis c. Demetriou
Revue des Sciences Économiques et de Gestion N°13 (2013)3 the global IT market (1030 billion €) and just 10.9% of the global ICT market (2197.7 billion €). In Europe, the size of the three major markets, those of Germany, France and Great Britain, is about 60% of the total.
The size of the Greek software industry was estimated at about 1.111 billion € in 2008. Although there are no estimations for the years 2009-2011 from a reliable study, it is expected that the recession, which started in Greece in 2009 and has not finished yet, has not left the software industry unaffected. So, it would not be unrealistic if we estimate the current industry's turnover at approximately 1 bln €.
The major product category in Greece is Application Software [33] with about 88% of total turnover. System software is far behind with about 12% of total turnover. However, system software gains an increasing percentage of the total market (10.6% in 2006), which is a sign of the maturity of the domestic market. The major client-user categories are Private sector (21%), Public sector (20%), Bank and Insurance companies (18%) and Consumer software (12%).
In Greece, the majority of companies that sell software products are part of the IT sector, which includes, apart from software products, hardware products too (personal computers, servers and peripherals), either by producing or, mainly, by importing and selling-in.
Greek IT and software sector is fragmented. According to the Hellenic Statistical Authority, ELSTAT [2], in 2003 there were 4399 companies related to the sector. The total number of companies had an annual increase rate of 35%, since year 2000. However, it is estimated that the real market players are much less that the above number and reach about 400 companies, which still is a very large number, regarding the size of the domestic market. The top-ten of the Greek Software companies represent about 1/3 of the total market (34% in 2007). The top-five companies and their market share in 2007 are: 1. INFO-QUEST (approx. 6%), 2. INTRACOM IT SERVICES (approx. 5%), 3. ORACLE HELLAS (approx. 4%), 4. INTRALOT (approx. 3.5%) 5. SINGULAR LOGIC (approx. 3-3.5%).
2.2 History until year 2000
The first complete computer installation in Greece was done by IBM in August 1939 for the Greek Treasury [34]. The first application was for the Public Sector Pensions.
After World War II, the first organization that used IT machines was the Social Security Organization (IKA) in 1950, followed by the Bank of Greece, the National Bank of Greece and the Treasury. During the 60s, the Private Sector enters the IT field with the IBM 360/20 systems. During the 70s, when the transistor is presented and gave tremendous boost in the IT industry, Emporiki Bank was the first to use a system with the new technology, an IBM 370/145. After the year 1980, the changes are rapid. A landmark is the 22th May 1983, when the Olympic Airways reservation system initiated and fully functioned by Greek operators. Until mid-80s, the Greek Software industry was practically absent. There were no Greek companies, but only the large multinational companies, their
Greece……….dionysios georgopoulos & ioannis c. Demetriou
Revue des Sciences Économiques et de Gestion N°13 (2013)4 representatives and the -so called- service bureaux, an ancestor of today's outsourcing, which supported the banks and the social security organizations at the management of their applications, mainly payroll [9]. These programs had little in common with modern software. They were applications written in COBOL, RPG and PL1, still present until the year 2000. Moreover, the companies that supported those programs were taking advantage of their "black box" applications, achieving a great percentage of net profit, usually over 50%.
The decade between 1985 and 1995 is characterized by substantial changes to the sector globally. All countries realized that a durable strategic policy on the IT and High-Tech sectors was necessary and inevitable, in order to acquire a comparative advantage.
Having that in mind, most European, but also Asian and American, countries chose the establishment of Tech Towns, where universities, research institutes, public organizations and companies have common activities under favorable legal and investment conditions. The Tech Towns have been proved to be a catalytic factor towards the development of high technologies in a country. In Greece, the government chose the research institute model as the main factor of achieving high-tech comparative advantage. However, the research institutes were not continuously funded by national funds and, as a result, they turned to the development of EU research programs, undervaluing the cooperation with the companies.
The research institutes were used as a mechanism of fast absorbing the EU funds of the Integrated Mediterranean programs that were active at that period. However, their role remained the same even in the Community Operational Frameworks that came later (1st COF: 1989-1993, 2nd COF: 1994-1999, 3rd COF: 2000-2006). It is worth mentioning that the IT Integrated Mediterranean Program was funded with 20 billion drachmas (approx. 6.5 million €), which was then an enormous amount.
During that period, the global impact of the Personal Computer did not leave Greece uninfluenced. This was the key factor that resulted to the establishment of many Greek IT companies that were divided into two main company categories, depending on their activities: Companies that traded-in personal computers and peripherals; Software houses, whose sole activity was the production of enterprise and custom software.
The period from 1995 till the end of the century is characterized by the rapid growth of the industry. Large IT projects were started, aimed to the digitalization of the complex procedures of the public sector. A typical example was the TAXIS system, whose purpose was to simplify the taxing procedures. The advance payment given for that project is still the biggest one given for an IT project, more than 4 billion drachmas, approximately 12 million €. The Greek stock market boom had an impact on the industry, as there were many mergers, usually without a specific plan, but only to the direction of pleasing the shareholders. The following tremendous fall on the Greek Stock Market, together with the impact of the Dot-com bubble that came from the other side of the
Greece……….dionysios georgopoulos & ioannis c. Demetriou
Revue des Sciences Économiques et de Gestion N°13 (2013)5 Atlantic, forced the industry to realize that it had to be appropriately prepared for the first decade of the new century.
2.3 Status since year 2000
Although the circumstances did not seem very favorable at the beginning of the new century due to the Greek Stock Market fall and the American Dot Com Bubble, the sector continued growing during the years 2000 and 2001.
One of the main reasons was the great demand from many companies about system upgrades, in order that the transition to the new millennium to be smooth (Y2K bug). Moreover, the entrance of many companies from various sectors to the Greek Stock Market had, as a result, a great raise of their available funds. A part of these funds was invested by them to the modernization of their IT systems [6]. Another helping hand was the inevitable software upgrade of many client-companies, because of the adoption of the euro as the national currency, on January 2002. The sector growth came to a peak at year 2004, when the Olympic Games were hosted in Greece and a large number of IT related projects were implemented.
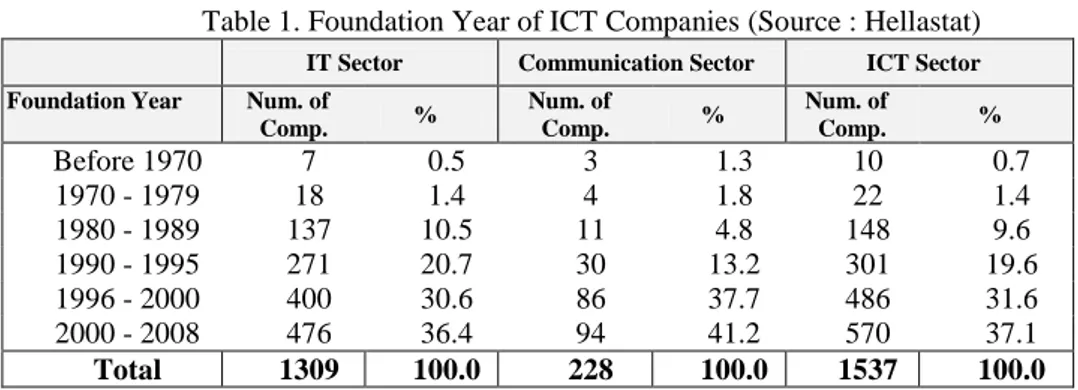
Another characteristic of the first years of the 00s was the establishment of new companies, in an even greater rate than that of the period before 2000. Table 1 [17] shows the total number of companies that were established during various periods between the year 1970 and the year 2008, concerning the ICT sector and the IT and Communications Sector separately. We can see immediately that the great majority of the Greek ICT companies were established during the last 15 years.
The period between the years 2005 and 2012 is split into two sub-periods. The first sub-period, 2005-2008, is characterized by the continuous and stable growth, especially during the last two years 2007-2008, when the 3rd COF came to its end and many co-funded IT projects were completed. The second sub-period 2009-2012, is characterized by the spread of the economic crisis to Greece and the continuous delays of the implementation of the National Strategic Reference Framework (NSRF). As a result, the sector turnover goes diminishing up to the present time, as there are great uncertainties about the conditions of the domestic and European economy. This is also depicted by the Turnover index of the Hellenic Statistical Authority (ELSTAT) about the "Computer programming, consultancy and related activities" (Code: J62 of NACE Rev.2), which is calculated every 3 months from the 2005 until today [4]. The data of this index is shown in Appendix A: Table 1: column labeled SST.
Greece……….dionysios georgopoulos & ioannis c. Demetriou
Revue des Sciences Économiques et de Gestion N°13 (2013)6 Chart 1 shows a graphical representation of the SST index.
Table 1. Foundation Year of ICT Companies (Source : Hellastat)
IT Sector Communication Sector ICT Sector
Foundation Year Num. of
Comp. % Num. of Comp. % Num. of Comp. % Before 1970 7 0.5 3 1.3 10 0.7 1970 - 1979 18 1.4 4 1.8 22 1.4 1980 - 1989 137 10.5 11 4.8 148 9.6 1990 - 1995 271 20.7 30 13.2 301 19.6 1996 - 2000 400 30.6 86 37.7 486 31.6 2000 - 2008 476 36.4 94 41.2 570 37.1 Total 1309 100.0 228 100.0 1537 100.0
Chart 1. Turnover index of the "Computer programming, consultancy and related activities" (Code: J62 of NACE Rev.2) (Source: ELSTAT [4])
0 20 40 60 80 100 120 140 160 180 200 2005 /1 2005 /3 2006 /1 2006 /3 2007 /1 2007 /3 2008 /1 2008 /3 2009 /1 2009 /3 2010 /1 2010 /3 2011 /1 2011 /3
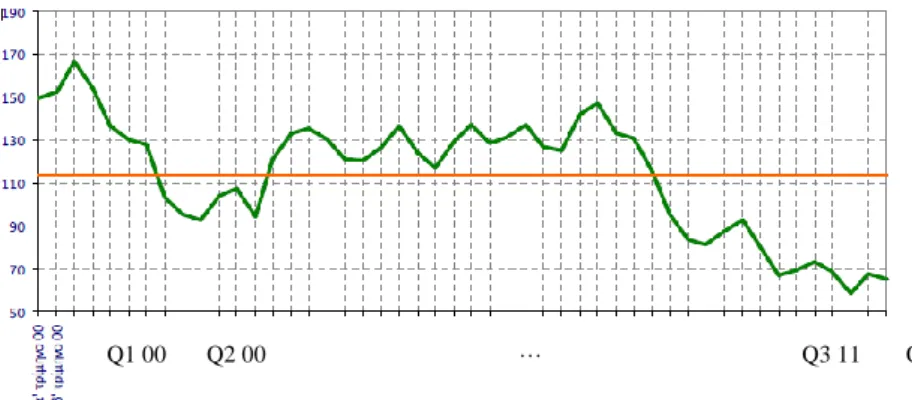
Another revealing picture of the sector's bad business climate is given by Chart 2 of the ICT Services Business Expectations index [11], which is quarterly calculated from year 2000 up to year 2011, by the Institute for Economic and Industrial Research (IOBE) and it is dependent on the 1) estimation of the company condition during the last 3 months, 2) estimation of the past demand during the last 3 months and 3) estimation of the future demand during the next 3 months. The index is at its lowest point since year 2000, revealing the difficult position of sector's companies as well as their pessimistic attitude relating to an uncertain future.
Greece……….dionysios georgopoulos & ioannis c. Demetriou
Revue des Sciences Économiques et de Gestion N°13 (2013)7 2.4 IT concentration
According to a study made by the Observatory for Information Society [16], in 2008 there were about 1400 companies whose main or secondary activity was related to the ICT sector. The majority of these (~85%) were related to the IT sector and the rest (~15%) to the Communications one. This results to a number of about 1200 IT companies, which makes it easy to conclude that the sector is fully fragmented, as the Greek market size is rather small for such a number.
Another indication of this, it is offered by the analysis of the personnel number of the ICT sector. The great majority of about 86% has a total personnel number that is below 50 employees, while only 1.9% of the ICT companies have more than 250 employees. Table 2 shows a distribution of ICT companies according to their total personnel number.
Table 2. ICT Companies Personnel (Source: Hellastat)
% Average Personnel ≤ 10 employees 41.2 6 employees 11-49 employees 45.0 23 employees 50-249 employees 11.9 93 employees ≥ 250 employees 1.9 568 employees* Total 100.0 34 employees
* OTE (Greek Telecommunications Organization) is not included
If we focus on the IT sector and the Communications sector separately, we can see that the above results are even worse for the IT sector, since an average IT company has almost half the personnel of an average Communications company (see Table 3).
Table 3. ICT Companies Personnel per Sector (Source: Hellastat)
Average Personnel
IT Sector 31 employees
Communications Sector 64 employees * OTE is not included
The geographic distribution of the ICT companies, as it is expected, is mainly around the capital area, about 80%. The rest 20% of the companies are
Q1 00 Q2 00 ··· Q3 11 Q4 11
Greece……….dionysios georgopoulos & ioannis c. Demetriou
Revue des Sciences Économiques et de Gestion N°13 (2013)8 distributed to the major Greek cities, where half of them, about 9.3%, are located in the Greek sub-capital, Thessaloniki (see Table 4).
Table 4. Geographical distribution of ICT sector (Source: Hellastat)
Headquarters Number of Companies %
Athens 1106 79.4
Thessaloniki 130 9.3
Rest of Greece 157 11.3
Total 1393 100.0
By following the classical Porter's five forces model we can distinguish the following reasonable explanations of the IT concentration. 1) Barriers to entry/exit: There are not many institutional or economic barriers in the domestic market. The capital amount needed for a new company to enter the market is low, according to the local market players. However, a factor that must be considered by anyone who intends to enter the market is the high mortality of the IT companies compared to the other sectors [8]. Two important ongoing changes are the use of Software as a Service (SAAS) and the spread of the Open Source Software, which is freely distributed through the Internet. Both of these factors are expected to change the rules and the format of the domestic market, as they are going to smash the last obstacles of the already globalized software market. Especially SAAS is considered as a major threat, since it is anticipated to make the installed Greek software useless, if the companies will not follow the trend and take position beside the choices and products that are provided by the large multinational IT companies. Nevertheless, there are historical examples, both on the global and the domestic market, which show that the key-word of success of new players to the sector is just innovation. The one who -continuously- provides an innovative product has the chance to succeed. 2) Availability of substitute products: There are not any substitutes of the software products, either on the standard products or the large software systems. The software market is fully globalized, giving the customers the possibility to make the best choice, without concern about the origin (domestic or imported) of the product. 3) Bargaining power of suppliers: The greater asset of the Software companies is their personnel, especially those with the special technical faculty and knowledge. Having that in mind, there is no significant pressure to the companies concerning the supply-demand of the technical personnel market. The domestic technical personnel has high-level education and skills, although there are often difficulties to find the proper combination of specialization and experience. An example of this is the executives which have the necessary combination of technical knowledge and sales experience. However, the economic crisis, together with the great raise of new graduates from the Greek Universities, has put a stop to the continuous raise on the salaries of the personnel. 4) Bargaining power of
buyers: The small size of the Greek market and the total fragmentation of the
Greek Software market make the latter a buyers' market. The buyers' power is enhanced by the late lasting economic crisis, which forces, both the Public and the Private sector, to seriously cut down expenses. As an investment in software is
Greece……….dionysios georgopoulos & ioannis c. Demetriou
Revue des Sciences Économiques et de Gestion N°13 (2013)9 usually considered of low priority, the result is the pressure to software demand which has resulted to deterioration of: the turnover of the software companies; the economic terms of all the maintenance contracts; the payment terms of the contracts, which affects the liquidity of the companies; and, overall a continuously diminishing profit margin for all sector's companies. 5) Competitive intensity: The competition is very intense, as it is naturally expected in a market which: is shallow and small, in terms of demand; is fragmented to many companies; faces tremendous pressure from the current economic crisis; and, its turnover depends mainly on the size of the Public Investments Program. The competition is focused on the great discounts on the software project competitions that are carried out by the Public Sector and the large companies of the Private Sector.
3. The Greek Public Investment Program
This section aims at providing an overview of the Greek Public Investment Program (PIP) and its relation to the EU funding. In Subsection 3.1, the definition of main terms and the purpose of the PIP is provided. In Subsection 3.2, the European Regional Policy is explained, while in 3.3 a detailed analysis of the European Regional Policy towards Greece is presented. The fourth subsection is devoted to the implementation of the Greek PIP over the last 15 years, while the last subsection explains the inability to raise the exact amounts of funds that were forwarded from PIP to the Software Sector.
3.1 Definition of PIP
The term "public investment" is used to describe all the investment activities of the Public Sector, in order to accomplish the economic growth policy that has been planned. The main aim of the public investments is the redistribution of natural wealth in favor of the social community [7]. Public investments are implemented by the Parliament, the ministries, the local authorities and the Public Organizations. The funding of these investments is covered through PIP.
PIP is the budget that determines the resources that can be provided to fund investment projects. It contains all the necessary expenditures that must be done in order major projects to be accomplished. These projects are mainly targeted on the economic growth and the improvement of country's infrastructure. PIP is created by the Ministry of National Economy or the Ministry of Development, following the proposals of other Ministries and Region authorities. It has an annual duration and is a part of the General Government Budget.
PIP is the most important mean used for the implementation of the economic growth policy of the country. Its projects mainly aim at contributing to the convergence of the country's regions and promote viable growth. The tools that are used to achieve these aims is the stimulation of demand, the enforcement of the employment rate, the support of the country's competitiveness and the promotion of the economic and social justice.
Greece……….dionysios georgopoulos & ioannis c. Demetriou
Revue des Sciences Économiques et de Gestion N°13 (2013)11 3.2 EU funding and European Regional Policy
Since the establishment of the European Union (formerly named as European Economic Community), the country members realized that, in order the European integration to be accomplished, it must be preceded by a common European Regional policy. The purpose of this policy would be the growth of the less developed regions of the European Community, in order to eliminate major inequalities in prosperity levels both between and within EU countries.
Regional inequalities can exist due to many reasons, including the longstanding handicaps imposed by geographic remoteness and the more recent social and economic change. Another source of inequality is the legacy of formerly centrally-planned economic systems, like those of the former communist countries [25].
Specifically, EU Regional policy aims at helping each region achieve its full potential and improve competitiveness and employment at regional level by investing in areas of high growth potential. Chart 3 displays the distribution of the regional funding to major categories.
24% 22% 22% 19% 13% Innovation Transport Human Resources Environment Others
Chart 3. How regional funding is used (Source: European Commission)
3.3 The European Regional Policy towards Greece
Greek regions have benefited from significant inputs of European funds [13, 14], since the first year that Greece joined the European Union, namely 1981. In 1986, the Integrated Mediterranean Programs (Hellas, Co-financed Development Programs (2011), http://www.hellaskps.gr) started, which are considered the first actual step towards substantial European Regional Policy. In 1988, decisions were taken towards the major reformation of the Community Structural Funds (CSF), which are:
the European Regional Development Fund (ERDF), the European Social Fund (ESF),
the European Agricultural Guidance and Guarantee Fund - Guidance Section (EAGGF Guidance Section) and,
the Financial Instrument of Fisheries Guidance.
The reformation was targeting on the coordination of the policies of the four CSFs and was scheduling a continuous raise of their funds. This led to the creation of the Community Operational Frameworks (COF), which are the weapons of structuring and acting the European Regional Policy.
Greece……….dionysios georgopoulos & ioannis c. Demetriou
Revue des Sciences Économiques et de Gestion N°13 (2013)11 The 1st Community Operational Framework started in 1989 and lasted till 1993. Its main characteristic was the dispersion of the available funds towards small infrastructure projects all over Greece. The main results were the improvement of the prosperity level in agricultural and border regions and the upgrade of the minor transport networks. Moreover, the 1st COF played a significant role to the modernization of the small agricultural companies and to the establishment of small and middle size hotels in many regions.
The 2nd Community Operational Framework started in 1994 and lasted till
1999. Its characteristic was the given emphasis in major infrastructure projects, which help the extroversion of the economy and the country's interconnection with the neighbor countries. The main aims were the improvement of country's competitiveness, the environmental upgrade, and the creation of better living conditions in the urban centers. However, during the 2nd COF, a series of problems and malfunctions appeared, due to the deficiency of the management and implementation operations of these large-scale interventions.
The 3rd Community Operational Framework lasted from 2000 till 2006. It was developed in order to be the main tool towards the achievement of the Lisbon strategy, an action and development plan devised in 2000, for the economy and the EU between 2000 and 2010. Its aim was to make the EU "the most competitive and dynamic knowledge-based economy in the world, capable of sustainable economic growth with more and better jobs and greater social cohesion" (European Union Parliament Website, Lisbon European Council 23 and 24 March Presidency
Conclusion, http://www.consilium.
europe.eu/uedocs/cms_data/docs/pressdata/en/ec/00100-r1en0.htm). The 3rd COF was split in 25 operational programs, 11 of them sectoral, 13 regional and one operational program of Technical assistance. The malfunctions of management and implementation were also present at this COF.
The 4th Community Operational Framework or, as it is officially named, the National Strategic Reference Framework (NSRF), constitutes the reference document for the programming of EU funds for the 2007-2013 period. The revised Lisbon Strategy and the National Reform Program for Development and Employment 2005-2008 were taken into account in developing the main strategic choices - priorities.
In order to avoid the problems of the previous COFs, the NSRF was split into 14 only operational programs, nine of them sectoral and five regional. However, five years after the beginning of the NSRF period and in the middle of a tremendous economic crisis that has led Greece into a 5-year recession, most of the NSRF funds are still frozen, because of the persisted management inefficiency by the Greek Public Sector.
Table 5 shows the EU and National Funds given for each COF, together with funds given by the Private Sector.
Greece……….dionysios georgopoulos & ioannis c. Demetriou
Revue des Sciences Économiques et de Gestion N°13 (2013)12
Table 5. Funding Table of the Co-funded growth programs in Greece (Source: Min. of Finance) Int.Med.p rogr.* (1986-1989) Thous.E CU** In 1986 value 1st COF (1989-1993) Thous.EC U In 1989 value 2nd COF (1994-1999) Thous.EC U In 1994 value 3rd COF (2000-2006) Thous.€ In 2000 value N SRF (2 007-2013) T hous.€ (e stim.) Total Budget 2,101,93 3 14,342,05 4 29,721,30 0 44,363,540 3 9,400,000 Nation. funds 695,740 5,802,196 7,069,900 11,126,075 1 1,500,000 EU funds 2,576,00 0 7,193,241 13,980,00 0 22,707,000 2 0,400,000 Private funds 210,193 1,346,617 8,671,400 10,730,465 7, 500,000 * The Int. Medit. Programs after the year 1989 where encapsulated into the 1st COF **1 ECU = 1 € (1/1/1999 exchange rate)
3.4 The Greek PIP over the years
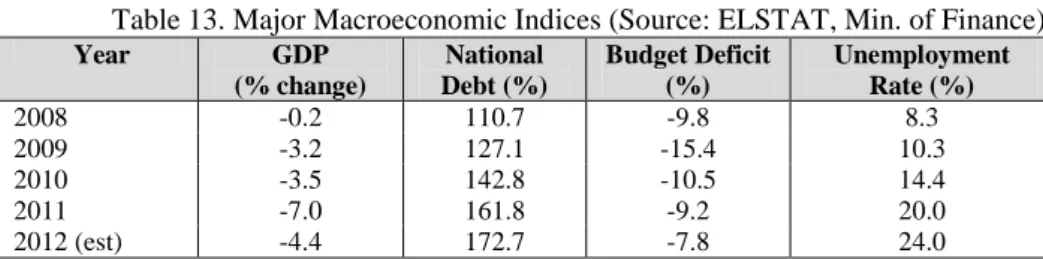
As was mentioned in the introduction of Section 3, PIP is part of the General Government Budget. Since the beginning of the COFs, PIP amounts are analyzed into those amounts of co-funded (with the EU) projects and those amounts of projects funded by national funds. Table 6 shows the distribution of PIP, from 1995 till 2012 (estimate). Except from the amounts of Programs funded with National and EU Funds and their relative percentage of the Total, the percentage change from the previous year is shown together with the PIP Percentage of the GDP. The data of Table 6 is better depicted in stacked column Chart 4, where the EU and the National fund contribution to the total PIP annual amount is shown.
Greece……….dionysios georgopoulos & ioannis c. Demetriou
Revue des Sciences Économiques et de Gestion N°13 (2013)13
Table 6. Greek PIP over the years (1995-2012) (Source: Min. of Finance)
Year
Public Investment Program (in million €) PIP Change % from the prev. year PIP Percentage of the GDP % Programs funded
with National funds
Programs co-funded with EU Total Amount % of Total Amount % of Total 1995 1,469 48,61 1,553 51,39 3,022 - 3.8 1996 1,147 35,69 2,067 64,31 3,214 6.4 3.7 1997 1,602 33,59 3,167 66,41 4,769 48.4 4.9 1998 1,497 27,17 4,012 72,83 5,509 15.5 5.2 1999 1,863 28,21 4,740 71,79 6,603 19.9 5.9 2000 2,109 28,42 5,312 71,58 7,421 12.4 6.1 2001 2,590 33,03 5,252 66,97 7,842 5.7 6.0 2002 3,131 44,64 3,883 55,36 7,014 -10.6 4.5 2003 3,974 47,11 4,461 52,89 8,435 20.3 4.9 2004 4,639 48,72 4,883 51,28 9,522 12.9 5.1 2005 2,569 34,14 4,955 65,86 7,524 -21.0 3.9 2006 2,673 32,66 5,511 67,34 8,184 8.8 3.9 2007 2,763 31,37 6,046 68,63 8,809 7.6 3.9 2008 2,559 26,59 7,065 73,41 9,624 9.3 4.1 2009 2,455 25,60 7,133 74,40 9,588 -0.4 4.1 2010 2,218 26,24 6,236 73,76 8,454 -11.8 3.7 2011 1,390 20,17 5,500 79,83 6,890 -18.5 3.2 2012 (est) 1,300 17,81 6,000 82,19 7,300 6 3.4
There are some noticeable points on the chart. First of all, we can distinguish two peaks of the PIP amount:
at year 2004, where Greece hosted the Olympic Games, a very large and complex project for the size of the country, which forced the government to spent a significant percentage of the PIP to large infrastructure and athletic construction projects.
at year 2008, which was the last year of fund payment by the 3rd COF.
The chart also depicts the continuous decline of the PIP funds after the year 2008, when Greece fell into the economic crisis from which still struggles to get off. This is more obvious if we look at the percentage of the PIP that is funded by National Funds. The percentage has fallen from the level of about 50% in 2004, to the current level of 18% (2012 estimation), within 8 years. The PIP funds was an easy way to save costs from the Government Budget, even though many insist that this cut down was (and is) one of the main reasons that makes Greece face the fifth year of economic recession, namely year 2012, and that the benefit from this cut was by far smaller compared to the losses.
The EU understood country's difficult position and, trying to help Greece consume more quickly the offered funds from the NSRF, decided in 2010 to lessen the percentage of the national funds on the co-funded projects, from 25% to 5%
Greece……….dionysios georgopoulos & ioannis c. Demetriou
Revue des Sciences Économiques et de Gestion N°13 (2013)14 [18]. Another important conclusion can be made by examining the time series of the PIP percentage of the GDP (see Chart 5). Following year 2000, the PIP percentage of the GDP followed an almost continuous decline, reached the level of 3% on year 2011, which is almost half to its peak on year 2000 (6.1%).
0 2 4 6 8 10 12 19951996199719981999200020012002200320042005200620072008200920102011 2012 (est )
EU Funds (bil.€) Greek Funds (bil.€)
0,0 1,0 2,0 3,0 4,0 5,0 6,0 7,0 19951996199719981999200020012002200320042005200620072008200920102011 2012 (est ) PIP % of the GDP
Chart 4. The Greek PIP over the years (1995-2012)
(Source: Ministry of Finance)
Chart 5. PIP Percentage of the GDP (1995-2012)
(Source: Ministry of Finance)
3.5 The Greek Software Industry and its funding from the Greek PIP
The Greek Software Industry has been being benefited from the Greek PIP, especially after the year 2000, during the 3rd COF and the NSRF implementation. However, it is difficult to calculate the amount of funds that were given to the sector's companies, during the PIP projects implementation, for various reasons.
First of all, the great majority of projects are usually complex. Their implementation needs expertise into different activities. This is the reason that most of the assignments are given to consortia of two or more companies, which cover the appropriate expertise, but, on the other hand, makes it impossible to split the given funds to the relative sectors. Both, 3rd COF and NSRF, have sectoral operational programs that are "targeted" on the Software sector, as for example the "OP Information Society" of the 3rd COF and the "OP Digital Convergence" of the NSRF. However, there is also heavy involvement of the sector companies to most of the rest sectoral and regional programs, which is due to the nature of the sector that can be involved in all aspects of the modernization of the public sector. Another major obstacle is that many companies, especially the major ones, have
Greece……….dionysios georgopoulos & ioannis c. Demetriou
Revue des Sciences Économiques et de Gestion N°13 (2013)15 various activities and not just ones related to software, like hardware of telecommunications.
Despite the difficulty of calculating the sector funding from the PIP, it is generally admissible that this funding was one of the main reasons of its rapid growth during the last 15 years, as we have already mentioned in Section 2[9].
4. The dependency of the Greek Software Industry on the PIP
In this section by means of regression analysis we investigate whether PIP is a significant factor of the Software industry turnover, along with some other variables, most of them macroeconomic. The steps to be followed were adopted by the traditional methodology (see, for example,[30, 19]).
4.1 Background on theory
Before we proceed to the statistical analysis, we explain some fundamental macroeconomic equations [32] that are related to various approaches of the Gross Domestic Product definition. These equations will be useful to establishing a suitable econometric model.
4.1.1 Three different approaches to GDP
Gross Domestic Product (GDP) can be determined in three different ways, all of which should, in principle, give the same result [26]. These are the product approach, the income approach and the expenditure approach, as we explain next.
The Product Approach of the GDP considers that GDP equals the market value of all final goods and services calculated during one year. GDP is given by equation
GDP= Total Gross Value Added
+ Taxes less Subsidies on products, (4.1)
where Gross Value Added is defined as the subtraction of the intermediate consumption to the total value of output (see equation (4.2)). The latter is defined as the addition of the value of the Total Sales of goods and services to the value of changes in the inventories (see equation (4.3)):
Gross Value Added = Value of Output –
Value of Intermediate Consumption (4.2)
Value of Output = Value of Total Sales of goods and services +
Value of changes in the inventories
(4.3)
The Income Approach of the GDP considers that GDP equals the sum total of incomes of individual living in a country during one year. GDP is given by the
Greece……….dionysios georgopoulos & ioannis c. Demetriou
Revue des Sciences Économiques et de Gestion N°13 (2013)16 GDP = COE + GOS + GMI
+ TP&M – SP&M,
(4.4)
where acronyms and explanations are as follows: COE stands for Compensation of Employees, GOS for Gross Operating Surplus, GMI for Gross Mixed Income, TP&M for Taxes on Production and Imports, SP&M for Subsidies on
Production and Imports.
The Expenditure Approach of the GDP considers that GDP is equal to the sum of all expenditure incurred by individuals during one year [20]. GDP, usually denoted by Y in this approach, is given by the equation
Y = C + I + G + (X–M), (4.5)
where acronyms and explanations are as follows. C stands for the private Consumption, also known as household final consumption expenditure, I for Investment, G for Government spending, which is the sum of government expenditures on final goods and services, while it includes salaries of public servants, the expenditure of PIP program and any investment expenditure by a government, X for Exports, M for Imports.
For simplicity purposes, we can assume that Government spending, G, equals the government expenditure on PIP and all the other expenditure on non-investment activities, so
G = PIP + Expenditure in other
(non-investment) activities. (4.6)
4.1.2 Relations between turnover and the variables under examination
In this section we investigate potential relations between a Software Sector company's turnover and various macroeconomic and sector-specific variables. Specifically, the macroeconomic variables that are examined are the Gross Domestic Product (GDP), the Public Investment Program expenditure (PIP), the Disposable Income (YD), the Average Labor Cost (ALC) and the Interest rate (i), whereas the sector-specific variable is the Broadband Connections Change (BRC). The extracted relations of the macroeconomic variables are based on the theory of the GDP definition approaches that were presented on the previous section, while the relation of the sector-specific variable is based on published researches about the Software sector.
Relation between Turnover and GDP
According to equations (4.1), (4.2) and (4.3) of the product approach definition of the GDP, we can see that the Value of Total Sales of goods and services is proportional to GDP at producer price
Value of total sales of goods and services ∝ ( 4.3) V alue of Output ∝ ( 4.2) G ross Value Added ∝ ( 4.1) G DP
Greece……….dionysios georgopoulos & ioannis c. Demetriou
Revue des Sciences Économiques et de Gestion N°13 (2013)17 Hence, the Value of total sales of goods and services, which is actually all the companies' turnover, is related to the GDP at producer prices. Moreover, this relationship is expected to be positive, which means that a raise of the turnover is expected to cause a raise at the GDP and vice versa. Hence, we can conclude that the Turnover is dependent on the GDP, so
Turnover = f(GDP), for some function f (4
.7)
Relation between Turnover and Public Investment Program (PIP)
From the equations (4.5) and (4.6) of the expenditure approach definition of the GDP, we can see that PIP expenditure is proportional to the GDP
PIP expenditure ∝ ( 4.6) G ∝ ( 4.5) GDP
Since in equation (4.7) turnover is positively related to GDP, it follows that Turnover is positively related to PIP.
Relation between Turnover and Disposable Income (YD)
As we previously saw, the income approach of GDP considers that GDP (Y) is equal to the National Income. However, the Disposable Income (YD) equals the National Income (Y) plus the Transfer Payments (TR) minus the taxes (TA),
YD = Y + TR – TA (4
.8) It follows, from equations (4.5), (4.7) and (4.8), that Turnover is positively related to the Disposable Income. Hence, Turnover is dependent on the YD, so
YD ∝ (4.8) Y ∝ (4.5) G DP ∝ ( 4.7) Turn over
Relation between Turnover and Average Labor Cost (ALC)
The Average Labor Cost (ALC) can be calculated from the division of the Total Compensation of all employees to the Total number of employees. Moreover, equation (4.4) of the income approach of the GDP showed that factor COE represents the Total Compensation of all Employees,
Average Labor Cost (ALC) =
Turnover Employees of Number Total Employees all of on Compensati Total ( 4.9) Hence, from equations (4.9), (4.4) and (4.7), we can conclude that the Average Labor Cost is related to the Turnover and this relation is expected to be positive, which means that a raise of the Average Labor Cost is expected to cause a raise of the Turnover. Hence, Turnover is a function of ALC
Greece……….dionysios georgopoulos & ioannis c. Demetriou
Revue des Sciences Économiques et de Gestion N°13 (2013)18 ALC ∝ ( 4.9) C OE ∝ ( 4.4) G DP ∝ ( 4.7) T urnover
Relation between Turnover and Interest Rate
According to the Keynesian theory of investment [31], there is a negative relationship between Investment (I) and interest rates (i), which means that a raise on the interest rates is expected to cause a fall on the Investment level. However, the expenditure approach of the GDP (see equation (4.5)) shows that Investment is part of the GDP. Hence and from the equations (4.5) and (4.7), we can conclude that the Turnover is negatively related to the interest rate. Accordingly, Turnover is dependent of the interest rate I, so if Interest Rate i increases, then Investment I decreases, so i ∝ I ∝ ( 4.5) G DP ∝ ( 4.7) Turnove r
Relation between Turnover and Broadband Connections
According to [6, 8], which are studies on the Greek Software Sector,the intrusion level of broadband connections to the Greek households is a significant factor for the growth of the sector, as it helps expanding its customer base. So, we can assume that there is a positive relation between the sector's turnover and the change in the Broadband Connections (BRC). Consequently, the Turnover of a software company is a function of BRC.
4.1.3 The Econometric Model
Having had discussed the relation between the critical factors of the Software Sector Turnover (in abbreviation, SST), we can conclude that SST is a function of Gross Domestic Product (GDP), Public Investment Program (PIP), Disposable Income (YD), Average Labor Cost (ALC), Interest rate (i) and Change on Broadband Connections (BRC). Based on the assumption that SST is locally linearly dependent upon the independent variables GDP, PIP, YD, ALC, i and BRC, the regression to be estimated is
1 2 3 4 5 6 7
SSTb b GDPb PIPb YDb ALCb i b BRCε( 4.10) where b1 is the intercept, and b2, b3, b4, b5, b6 and b7 are the slope
coefficients of the endogenous variables and, ε is the error that represents the exogenous factors which affect Software Turnover. The validity of linear regression model (4.10) is based on the usual basic assumptions in order to justify its use for prediction purposes: 1) linearity of the relationship between dependent and independent variables, 2) independence of the errors, 3) homoscedasticity of the errors, and 4) normal error distribution. Therefore, our main task in the
Greece……….dionysios georgopoulos & ioannis c. Demetriou
Revue des Sciences Économiques et de Gestion N°13 (2013)19 following sections is to perform a regression analysis, in order to estimate the values of the regression coefficients and to examine their statistical significance.
4.2 Data
There were various difficulties in collecting the data concerning the sales of the software sector. Some of them were noted in Section 2.1.3, like the inseparability between the two relative IT industries, hardware and software, and the continuous technological and business merger between the IT and the Communications sector. Another difficulty is that the Greek Software Sector industry has actually less than two decades of life, a fact that makes it almost impossible to find data about Software Sector's sales beyond past decade. Below, we explain the process of deriving the data that were used in our analysis and explain underlying relations between the variables.
4.2.1 Software Sector Turnover
Although there are various studies about the sector, most of them focus on the data of the last five years, in order to make predictions about its perspective. Therefore, in order to have as many observations as possible, we selected the quarterly index of the services sector, calculated by the Hellenic Statistical Authority (ELSTAT), and especially the one about NACE Rev.2 code J62: "Computer programming, consultancy and relative activities". The index has been calculated since the 1st Quarter of year 2005 and is based on the assumption that the index of year 2005 was 100[4].
The decision to select this quarterly index has advantages and disadvantages. An advantage is the ability to have 27 observations of the turnover index (Quarter 1 of 2005 till Quarter 3 of 2011), somehow necessary for a model that contains already six independent variables. However, because of the quarterly data, we were forced to include three dummy variables, Q1, Q2 and Q3, in order to
check the seasonal behavior of the index, which resulted in increasing the total number of the independent variables of the model to nine.
Hence, our analysis will make an attempt to isolate the independent variables that are significant to the estimation of the specific index. To the rest of the paper, Software Sector Turnover index will be denoted by SSTi. The data concerning SSTi were obtained from ELSTAT. They are presented in Appendix A, Table 1 and displayed in Chart 1.
4.2.2 Gross Domestic Product (GDP)
The quarterly data about Gross Domestic Product were taken from [5]. The GPD amounts were estimated according to the expenditure approach and were calculated at constant prices of year 2005. The GDP data are presented in Appendix A, Table 1 and in Chart 6. The Y-axis represents the Software Sector Turnover Index (SSTi), while the X-axis represents the GDP amount. The GDP data is measured in million €. The line fit has a positive slope as expected from theory.
Greece……….dionysios georgopoulos & ioannis c. Demetriou
Revue des Sciences Économiques et de Gestion N°13 (2013)21
SST i - GDP Scat t er Diagram Linear: R2 = 0,2641 0 20 40 60 80 100 120 140 160 180 200 40000 42000 44000 46000 48000 50000 52000 54000 56000
Chart 6. Scatter Diagram of SSTi against GDP (Source: Elstat)
4.2.3 Disposable Income (YD)
We were not able to find any quarterly data about Disposable Income. However, we took advantage of the annual ELSTAT data [3] and transformed the annual data into quarterly ones at constant prices by dividing the annual data by 4 and by dividing the result by the Consumer Price Index (CPI) that ELSTAT also publishes monthly. The results are shown in Appendix A, Table 1. The scatter diagram of SSTi against YD is shown in Chart 7. The Y-axis represents the Software Sector Turnover Index (SSTi), while the X-axis represents the YD amount. The YD data is measured in million €. The dispersion of the values on the diagram, which are confirmed by the low value of R2 of the trend line, reveal no actual trend.
SST i -YD Scat t er Diagram
Linear : R2 = 0,1205 0 20 40 60 80 100 120 140 160 180 200 42000,00 43000,00 44000,00 45000,00 46000,00 47000,00 48000,00 49000,00 50000,00 51000,00
Chart 7. Scatter Diagram of SSTi against YD (Source : Elstat)
4.2.4 Average Labor Cost (ALC)
The quarterly data about Average Labor Cost (ALC) were taken from ELSTAT and is shown in Appendix A, Table 1. The scatter diagram of SSTi against ALC is shown in Chart 8. The Y-axis represents the Software Sector Turnover Index (SSTi), while the X-axis represents the ALC amount. The ALC
Greece……….dionysios georgopoulos & ioannis c. Demetriou
Revue des Sciences Économiques et de Gestion N°13 (2013)21 data is measured in €. Linear and polynomial trend lines are presented. The graph of the polynomial line indicates increasing returns to ALC.
SST i- ALC Scat t er Diagram
P olynomial (Order: 3) : R2 = 0,4216 Linear: R2 = 0,2807 0 20 40 60 80 100 120 140 160 180 200 1200 1400 1600 1800 2000 2200 2400
Chart 8. Scatter Diagram of SSTi against ALC (Source : Elstat)
4.2.5 Interest Rate (i)
The interest rate data were taken from the European Central Bank [21]. We transformed this data to quarterly data by calculating the average interest rate of each quarter. The results are shown in Appendix A, Table 1. The scatter diagram of SSTi against Interest rate is shown in Chart 9. The Y-axis represents the Software Sector Turnover Index, while the X-axis represents the Interest rate (i) value. Notice that the slope of the line is the opposite of what it is expected according to theory, for it is positive instead of being negative.
SST i - Int erest Rat e Scat t er Diagram
Linear: R2 = 0,2486 0 20 40 60 80 100 120 140 160 180 200 0,00 0,50 1,00 1,50 2,00 2,50 3,00 3,50 4,00 4,50
Chart 9. Scatter Diagram of SSTi against Interest Rate (Source: ECB)
4.2.6 Public Investment Program (PIP)
The data concerning PIP expenditure at current prices were extracted from each Budget Execution Bulletin that the Ministry of Finance publishes at the end of each year's quarter [15]. In order to transform this data into PIP data at constant prices, we divided the data by the Consumer Price Index (CPI) that ELSTAT publishes every month. Moreover, we calculated the moving average of the four last quarters and use it as the PIP data in the estimation of our econometric model.
Greece……….dionysios georgopoulos & ioannis c. Demetriou
Revue des Sciences Économiques et de Gestion N°13 (2013)22 The reason for relying upon this technique is that usually there is a delay of one or two quarters by the time the government calculates a PIP expenditure till the time this expenditure is included to the financial statements of the relative company that PIP expenditure is given. The calculated PIP data are shown in Appendix A, Table 1. The scatter diagram of SSTi against PIP is shown on Chart 10, where the PIP data is measured in thousand €. The Y-axis represents SSTi, while the X-axis represents the PIP amount. The graph of the polynomial line indicates diminishing returns to PIP. SST i - P IP Scat t er Diagram P olynomial (Order : 2) :R2 = 0,3795 0 20 40 60 80 100 120 140 160 180 200 1400 1600 1800 2000 2200 2400 2600 2800 3000 3200
Chart 10. Scatter Diagram of SSTi against PIP (Source: Ministry of Finance)
4.2.7 Broadband Connections (BRC)
The data concerning the quarterly changes of total Broadband Connections were found from the annual reports of the Hellenic Telecommunications and Post Commission (EETT)[1]. The subjects of these studies were about the perspective of the Broadband Technology in Greece and the level of its penetration to the Greek households. The data is shown in Appendix A. The scatter diagram of SSTi against BRC is shown on Chart 11. The Y-axis represents SSTi, while the X-axis represents the BRC quarterly change in thousand connections. The line fit has a positive slope, as expected from theory.
SSTi - BRC Scatter Diagram
Linear : R2 = 0,3248 0 20 40 60 80 100 120 140 160 180 200 0 50 100 150 200 250
Greece……….dionysios georgopoulos & ioannis c. Demetriou
Revue des Sciences Économiques et de Gestion N°13 (2013)23 4.3 Estimation of the Econometric Model
4.3.1 The procedure
The econometric model (4.10) has six independent variables, or predictors, where five of them are macroeconomic, namely GDP, PIP, YD, ALC, and i, and one is a sector-specific variable (BRC).
In Section 4.2.1, we explained that the adoption of the ELSTAT Software Turnover quarterly index as the dependent variable of our model resulted to the addition of three dummy variables Q1, Q2 and Q3, which are used to represent each
year's quarter. As a result, equation (4.10) that represents our econometric model becomes 1 2 1 3 2 4 3 5 6 7 8 9 10 SSTi b b Q b Q b Q b GDP b PIP b YD b ALC b i b BRC ε 4.11 ( ) Our task, which is the major contribution of this work, is to examine and select among these nine independent variables, the statistically significant ones that are the best predictors. In order to eliminate the least significant variables, we apply a backward elimination process, which begins with all the predictors in the model and then, step by step, removes the least significant variable from the model until all remaining variables have individual P-values smaller than the chosen level of significance. According to [29], the advantage of this procedure over alternative ones is that it is possible for a set of variables to have considerable predictive capability even though any subset of them does not.
4.3.2 Results and Interpretation
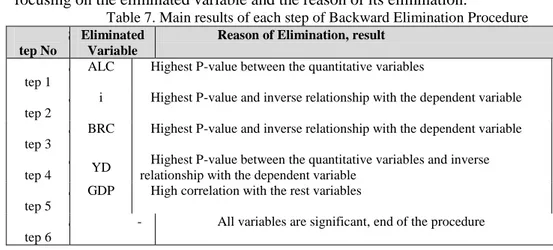
The backward elimination procedure was completed in six steps. The first five steps resulted in having one or more non-significant variables. In the sixth step, all the remaining variables, namely Q1, Q2, Q3 and PIP, were significant. We
avoid the detailed regression calculations that were based on the elimination process and present in Table 7 a short description of the result of each step, focusing on the eliminated variable and the reason of its elimination.
Table 7. Main results of each step of Backward Elimination Procedure
S tep No
Eliminated Variable
Reason of Elimination, result
S tep 1
ALC Highest P-value between the quantitative variables S
tep 2
i Highest P-value and inverse relationship with the dependent variable S
tep 3
BRC Highest P-value and inverse relationship with the dependent variable S
tep 4 YD
Highest P-value between the quantitative variables and inverse relationship with the dependent variable
S tep 5
GDP High correlation with the rest variables S
tep 6
Greece……….dionysios georgopoulos & ioannis c. Demetriou
Revue des Sciences Économiques et de Gestion N°13 (2013)24 The regression statistics of the sixth step, as calculated by the Regression Analysis Tool of Microsoft Excel, are shown in Table 8. The complete output is presented in Table 2 of Appendix A.
Table 8. Regression Statistics of the final step of the Backward Elimination Procedure
Multiple R 0.854 Standard Error 18.01
R Square 0.730 Observations 27
Adjusted R Square 0.681
We see that the Standard Error is 18.01. After estimating the predictors, our econometric model obtains the form
1 2 3
SSTi 59 85 56 16 Q. . 42 61 Q. 59 Q 0 038 PIP.
4.12) (
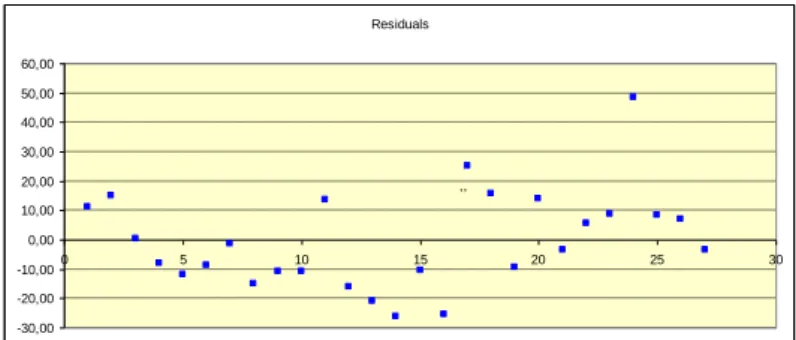
The regression statistics show that the Adjusted Coefficient of Determination (Adjusted R2) is equal to 0.681, which means that 68.1% of a change on the Software Sector Turnover index is caused by PIP and the seasonal variables Q1, Q2 and Q3. The residuals are shown on the Appendix A, Table 1
(Residuals) and the scatter diagram is in Chart 12. The residuals are distributed around zero with a slightly convex pattern. Moreover, a closer look at the Normal Probability Plot (see Chart 13) of the residuals shows a nearly linear pattern, but the deviations, especially to the last percentile, makes us doubt about the normality of their distribution. Moreover, Chart 14 of Observations vs. Predictions shows that there is a greater variation of the observations for the prediction range between 100 and 140, which also raises some doubt for the assumption of the errors homoscedasticity. Residuals -30,00 -20,00 -10,00 0,00 10,00 20,00 30,00 40,00 50,00 60,00 0 5 10 15 20 25 30 ,,
Greece……….dionysios georgopoulos & ioannis c. Demetriou
Revue des Sciences Économiques et de Gestion N°13 (2013)25
Normal Probability Plot
0 20 40 60 80 100 120 140 160 180 200 0 20 40 60 80 100 Sample Percentile Y
Chart 13. Normal Probability Plot of the Residuals
Observation vs Prediction 40 60 80 100 120 140 160 180 200 40,00 90,00 140,00 190,00 Predictions O bs erva ti ons
Chart 14. Scatter Diagram of Observations vs Predictions
Equation (4.12) reveals the dependency of the Software Sector Turnover on the Public Investment Program expenditure. According to the relative regression coefficient (0.038), a raise of 1 billion € on the PIP Program moving average expenditure is expected to raise the Software Sector Turnover index by 38 units (0.0381000 million as PIP variable is in million €). Moreover, (4.12) shows that there is a seasonal variation of the Software Sector Turnover Index, as all the dummy variables that represent each year's quarters (Q1, Q2, Q3 ) were significant.
According to their calculated coefficients, the year's quarter which is expected to have the greatest turnover index is the 4th one. The 1st quarter is expected to have a smaller index than the 4th one at a rate of 56.16 units, the 2nd is expected to have a smaller index at a rate of 42.61 units, while the 3rd one is expected to have a smaller index at a rate of 59 units. The intercept b0 was also found to be a
Greece……….dionysios georgopoulos & ioannis c. Demetriou
Revue des Sciences Économiques et de Gestion N°13 (2013)26 Turnover index potential, with zero PIP expenditure, is 59.85 units at the 4th quarter of each year.
4.4 Forecasting
We are going to use the calculated model in order to check its forecasting capability on the Software Sector Index for the 4th quarter of 2011 and the four quarters of year 2012.
Although we have the actual value of the PIP variable for the last quarter of year 2011, the actual values of year 2012 were prior to our study. Thus, we are going to estimate the PIP values of the four quarters of year 2012, in order to forecast the desired Software Sector Index. We assume that the distribution of the annual PIP expenditure at the four quarters follows a pattern similar to that of year 2011. The annual PIP expenditure of 2012 is expected at the level of 7300 million €. Accordingly, Table 9 displays the expected expenditure of PIP during 2012.
Table 9. Expected PIP Expenditure (Amounts in Million €)
2 011 Percent. of Total 201 2 est. Q 1 6 77 10,25% 748 Q 2 1 454 22,00% 160 6 Q 3 1 401 21,20% 154 6 Q 4 3 076 46,58% 340 0 T otal 6 608 100,00 % 730 0
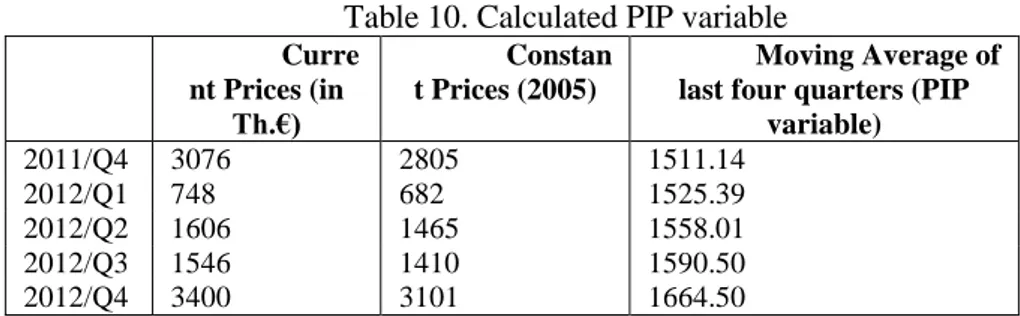
We apply the approach of the past data of PIP expenditure and we reduce the estimated amounts into constant prices of 2005. Since the inflation rate in Greece is expected to be around zero, we divide each amount by ELSTAT Price Index of December 2011, namely 109.63. Then, we calculate the moving average of the last four quarters. The results are presented in Table 10.
Table 10. Calculated PIP variable Curre nt Prices (in Th.€) Constan t Prices (2005) Moving Average of last four quarters (PIP
variable) 2011/Q4 3076 2805 1511.14 2012/Q1 748 682 1525.39 2012/Q2 1606 1465 1558.01 2012/Q3 1546 1410 1590.50 2012/Q4 3400 3101 1664.50
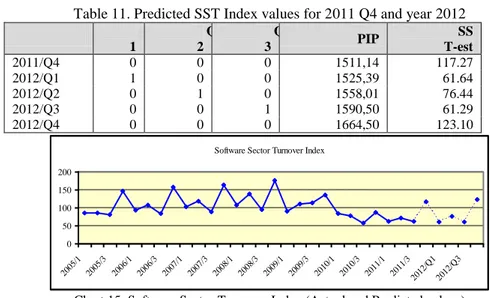
Hence, we are about to forecast the SST Index for the last quarter of 2011 and all the quarters of year 2012, by applying the above PIP values to our econometric estimation model, i.e. equation (4.12). The predicted index values are
Greece……….dionysios georgopoulos & ioannis c. Demetriou
Revue des Sciences Économiques et de Gestion N°13 (2013)27 in Table 11 and the graphical representation of the SST index from 2005Q1 till 2012Q4 is portrayed on Chart 15, where the dotted line indicates the predicted values. An immediate explanation is that the index is expected to follow during 2012 the general pattern of year 2011, since there are no radical changes on the PIP expenditure among these years.
Table 11. Predicted SST Index values for 2011 Q4 and year 2012
Q 1 Q 2 Q 3 PIP SS T-est 2011/Q4 0 0 0 1511,14 117.27 2012/Q1 1 0 0 1525,39 61.64 2012/Q2 0 1 0 1558,01 76.44 2012/Q3 0 0 1 1590,50 61.29 2012/Q4 0 0 0 1664,50 123.10
Software Sector Turnover Index
0 50 100 150 200 2005 /1 2005 /3 2006 /1 2006 /3 2007 /1 2007 /3 2008 /1 2008 /3 2009 /1 2009 /3 2010 /1 2010 /3 2011 /1 2011 /3 2012 /Q1 2012 /Q3
Chart 15. Software Sector Turnover Index (Actual and Predicted values)
4.5 Using the Model for Policy Purposes
The use of our econometric model may be a useful tool for the software sector's managers, in order to estimate the sector's turnover index and, depending on the results, take the appropriate decision.
Primarily, the results revealed a dependency of SSTi on PIP, along with seasonality. Indeed, the substantial fall of PIP expenditure during the last three years 2009-2011 resulted to an analogous fall of SSTi, indicating that a change on PIP expenditure has an immediate impact on the software sector's turnover.
A process that makes use of our econometric model may well be useful to policy reasons. For example, a software sector executive may be helped by applying our model to the turnover of his company, in order to examine its dependency on PIP. If the latter is proved, then actions could be taken on either of the following directions:
1. Make a thorough analysis of the macroeconomic environment and EU regional policy, in order to make right predictions of the PIP expenditure development in the upcoming years, so that the company be prepared and take pre-active measures,
2. Make proper decisions in order to break the exclusive dependency of his company on PIP.