O
pen
A
rchive
T
OULOUSE
A
rchive
O
uverte (
OATAO
)
OATAO is an open access repository that collects the work of Toulouse researchers and
makes it freely available over the web where possible.
This is an author-deposited version published in :
http://oatao.univ-toulouse.fr/
Eprints ID : 14065
To link to this article : doi:
10.1149/2.080311jes
URL :
http://dx.doi.org/10.1149/2.080311jes
To cite this version : Laurino, Adrien and Andrieu, Eric and Harouard,
Jean-Paul and Lacaze, Jacques and Lafont, Marie-Christine and
Odemer, Grégory and Blanc, Christine Corrosion Behavior of 6101
Aluminum Alloy Strands for Automotive Wires. (2013) Journal of The
Electrochemical Society, vol. 160 (n° 11). pp. C569-C575. ISSN
0013-4651
Any correspondance concerning this service should be sent to the repository
administrator:
[email protected]
Corrosion Behavior of 6101 Aluminum Alloy Strands
for Automotive Wires
Adrien Laurino,a,bEric Andrieu,aJean-Paul Harouard,bJacques Lacaze,a
Marie-Christine Lafont,aGregory Odemer,aand Christine Blanca,∗,z
aUniversit´e de Toulouse, CIRIMAT, UPS/CNRS/INPT, 31030 Toulouse Cedex 04, France bLEONI WIRING SYTEMS FRANCE, 78180 Montigny-le-Bretonneux, France
Microstructural states produced by each step of the manufacturing process leading to the production of automotive strand arms in 6101 aluminum alloy (AA6101) for wiring harnesses were investigated in relation to their corrosion behavior in NaCl solution. The observed corrosion morphology, i.e., pitting corrosion or intergranular corrosion, was strongly dependent on the precipitation state,
i.e., mainly the presence of intergranular Mg2Si precipitates. A ‘grain size – corrosion resistance’ relationship was also evidenced with an ennoblement of the corrosion potential for wires heavily cold drawn, which were characterized by a nanometric grain size. Dislocation density as well as the homogeneity of alloying element distribution were also found to be relevant parameters for explaining the electrochemical behavior of each microstructural state. Plastic deformation and recrystallization phenomena occurring during the manufacturing process were found to be associated with redistribution of alloying elements, which impeded the formation of intergranular Mg2Si precipitates. Therefore, in the present study, the cold drawing process was found to increase the intergranular corrosion resistance of AA6101.
DOI:10.1149/2.080311jes
Car manufacturers have developed different solutions to reduce both the cost and weight of vehicle wiring harnesses. One innovative solution is the substitution of copper wires by aluminum alloy wires. Aluminum alloy wires are already used for electrical applications such as high power cables. However, automotive wires require smaller di-ameter strands. Consequently, aluminum rod is drawn to obtain small diameter strands (about 0.5 mm). The thermomechanical process used to manufacture the strand arms consists of several cold-drawing steps with intermediate aging heat treatments. During service, wiring har-nesses are submitted to mechanical loading, temperature fluctuations and exposure to various media, such as de-icing salt, which can lead to corrosion damage. Obviously, the corrosion behavior of the harness depends on parameters such as the geometry of the harness (number of strand arms and the space between them) and the intrinsic corrosion behavior of each wire strand. Therefore, improvement of the process and product requires an understanding of the relationship between the manufacturing process and the corrosion behavior of the individual wire strand. Each step in the thermomechanical process modifies the microstructure of the strand and, consequently, its corrosion behavior, so we have evaluated the influence of each step of the manufacturing process on the corrosion behavior of the wire strand.
In this study, the material used to manufacture the strands was a 6101 T4 aluminum alloy. This is an Al-Mg-Si-Fe alloy with structural hardening resulting from β-Mg2Si precipitation1–12according to the
following precipitation sequence:
α(SSS) → atomic clusters → GP zones → β′′→
β′
→β −Mg2Si (stable)
where SSS means supersaturated solid solution and GP refers to Guinier Preston zones. The presence in the matrix of clusters, of GP zones, β′′, β′and β phases depends on the thermomechanical
treat-ment applied to the material. Coarse intermetallic particles can also be observed in the aluminum matrix. The main intermetallics present in Al-Mg-Si-Fe alloys are Fe-rich particles such as Al3Fe, α-Al8Fe2Si,
β-Al5FeSi and π-Al8FeMgSi6,1,13–15and Mg2Si precipitates.16
The Al-Mg-Si (6xxx series) alloys are generally known as corro-sion resistant alloys. However, alloying and thermomechanical treat-ment can generate susceptibility to pitting corrosion and intergranular corrosion13with corrosion often initiated on coarse intermetallic
parti-cles. Blanc et al.17have demonstrated using interferometry and surface
observations that Mg2Si particles suffer preferential Mg dissolution
E-mail:[email protected]
after a few seconds of immersion in aggressive media, in agreement with other authors.18,19Preferential initiation of corrosion was then
ob-served at Mg2Si sites.17Eckermann et al. have considered that these
particles are not preferential sites for pitting corrosion initiation after de-alloying.18The Al-Fe-Si precipitates are cathodic with respect to
the aluminum matrix.15,20During immersion in an aggressive media,
galvanic cells are created between these intermetallics and the matrix to initiate the dissolution of the surrounding matrix.21
Studies focused on Al-Mg-Si alloys with copper have shown that they are susceptible to IGC. Several authors have considered that the susceptibility to IGC of these alloys was due to an extensive precipitation at grain boundaries of Cu-rich precipitates, namely the Q-Al4Mg8Si7Cu2phase.22,23Hereby, Yamaguchi and Tohma showed
that IGC of Cu-containing Al-Mg-Si alloys was caused by a pref-erential dissolution of very reactive Mg2Si precipitates at grain
boundaries.24 Svenningsen et al. determined that Cu-free Al-Mg-Si
alloys would not be susceptible to IGC and that IGC of Al-Mg-Si alloys would be avoided if the Cu-content was below the critical value of 0.1 wt%.22,25–27These authors considered that β-Mg
2Si
pre-cipitates, which are the only intergranular precipitates present in low Cu-content alloys, could not be responsible for IGC susceptibility and that only Cu-rich particles could introduce IGC susceptibility.26
However, Bhattamishra and Lal observed IGC for Cu-free 6xxx se-ries alloy and explained their observations on the basis of the activity of Mg2Si at grain boundaries.28 Moreover, they demonstrated that
IGC susceptibility of Cu-free 6xxx alloys increased with aging treat-ment which was explained by the formation of Mg2Si precipitates at
grain boundaries. It is generally agreed that the IGC susceptibility of Al-Mg-Si alloys is reduced by over-aging since this heat-treatment favors the precipitation of coarse precipitates both in the matrix and at grain boundaries.25,26,29This microstructural evolution leads to the
depletion in the matrix of some alloying elements. The difference in corrosion potential between the precipitate free zone (PFZ) and the matrix is reduced, thereby decreasing the susceptibility to IGC of the alloy. Several authors have discussed the influence of mechanical de-formation, such as extrusion, on IGC susceptibility of 6xxx alloys. They showed that corrosion damage was confined to the recrystal-lized layer.25,30 However, the effect of mechanical deformation on
precipitation and consequently on the corrosion behavior has not been considered.
The present paper is probably the first scientific study of the cor-rosion of aluminum wires for automotive applications. The corcor-rosion behavior of Cu-free AA6101 (Cu content < 0.02 wt%) was investi-gated for each metallurgical state from the first part of the wire draw-ing process used to manufacture strands. The aim was to explore the
Table I. Chemical composition (weight%) of AA6101.
Element (wt%)
AA6101 Al Mg Si Fe Cu Mn
balance 0.48 0.47 0.13 0.017 0.0021
influence of the thermo-mechanical history on the corrosion behavior. The microstructure of all samples studied was characterized using optical microscopy (OM), scanning electron microscopy (SEM) and transmission electron microscopy (TEM) and their mechanical prop-erties were evaluated. Their corrosion behavior was studied using conventional electrochemical techniques combined with observations of the sample surface after the corrosion tests.
Experimental
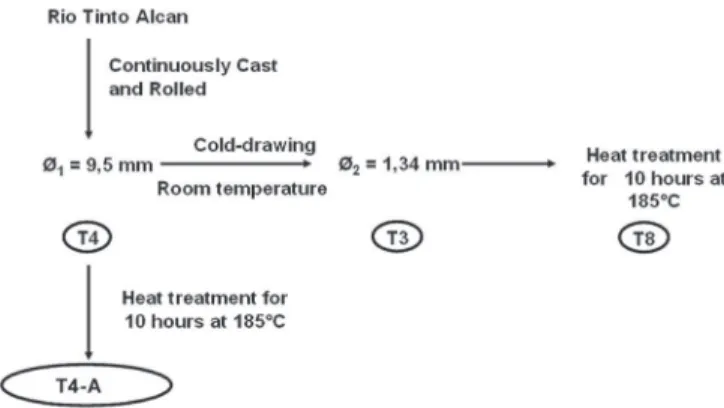
Materials.—The chemical composition of the AA6101 alloy is given in TableI. It was provided by Rio Tinto Alcan as a 9.5 mm di-ameter wire rod made by continuous casting and rolling. This process was followed by water quenching and natural aging to the T4 met-allurgical state. The strands were made by a multistep cold drawing process performed by SASA Tr´efil’Alu from the T4 wire rod. The first step consisted of cold-drawing at room temperature to make a 1.34 mm diameter strand. This corresponded to the T3 temper. The second step was a heat-treatment for 10 hours at 185◦
C providing a T8 temper. Further steps consisted of cold drawing and aging treatments to obtain a 0.51 mm diameter strand in the T9 state. In this study, only the first steps of the process were studied, which corresponded to the T4, T3 and T8 metallurgical states. Considering the first step of this forming process, the influence of cold working (T3 temper) on the corrosion behavior of AA6101 can be discussed. Considering the second step (T8 temper), the influence of both cold drawing and aging treatment on the corrosion behavior of AA6101 can be investigated. To understand the influence of heat-treatment only, some T4 samples were aged at 185◦C for 10 hours in the laboratory in an air circulation
furnace. These specimens were denoted as T4-A for T4 + Aging. Figure1summarizes the first steps of the forming process and the metallurgical states considered in the present work.
Corrosion tests.—For electrochemical measurements, the experi-mental set-up consisted of a three-electrode electrochemical cell with a large surface area platinum electrode used as a counter electrode and a saturated calomel electrode (SCE) with a Lugin capillary as a reference electrode. All potentials are relative to the SCE reference. The working electrode corresponded to specimens of AA6101 alloy in the previously described metallurgical states. T4 and T4-A samples were machined from the 9.5 mm diameter rod; they were embedded in an epoxy resin with the transverse section exposed to the electrolyte (surface area corresponding to a 9.5 mm diameter disk). For T3 and
Figure 1. Forming process of the AA6101 strands.
T8 samples, the same preparation was used with a surface area of 1.34 mm diameter. Before all corrosion tests, the surface of the spec-imen was mechanically abraded with 4000 grit SiC papers and then polished to 1 µm grade with diamond paste and distilled water as lubricant.
Open circuit potential (OCP) measurements were performed with a test duration of 2 hours. Potentiokinetic polarization experiments were conducted from the potential of −850 mV / SCE to the highest potential of −600 mV / SCE. The potential scan rate was 500 mV.h−1.
The electrolyte used for both electrochemical tests was a 0.5 M NaCl solution at room temperature, open to air and stirred. Solutions were prepared by dissolving Normapur chemical salts in distilled water.
Microstructural observations.—After each electrochemical test, the sample surface was observed and the corrosion damage was char-acterized using an Olympus PMG3 optical microscope. This micro-scope was also used to characterize the microstructure of the samples after electrochemical etching. For the T4 metallurgical state, electro-chemical etching was repeated twice for 40 s with 3.5 vol% HBF4
in distilled water at 20 V at room temperature. For the T4-A sam-ples, chemical attack was performed for 40 seconds using 5 mL of 40% hydrofluoric acid diluted in 995 mL of distilled water to reveal the grain structure of the samples. Samples were examined using a LEO-435-VP scanning electron microscope (SEM) combined with Energy Dispersive Spectroscopy (EDS) with an accelerating voltage of 15 kV. The coarse intermetallics in AA6101 for the different met-allurgical states were examined and identified. Transmission electron microscopy (TEM) observations with a JEOL-JEM-2010 microscope provided complementary data on the AA6101 microstructure. The TEM samples were obtained by cutting 280 µm thick slices. Then, the slices were ground down to about 100 µm thick and a dimple was machined in the central region. Final electron transparency was obtained by ion milling on a precision ion polishing systems (PIPS, Gatan) using 5 kV Ar+
ions.
Differential thermal analyzes (DTA) were performed using a Se-taram Setsys 16/18. Samples were heated to 610◦
C at 10 K.min−1. Mechanical tests.—Vickers hardness measurements with a 100 grams loading were performed on both transverse and longi-tudinal sections.
Results and Discussion
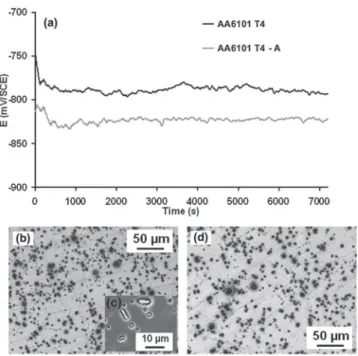
Influence of aging treatment on the corrosion behavior of AA6101.—Figure2ashows that the OCP measured for the T4 sam-ples in a 0.5 M NaCl solution rapidly stabilized at a value of −790 ±5 mV / SCE, after 200 seconds, whereas OCP for T4-A specimens was shifted to a lower value of −820 ± 5 mV / SCE. OM and SEM observations of the electrode surfaces after the OCP tests only showed matrix dissolution around coarse particles for both metallurgical states (Figures2b,2cand2d).
SEM observations and combined EDX analyzes allowed the coarse particles to be identified as Al-Fe-Si particles for T4 and T4-A sam-ples. At this scale, no difference was observed between the two con-ditions. The coarse particles were spherical with an average diameter of 3–4 µm or plate shaped with average dimensions of 4–5 µm x 1 µm. As a result of mechanical rod rolling, they were aligned along the direction of plastic deformation (Figure3), as previously found.31
Figures4a,4cand4eshow the TEM observations of the coarse par-ticles allowing three kinds of particle to be identified in the matrix of AA6101 T4 samples in agreement with the results of Belov et al.1 The same result was obtained for T4-A, T3 and T8 conditions.
Figure4bis the associated selected area diffraction pattern analysis of a coarse precipitate with a ratio Fe/Si of 1. It corresponded to the Al9Fe2Si2compound characterized by a tetragonal crystal
struc-ture (a = b = 0.615 nm, c = 2.08 nm);32 this compound has also
been reported as the β-Al5FeSi phase by Belov et al.1 As shown by
Figure4d, the second type of coarse precipitates, with a ratio Fe/Si equal to 2, was a Al17(Fe,Mn)4Si2compound (cubic, a = 1.256 nm).32
Figure 2. (a) OCP measurements of AA6101 T4 and T4-A in a 0.5M NaCl
solution (b) OM observations of the T4 samples after OCP (c) SEM observa-tions of the T4 samples after OCP: zoom on intermetallic particles (d) OM observations of T4-A metallurgical state after OCP.
Figure4fshowed that the third type of coarse precipitates, with a ratio Fe/Si of 2, was a Al7Fe2Si compound (hexagonal, a = b = 1.2401 nm,
c = 2.634 nm)32corresponding to the α-Al
8Fe2Si phase.1Figures2b,
2cand2drevealed that all the Al-Fe-Si particles showed the same corrosion behavior and acted as cathodic sites promoting oxygen re-duction reaction followed by an associated local pH increase15,20,21
and then the dissolution of the surrounding matrix.33–35
Figure5ashows typical current-potential curves for the four met-allurgical states. Measurements were repeated at least five times for each metallurgical state; the scattering for the corrosion potential val-ues was evaluated to ± 5 mV. The results showed that the shape of the curves was the same independent of the metallurgical state. The cathodic part was characterized by a well-defined plateau due to oxy-gen reduction with a current density of 3 (± 1) x 10−5A.cm−2. Above
the corrosion potential, the anodic current density increased rapidly showing that the samples were susceptible to localized corrosion at their corrosion potentials. Comparison of the curves plotted for the T4 and T4-A samples showed that the 185◦
C - 10 hours aging led to a decrease of the corrosion potential of AA6101, in good agreement with the OCP measurements. Moreover, the anodic current density measured for the T4-A sample was higher than for the T4 specimen suggesting that the susceptibility to localized corrosion increased
af-Figure 3. SEM observations of the microstructure of AA6101 T4 in transverse
plane.
Figure 4. TEM observations of the microstructure of AA6101 T4
(a) Al9Fe2Si2 compound (b) selected area diffraction pattern analysis of Al9Fe2Si2 compound (c) Al17(Fe,Mn)4Si2 compound (d) and (d′) selected area diffraction pattern analysis of Al17(Fe,Mn)4Si2compound (e) Al7Fe2Si compound (f) and (f′) selected area diffraction pattern analysis of Al7Fe2Si compound.
ter the aging treatment with increased corrosion damage. Optical and SEM observations of the electrodes after the potentiokinetic polariza-tion tests showed aluminum matrix dissolupolariza-tion around coarse particles and pitting corrosion for the T4 samples. Around the pit cavities, many fine corrosion filaments were observed (Figure5b) as already shown for aluminum alloys containing Al3Fe particles.36For the T4-A
sam-ples, intergranular corrosion, IGC, was also observed (Figure5c). TEM observations of T4-A samples revealed needles (average dimension = 35 nm x 140 nm) or spherical shaped precipitates ar-ranged along the grain boundaries (Figure6a). EDX and selected area diffraction pattern analyzes identified these intergranular precipitates as Mg2Si particles (cubic, a = 0.635 nm). A precipitate free zone
(PFZ) was also clearly visible with needle shaped hardening precip-itates observed at a distance of about 100–120 nm from the grain boundaries. The AA6101 T4 specimens did not show hardening or intergranular precipitates (Figure6b). Due to their size, the hardening precipitates observed for T4-A samples could not be identified by EDX analysis or selected area diffraction pattern analysis. Therefore, DTA was performed to help to identify the precipitation state.
Figure7compares the DTA curve obtained upon heating of T4-A samples and that obtained for a T4 specimen. On the vertical axis, arbitrary units were used allowing the DTA signals to be shifted. For the T4 samples, the DTA curve showed two strong exothermic pre-cipitation peaks. The first peak, between 250◦
C and 350◦
C, is very broad showing that it can be separated in two peaks marked A and B respectively at 270◦
C and 310◦
Figure 5. (a) Current-potential curves of the AA6101 T4, T4-A, T3 and T8
samples in a 0.5 M NaCl solution. Scan rate = 500 mV. h−1. SEM obser-vations after polarization tests of (b) the T4 samples (c) the T4-A samples. OM observations after polarization tests of (d) the T3 samples and (e) the T8 samples.
Figure 6. (a) TEM observation of a grain boundary of the AA6101 T4-A
microstructural state (b) TEM observation of a grain boundary of the AA6101 T4 sample.
Figure 7. DTA curves for the AA6101 T4, AA6101 T4-A, AA6101 T3 and
AA6101 T8 samples. The baseline is plotted for more clarity.
peak, at 430◦
C, is marked C. One dissolution arrest marked D is also observed. Referring to the literature data related to the metallurgy of 6xxx alloys, the three exothermic peaks A, B and C are respectively attributed to the precipitation of β′′
, β′
and β particles.1–9The presence
of these three peaks on the DTA curves confirmed that these precip-itates were not present in the T4 sample, in agreement with TEM observations. Concerning the T4-A specimen, DTA curve presented a very small exothermic peak marked A′
at 230◦
C and two other peaks, with a much higher intensity, marked B′
and C′
, respectively at 310◦
C and 430◦
C. One dissolution arrest marked D′
was also observed. A′
, B′ and C′ peaks were attributed respectively to the precipitation of
β′′, β′and β phases. The very low intensity of A′ peak showed that
β′′precipitates were already present in the T4-A sample, i.e. that the
aging treatment had favored the precipitation of β′′ phase from GP
zones present in the T4 metallurgical state. Therefore, the first step of the precipitation sequence, from GP zone to β′′phase, was already
nearly complete in this case. On the contrary, the presence of strong exothermic peaks B′
and C′
, corresponding to the formation of β′
and βphases, suggested that the precipitation process of β-Mg2Si was not
complete after aging treatment for 10 hours at 185◦
C, in agreement with literature data.11Therefore, the hardening precipitates observed
for the T4-A sample were identified as β′′
precipitates for the major part, with maybe some β′
precipitates.
TEM observations were well-correlated with the mechanical prop-erties measured for T4 and T4-A specimens (TableII). The higher hardness values measured for T4-A samples compared to those for T4 specimens were in good agreement with the presence of β′′
precipi-tates in the T4-A matrix while no hardening precipitate was observed for T4 samples. Concerning the corrosion behavior of AA6101 alu-minum alloy, the presence of Mg2Si intergranular precipitates could
explain the susceptibility to IGC of the T4-A samples. This confirms that, for Cu-free 6xxx aluminum alloys, Mg2Si intergranular
precip-itates are anodic sites at grain boundaries promoting the propagation of IGC as reported by several authors24–28and helps to give an
an-swer to the controversy existing in the literature. This supports the data of Buchheit that showed that the corrosion potential of Mg2Si
precipitates was about −1600 mV / SCE in NaCl solutions com-pared to the aluminum matrix at about −700 mV / SCE in the same electrolyte.16The presence of the PFZ increased the galvanic coupling
effect between the grain and the Mg2Si-decorated grain boundaries
in T4-A specimens contributing to the sensitization of AA6101 to in-tergranular corrosion. The homogeneous distribution of β′′
hardening precipitates in the grain (except in the PFZ) and their dissolution due to micro-galvanic coupling with the matrix could affect the corrosion resistance of the grain itself. Therefore, the alloy itself is less resistant
Table II. Corrosion behavior, mechanical properties (hardness measurements) and microstructure of the AA6101 T4, T4-A, T3, T8 samples.
Metallurgical state HV0.1 Corrosion behavior Microstructure
T4 61 ± 3 Pitting corrosion No hardening precipitates
No intergranular Mg2Si precipitates T4-A 88 ± 3 Intergranular corrosion β′′hardening precipitates
Intergranular Mg2Si precipitates
T3 103 ± 4 Pitting corrosion No hardening precipitates
High dislocation density in some grains No intergranular Mg2Si precipitates
T8 82 ± 1 Pitting corrosion No hardening precipitates
No intergranular Mg2Si precipitates
to corrosion which could explain the shift of the corrosion potential of the T4-A samples toward lower values compared to the T4 samples (Figure5), as well as that of the OCP (Figure2).
Influence of cold-drawing on the corrosion behavior of AA6101: role of plastic deformation.—Comparison of the current-potential curves obtained for T4 and T3 metallurgical states (Figure5) showed that cold working led to a shift of the corrosion potential toward higher values. The corrosion potential of the T8 sample was between those of T4-A and T4 specimens in good agreement with the OCP values. Optical and SEM observations performed after the potentiokinetic polarization tests revealed matrix dissolution around coarse Al-Fe-Si particles and pitting corrosion with filaments for both T3 and T8 states (Figure 5d and 5erespectively). No susceptibility to intergranular corrosion was observed for either the T3 or the T8 samples. The absence of intergranular corrosion for the T8 samples was a key observation. Indeed, due to the aging treatment at 185◦C, the T8
samples were expected to be susceptible to IGC.
TEM observations showed that neither hardening precipitates nor intergranular Mg2Si precipitates were observed for the T3 samples
(Figures8aand8b) as expected. For the T8 samples, TEM observa-tions showed the same result (Figures9a–9c) despite the aging treat-ment at 185◦
C for 10 h. These observations were confirmed by DTA analyzes (Figure7). For T3 samples, a medium intensity exothermic peak, marked A′′
, was observed at 250◦
C: that could be attributed to β′′
precipitation from GP zones, as proposed previously for T4 sam-ples. This result confirmed that β′′
precipitates were not present in the T3 samples. Secondly, contrary to T4 samples, only a very smooth exothermic peak, marked B′′
at 325◦
C, corresponding to the forma-tion of β′
phase and no peak for β phase were observed showing that the formation of β′
and β phases occurred to a very limited extent upon heating during DTA analyzes for the T3 samples. Similar re-sults were obtained for the T8 metallurgical state for which two small exothermic peaks corresponding to β′′and β′precipitation from GP
zones were observed while no peak was observed corresponding to the precipitation of β phase.
Figure 8. (a) TEM observations of the AA6101 T3 samples (b) zoom on
previous micrograph.
The absence of hardening precipitates and intergranular precip-itates for the cold drawn samples, in particular for the T8 sam-ples, was another key observation of this study. Indeed, this is not conventionally found in these alloys as for example after high shear deformation processes like rolling, grinding machining or even wire drawing. Because of this, the DTA experiments were repeated at various scanning rates, and the results were checked. DTA experiments showed high reproducibility. TEM observations were also repeated and the absence of hardening precipitation and intergranular precipitates was confirmed. Moreover, additional data were obtained. Indeed, measurements at the grain size of etched T4 and T4-A samples by using an optical microscope showed an average grain diameter of about 80–100 µm in transverse section (Figure10). In longitudinal section, the grain size was about 200 µm near the surface of the wire and about 130 µm in the core of the material. For T3 and T8 samples, the grain size was too small to be measured on the basis of optical or SEM observations of etched samples. The TEM observations for the T3 samples revealed grains, with an average size of about 100–500 nm in transverse section that were elongated in the direction of cold drawing (Figures8aand8b).
Figure 9. (a), (b) and (c) TEM observations of the AA6101 T8 samples.
The TEM observations also showed a heterogeneous distribution of the dislocations in the material (Figure8a). The samples were tilted in different directions to confirm the observations. This specific mor-phology of the grains combined with the high density of dislocations for some grains showed that the cold-drawing process led to the for-mation of a nanostructure and, consequently, to a strength increase (TableII). The nanostructure could be explained by a dynamic recrys-tallization phenomenon which occurred during the first cold-drawing steps and was followed by an additional plastic deformation of the grains since the reduction in rod diameter from 9.5 mm to 1.34 mm was obtained by passing the strands through a series of drawing dies. For the T8 specimens, TEM observations showed a strong hetero-geneity in the grain size in the transverse plane: some grains with an average size of about 3 µm and others with an average size of about 100 - 500 nm were observed (Figures9a–9c). This suggested that the aging treatment of 10 hours at 185◦
C performed on the T3 nanostruc-ture led to a partial static recrystallization, in good agreement with the softening of the material from the microhardness measurements (TableII). TEM observations and the interpretation of the DTA records led us to assume that the cold drawing process used for the samples, leading to a severe plastic deformation, at a very high deformation rate (the strain rate measured during the cold drawing process was about 100 km.h−1), impeded or delayed the precipitation sequence
in the grains as well as the precipitation of Mg2Si intergranular
pre-cipitates during the following aging treatment even at temperatures as high as 185◦C and for a duration of 10 hours (aging for T8
sam-ples). Therefore, a decrease of the IGC susceptibility of the alloy was observed. This could be related to the recrystallization phenomena observed; dislocation displacement associated with this phenomenon could lead to a redistribution of the alloying elements so that local chemical supersursaturation disappeared which delayed and/or im-peded the formation of β′′
, β′
and β phases. Further study has been undertaken.
It is worth noticing that the absence of intergranular precipitation for the T8 samples is an unexpected result but it is in good agree-ment with the corrosion behavior observed (Figure5), confirming the hypothesis that intergranular Mg2Si precipitation promotes IGC
sus-ceptibility for Cu-free 6xxx aluminum alloys.28Other consequences
from the cold drawing process (grain size and dislocation density) could also contribute to explain the properties of the strand arms. A grain size effect could explain the shift of the corrosion potential for T3 samples with respect to T4 ones (Figure5) as previously mentioned by many authors who found a tendency for the intergranular corro-sion rate to decrease and an ennoblement of the corrocorro-sion potential as the grain size decreases.37–39The high dislocation density for the
T3 samples could also affect their corrosion behavior as suggested by Luo et al. who showed that there was a relationship between the dis-location density in a grain and the ability of the grain boundary to be corroded.40Moreover, it should be relevant to consider a difference in
the grain boundary character distribution (GBCD) between the T4 and the T3 metallurgical states. This parameter could also partly explain the results as suggested by Kim et al. who showed that the GBCD has a great effect on intergranular corrosion susceptibility of aluminum in HCl.41The influence of the grain size could also partly explain
the results for the T8 samples. With a finer grain size than the T4-A samples, the T8 samples were expected to have a nobler corrosion potential, in good agreement with the experimental results (Figure5). The growth of some grains for T8 samples during aging, compared to T3 samples, was assumed to lead to a shift of the corrosion potential of this metallurgical state toward lower potential compared to that for T3 sample, in good agreement with the results (Figure5). However, as noticed by Ralston et al.,37the ‘grain size – corrosion resistance’
rela-tionship is complex and this complexity could be increased due to the heterogeneity of the grain size in a sample. For T8 samples, a bimodal microstructure was observed which could contribute to explain the corrosion behavior of this metallurgical state.42Moreover, the severe
plastic deformation led also to a fragmentation of the Al–Fe–Si coarse particles, in agreement with the observations of Adamczyk-Cieslak et al. for a 6060 aluminum alloy.43This could be associated with the
multiplication of pit sites, promoting pitting corrosion and decreas-ing the susceptibility to IGC of the T8 samples, in agreement with Brunner et al.39
Conclusions
The corrosion behavior of AA6101 in different metallurgical states corresponding to the different steps of the manufacturing process of wire harnesses was studied in chloride solution. In the manufacturing process, the initial material was in the T4 state; it was submitted to different cold drawing steps followed by an aging treatment at 185◦
C for 10 h to obtain the strand arms constitutive of the harnesses. The results presented herein showed that the intergranular precipitation state dominated the corrosion morphology observed for AA6101 with intergranular corrosion susceptibility observed for the metallurgical states characterized by the presence of intergranular Mg2Si
precip-itates. However, the global corrosion behavior of the alloy resulted from the combination of the effects of several metallurgical factors including grain size, alloying element distribution, precipitation and dislocation density. These parameters were strongly related to the manufacturing route and interrelated. For example, a ‘grain size – corrosion resistance’ relationship was evidenced with cold drawing process generating a nanostructure characterized by a higher potential compared to that of the T4 samples. The formation of the nanostructure was correlated to the absence of intergranular Mg2Si precipitates due
to a redistribution of the alloying elements induced by dislocation dis-placement associated with a recrystallization phenomenon. Therefore, in the case of this study, the cold working due to the cold-drawing protected the alloy against intergranular corrosion by impeding the formation of Mg2Si phases at the grain boundaries even if the
mate-rial was heat-treated at 185◦
C for 10 hours after cold drawing. The results gave a new insight into the corrosion behavior of aluminum wire. This is a key point for the properties of the product and for its in service-durability.
Acknowledgments
The material studied was provided by Rio Tinto Alcan and cold drawn by SASA Trefil’Alu. The authors thank Didier Albert (Rio Tinto Alcan) and Jean-Jacques Zyla (SASA Trefil’Alu).
References
1. N. A. Belov, D. G. Eskin, and A. A. Aksenov, Multicomponent Phase Diagrams: Applications for Commercial Aluminum Alloys, first edition, Elsevier Ltd, Oxford, (2005).
2. A. Lutts,Acta Metall., 9(6), 577 (1961).
3. A. Guinier and H. Lambot, Rev. Metall., 47, 709 (1950). 4. G. Thomas, J. I. Met., 90, 57 (1961-1962).
5. D. W. Pashley, J. W. Rhodes, and A. Sendorek, J. I. Met., 94, 41 (1966). 6. C. D. Marioara, S. J. Andersen, J. Jansen, and H. W. Zandbergen,Acta Mater., 49(2),
321 (2001).
7. H. S. Hasting, A. G. Froseth, S. J. Andersen, R. Vissers, J. C. Walmsey, C. D. Mariora, F. Danoix, W. Lefebvre, and R. Holmestad,J Appl. Phys, 106, 123527 (2009).
8. K. Matsuda, T. Naoi, K. Fujii, Y. Uetani, T. Sato, A. Kamio, and S. Ikeno,Mater. Sci. Eng. A, A262, 232 (1999).
9. K. Matsuda, Y. Sakaguchi, Y. Miyata, Y. Uetani, T. Sato, A. Kamio, and S. Ikeno,J. Mater. Sci., 35, 179 (2000).
10. A. K. Gupta, D. J. Lloyd, and S. A. Court,Mater. Sci. Eng. A, A301, 140 (2001). 11. A. K. Gupta, D. J. Lloyd, and S. A. Court,Mater. Sci. Eng. A, 316, 11 (2001). 12. G. A. Edwards, K. Stiller, G. L. Dunlop, and M. J. Couper,Acta Mater., 46(11), 3893
(1998).
13. L. F. Mondolfo, Aluminum Alloys: Structure and Properties, Butterworths & Co. Ltd, London, (1976).
14. Y. L. Liu, S. B. Kang, and H. W. Kim,Mater. Lett., 41, 267 (1999).
15. S. Karabay, M. Yilmaz, and M. Zeren,J. Mater. Process. Tech., 160, 138 (2005). 16. R. G. Buchheit,J. Electrochem. Soc., 142, 3994 (1995).
17. C. Blanc, Y. Roques, and G. Mankowski,Corros. Sci., 40, 1019 (1998).
18. F. Eckermann, T. Suter, P. J. Uggowitzerb, A. Afseth, and P. Schmutz,Electrochim. Acta, 54, 844 (2008).
19. K. Mizuno, A. Nylund, and I. Olefjord,Corros. Sci., 43(2), 381 (2001). 20. Z. Szklarska-Smialowska,Corros. Sci., 41, 1743 (1999).
22. G. Svenningsen, J. E. Lein, A. Bjorgum, Y. Yu, and K. Nisancioglu,Corros. Sci., 48(1), 226 (2006).
23. V. Guillaumin and G. Mankowski,Corros. Sci., 42(1), 105 (2000).
24. K. Yamaguchi and K. Tohma, J. Jpn. Inst. Light Met., 47(5), 285 (1997).
25. G. Svenningsen, M. H. Larsen, J. H. Nordlien, and K. Nisancioglu,Corros. Sci., 48(1), 258 (2006).
26. G. Svenningsen, M. H. Larsen, J. H. Nordlien, and K. Nisancioglu,Corros. Sci., 48, 3969 (2006).
27. G. Svenningsen, M. H. Larsen, J. C. Walmsley, J. H. Nordlien, and K. Nisancioglu, Corros. Sci., 48(6), 1528 (2006).
28. A. K. Bhattamishra and K. Lal,Mater. Des., 18(1), 25 (1997). 29. V. Guillaumin and G. Mankowski,Corrosion, 56(1), 12 (2000).
30. T. Minoda and H. Yoshida, Metall. Mater. Trans. A, 33A(9), 2891 (2002).
31. G. Mrowka-Nowotnik and J. Sieniawski,J. Mater. Process. Tech., 162-163, 367 (2005).
32. P. Villars, Pearson’s Hanbook: Crystallographic Data for Intermettalics Phases, second edition, Materials Park, OH : ASM International, (1997).
33. J. O. Park, C. H. Paik, and R. C. Alkire,J. Electrochem. Soc., 143, L174 (1996). 34. J. O. Park, C. H. Paik, Y. H. Huang, and R. C. Alkire,J. Electrochem. Soc., 146, 517
(1999).
35. W. C. Moshier, G. D. Davis, and J. S. Ahearn,Corros. Sci., 27, 785 (1987). 36. R. Ambat, A. J. Davenport, G. M. Scamans, and A. Afseth,Corros. Sci., 48, 3455
(2006).
37. K. D. Ralston, D. Fabijanic, and N. Birbilis,Electrochim. Acta, 56, 1729 (2011). 38. K. D. Ralston, N. Birbilis, and C. H. J. Davies,Scripta Mater., 63, 1201 (2010). 39. J. G. Brunner, N. Birbilis, K. D. Ralston, and S. Virtanen,Corros. Sci., 57, 209
(2012).
40. C. Luo, X. Zhou, G. E. Thompson, and A. E. Hughes,Corros. Sci., 61, 35 (2012). 41. S. H. Kim, U. Erb, and K. T. Aust,Scripta Mater., 44, 835 (2001).
42. S. Gollapudi,Corros. Sci., 62, 90 (2012).
43. B. Adamczyk-Cieslak, J. Mizera, and K. J. Kurzydlowski,Mater. Charact., 62, 25 (2011).