Université de Montréal
Bioassay-guided fractionation of Larix laricina
du Roi, and antidiabetic potentials of ethanol and hot
water extracts of seventeen medicinal plants from the
traditional pharmacopeia of the James Bay Cree
par Nan Shang
Département de Pharmacologie Faculté de médicine
Thèse présentée à la Faculté des études supérieures et postdoctorales en vue de l’obtention du grade de du grade de Philosophiae Doctor (PhD)
en pharmacologie
Juin, 2013
Université de Montréal
Faculté des études supérieures et postdoctorales
Cette thèse intitulée :
Bioassay-guided fractionation of Larix laricina
du Roi, and antidiabetic potentials of ethanol and hot
water extracts of seventeen medicinal plants from the
traditional pharmacopeia of the James Bay Cree
Présentée par :Nan Shang
a été évaluée par un jury composé des personnes suivantes :
Dre Hélène Girouard, président-rapporteur Dr Pierre S. Haddad, directeur de recherche
Dr Raynald Bergeron, membre du jury
Dre Tatjana Stevanovic Janezic, examinateur externe Dre Christine Des Rosiers, Représentante du doyen de la FESP
Résumé
Nous avons utilisé une approche ethnobotanique pour identifier des espèces de plantes utilisées par les Cris afin de traiter les symptômes du diabète de type 2.
Larix laricina du Roi (L. laricina) a récemment été identifiée comme une des
meilleures plantes qui a stimulé le transport de glucose dans les cellules C2C12 et fortement potentialisé la différenciation des 3T3-L1 en indiquant une sensibilité potentiellement accrue à l’insuline. Ensuite, ces études de criblage ont été effectuées sur des extraits éthanolique (EE) en utilisant une série de bioessais in vitro. Cependant, les préparations traditionnelles des plantes sont souvent faites avec l’eau chaude. Le but de cette thèse de doctorat était d’isoler les principes actifs de L.
laricina par un fractionnement guidé par l’adipogenèse; d’évaluer et de comparer
l’activité et les mécanismes antidiabétiques des EE et des extraits aqueux (HWE) de ces 17 plantes.
Pour le fractionnement de L. laricina, on a isolé plusieurs composés connus et identifié un nouveau composé actif cycloartane triterpene, qui a amélioré fortement l’adipogenèse et a été responsable en partie de l’activité adipogénique (potentiellement similaire à l’effet sensibilisateur à l’insuline des glitazone) de l’extrait éthanolique issu de l’écorce de L. laricina.
Pour le métabolisme lipidique, nos résultats ont confirmé que 10 parmi les 17 EE ont augmenté la différenciation des adipocytes alors que 2 extraits seulement l’ont inhibée. Les HWE ont montré une faible activité adipogénique ou antiadipogénique. Les EE de R. groenlandicum et K. angustifolia ont le PPAR γ (peroxisome proliferator-activated receptor γ), le SREBP-1 (sterol regulatory element binding protein-1) et le C/EBP (CCAAT-enhancer binding proteins) α, alors que ceux de P. balsamifera et A. incana les ont inhibés. L’effet inhibiteur de P. balsamifera a également été prouvé d’avoir impliqué l’activation de la protéine kinase activée par l’AMP (AMPK). Les EE et HWE de R. groenlandicum ont stimulé les mêmes facteurs de transcription alors que les extraits aqueux d’autres plantes sélectionnées ont perdu ces effets en comparaison avec leurs extraits éthanoliques respectifs. L’analyse phytochimique a également identifié le groupe des espèces actives et inactives, notamment lorsque les espèces ont été séparées par famille de plante.
Finalement concernant l’homéostasie de glucose, nos résultats ont confirmé que plusieurs EE ont stimulé le transport de glucose musculaire et inhibé l’activité de la glucose-6-phosphatase (G6Pase) hépatique. Certains des HWE ont partiellement ou complètement perdu ces activités antidiabétiques par rapport aux EE, tandis qu’une seule plante (R.groenlandicum) a juste conservé un potentiel similaire entre les EE et HWE dans les deux essais. Dans les cellules musculaires, les EE de
R.groenlandicum, A. incana et S. purpurea ont stimulé le transport de glucose en
activant la voie de signalisation de l’AMPK et en augmentant le niveau d’expression des GLUT4. En comparaison avec les EE, les HWE de R.groenlandicum ont montré des activités similaires; les HWE de A. incana ont complètement perdu leur effet sur tous les paramètres étudiés; les HWE de S. purpurea ont activé la voie de l’insuline au lieu de celle de l’AMPK pour augmenter le transport de glucose. Dans les cellules H4IIE, les EE et HWE des 5 plantes ont activé la voie de l’AMPK, et en plus les EE et HWE de 2 plantes ont activé la voie de l’insuline. La quercétine-3-O-galactoside et la quercétine 3-O-α-L-arabinopyranoside ont été identifiées comme des composés ayant un fort potentiel antidiabétique et donc responsables de l'activité biologique des plantes HWE actifs avec le transport du glucose.
En conclusion, on a isolé plusieurs composés connus et identifié un nouveau triterpène actif à partir du fractionnement de L. laricina. Nous avons fourni également une preuve directe pour l'évaluation et la comparaison d'une action analogue à l'insuline ou insulino-sensibilisateur des EE et HWE de plantes médicinales Cris au niveau de muscle, de foie et de tissus adipeux. Une partie de leur action peut être liée à la stimulation des voies de signalisation intracellulaire insulino-dépendante et non-insulino-insulino-dépendante, ainsi que l’activation de PPARγ. Nos résultats indiquent que les espèces de plantes, les tissus ou les cellules cibles, ainsi que les méthodes d'extraction sont tous des déterminants significatifs de l'activité biologique de plantes médicinales Cris sur le métabolisme glucidique et lipidique.
Mots-clés: Le diabète de type 2, l'AMPK, l’Akt, le PPAR γ, le SREBP-1, le C / EBP
Abstract
We have used a collaborative ethnobotanical approach to identify plant species used by the Cree of Eeyou Istchee (CEI) to treat symptoms of type 2 diabetes. Several screening studies were performed on 17 species identified in a survey of the Cree Nation. Firstly, Larix laricina du Roi (L. laricina) was recently identified as one of the top plants, which stimulated glucose uptake in C2C12 muscle cells and strongly potentiated the differentiation of 3T3-L1 pre-adipocytes suggesting enhanced insulin sensitivity. Secondly, these screening studies were performed on ethanol extracts (EE) using an in vitro bioassay platform, however, traditional preparations are often based on hot water. So the purpose of this PhD thesis was to isolate the active principles from L. laricina through adipogenesis-guided fractionation, and to evaluate and compare the antidiabetic activity and mechanisms of EE and hot water extracts (HWE) of these 17 Cree plants.
For the fractionation of L. laricina, we isolated several known compounds and identified a new active cycloartane triterpene, which strongly enhanced adipogenesis in 3T3-L1 cells and was responsible partly for the adipogenic (potentially glitazone-like insulin sensitizing) activity of the ethanol extract of the bark of L. laricina.
In the adipocyte lipid metabolism course, the results confirmed that 10 of the 17 EE stimulated adipocyte differentiation and adipogenesis, whereas 2 had inhibitory effects. Corresponding HWE exhibited partial or complete loss of such adipogenic or anti-adipogenic activity. R. groenlandicum and K. angustifolia EEs activated Peroxisome proliferator-activated receptor γ (PPAR γ), sterol regulatory element binding protein-1 (SREBP-1) and CCAAT-enhancer binding protein (C/EBP) α, whereas P. balsamifera and A. incana decreased these transcription factors. P. balsamifera’s inhibitory effect was also found to involve AMP-activated protein kinase (AMPK) activation. R. groenlandicum HWE and EE stimulated similar transcription factors, but HWE of other selected plants lost such effects compared to their respective EE. Phytochemical analysis also uncovered clustering of active versus inactive species, notably when species were segregated by plant family.
The results showed that several EE stimulated muscle glucose uptake and inhibited hepatic glucose-6-phosphatase (G6Pase) activity. Some of the HWE
partially or completely lost these antidiabetic activities in comparison to EE; while one plant (R.groenlandicum) retained similar potential between EE and HWE in both assays. In C2C12 muscle cells, EE of R.groenlandicum, A. incana and S. purpurea stimulated glucose uptake by activating AMPK pathway and increasing GLUT4 expression level. In comparison to EE, HWE of R.groenlandicum exhibited similar activities; HWE of A. incana completely lost its effect on all parameters; interestingly, HWE of S. purpurea activated insulin pathway instead of AMPK pathway to increase glucose uptake. In the H4IIE cells, all selected 5 plants HWE and EE activated AMPK pathway, and in addition, 2 plants EE and HWE also activated insulin pathways. Quercetin-3-O-galactoside and quercetin 3-O-α-L-arabinopyranoside were identified as potential candidates to be responsible for the biological activity of the active HWE plants in the glucose transport assay.
In conclusion, we isolated several known compounds and identified a new active triterpene from fractionation of L. laricina. We also provide direct evidence evaluating and comparing of an insulin-like or insulin-sensitizing action of EE and HWE of Cree medicinal plants at the level of muscle, liver and adipose tissue. Part of their actions may be related to stimulation of dependent and insulin-independent intracellular signaling pathways, as well as to PPARγ activation. The results indicate that plant species, target tissues or cells, as well as extraction methods, are all significant determinants of the biological activity of Cree medicinal plants on glucose and lipid metabolism.
Keywords:
type 2 diabetes, AMPK, Akt, PPAR γ, SREBP-1, C/EBP α, G6Pase, traditional medicine, lipid and glucose homeostasis,
Table of Contents
Table of Contents ... vii
List of tables ... x
List of figures ... xi
List of abbreviations ... xiii
Acknowledgement ... xix Chapter 1: Introduction ... 1 1.Introduction ... 2 1.1 Energy homeostasis ... 3 1.2 Glucose homeostasis ... 3 1.2.1 Glucose transporters ... 4
1.2.2 Hepatic glucose production ... 5
1.3 Lipid metabolism ... 9
1.3.1 Lipogenesis ... 10
1.3.2 Lipolysis ... 10
1.3.3 Adipogenesis ... 12
1.4 Insulin receptor and insulin pathway ... 13
1.4.1 PI3K pathway ... 14
1.4.2 MAPK pathway ... 15
1.4.3 CAP/Cbl/ TC10 pathways ... 15
1.5 Other mechanisms involved in energy metabolism: ... 16
1.5.1 AMPK pathway ... 16
1.5.2 PPAR γ and regulation of lipid homeostasis ... 18
1.6.1 Metabolic syndrome ... 19
1.6.2 Obesity ... 20
1.6.3 Adipocyte dysfunction, inflammation and insulin resistance ... 20
1.6.4 Adipose tissue and adipokines ... 21
1.7 Diabetes mellitus ... 22
1.7.1 Diabetes definition and diagnosis ... 22
1.7.2 Diabetes classification ... 22
1.7.3 Pathogenesis of T2D ... 24
1.7.4 Diabetes symptoms and complications ... 25
1.7.5 Diabetes treatment ... 26
1.8 Secondary metabolites and bioactive compounds ... 34
1.8.1 Natural Phenolics ... 34
1.8.2 Terpenes ... 38
1.8.3 Metabolites analysis ... 39
1.9 Objectives of the study ... 41
Chapter 2: Article 1 ... 42
Chapter 3: Article 2 ... 67
Chapter 4: Article 3 ... 96
Chapter 5: General discussion ... 129
5.1 General bioactive compounds and constituents from L. laricina ... 130
5.2 Antidiabetic activity and mechanisms of action of general plants and the CEI plants ... 133
5.3 Hot water extraction ... 135
Chapter 6: Conclusion and perspective ... 138 Chapter 7: Reference ... 141
List of tables
Introduction
Table 1: Current key therapeutic agents for type 2 diabetes ... 28
Article 1
Table 1: EC50, activity and yields of L. laricina compounds ... 63
Article 2
Table 1: List of investigated plant species and the concentrations of the extracts tested in 3T3-L1 cells ... 91
Article 3
Table 1: List of investigated plant species and the concentrations of the extracts tested in C2C12 and H4IIE cells ... 123
List of figures
Introduction
Figure 1: Glucose metabolism in liver. ... 7
Figure 2: Lipogenesis and lipolysis ... 11
Figure 3: Insulin signaling pathways. ... 14
Figure 4: AMPK functions involved in energy metabolism ... 16
Figure 5: PPAR γ activation and mechanism involved in glucose and lipid metabolism. ... 17
Figure 6: PPAR γ activation and improved insulin sensitivity. ... 19
Figure 7: Direct actions of GLP-1 on pancreas, heart, stomach, brain and indirect actions on liver and muscle. ... 31
Figure 8: Structures of flavonoids. ... 35
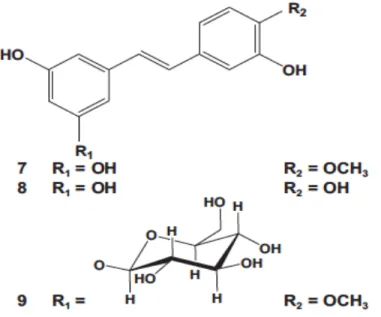
Figure 9: Structure of rhapontigenin (7), piceatannol (8), rhaponticin (9) identified in Larix laricina. ... 37
Figure 10: Structures of (+)-lariciresinol-3-acetate (5) and (+)-lariciresinol-9’-p-coumarate (6) found in Larix laricina ... 38
Figure 11: Structure of the new terpenoid as 23-oxo-3α-hydroxycycloart-24-en-26-oic acid (1) and three diterpenes 13-epitorulosol (2) and 13-epicupressic acid (3), 19-norlabda-8 (17), 14-dien-4,13-diol (4) found in Larix laricina. ... 39
Article 1
Figure 1: Chemical structure of compounds 1-8 isolated from L. laricina ... 64 Figure 2: The adipogenic activity of L. laricina crude extract, fractions and compounds. ... 65 Figure 3: Key HMBC(H→C) correlations of compound ... 66
Article 2
Figure 1: Effects of extracts on rate of adipogenesis ... 92 Figure 2: Effect of the selected extracts on expression of PPAR γ, C/EBP α and SREBP-1. ... 93 Figure 3: EE of P. balsamifera stimulates the AMPK signaling pathway to inhibit adipogenesis ... 94 Figure 4: Metabolites analysis of selected ethanol extracts. ... 95
Article 3
Figure 1: Effects of extracts on muscle glucose transport ... 124 Figure 2: Effects of extracts on hepatic Glucose-6- phosphatase activity ... 125 Figure 3: Effect of selected extracts on expression of GLUT4, Insulin and AMPK pathway in C2C12 cells ... 126 Figure 4: Effect of selected extracts on the modulation of insulin and AMPK pathway components in H4IIE hepatoma cells ... 127 Figure 5: Metabolites analysis of selected hot water extracts based on stimulating glucose uptake activity ... 128
List of abbreviations
ACC: acetyl-CoA carboxylaseA.balsamea: Abies balsamea (L.) Mill.
A.incana: Alnus incana subsp. rugosa (Du Roi) R.T. Clausen
ACE: angiotensin converting enzyme AMP: adenosine monophosphate AMPK: AMP-activated protein kinase AMPKK: AMPK kinase
APS: adaptor protein
ARB: angiotensin II receptor antagonist ATGL: adipose triglyceride lipase ATP: adenosine triphosphate BMI: Body mass index
C/EBP: CCAAT-enhancer-binding protein CAM: complementary and alternative medicines CaMKKβ: Ca2+-calmodulin-dependent kinase kinase β cAMP: cyclic adenosine monophosphate
CAP: Cbl-associated protein
CAPE: caffeic acid phenethyl ester CDA: Canadian Diabetes Association CEI: Cree of Eeyou Istchee
CPT-1: carnitine palmitoyltransferase-I DEX: dexamethasone
DGAT: diacylglycerol acyltransferase DPP4: dipeptidyl peptidase 4
EE: ethanol extracts F6P: fructose 6-phosphate
FABP4 or aP2: fatty acid-binding protein 4 or adipocyte protein 2 FAS: fatty acid synthase
FFA: free fatty acid
Foxo-1: Forkhead box o protein
G.hispidula: Gaultheria hispidula (L.) Muhl.
G6Pase: glucose-6-phosphatase GC: gas chromatography
GDM: gestational diabetes mellitus GDP: guanosine diphosphate
GEF: guanyl nucleotide exchange factor GLP-1: glucagon like peptide- 1
GLP-1R: GLP-1 receptor GLUT: glucose transporters
GPAT: glycerol 3-phosphate acyltransferases GPCR: G-protein-coupled receptors
Grb2: growth factor binding protein 2 GS: glycogen synthase
GSK-3: glycogen synthase kinase 3 HbA1C: glycated hemoglobin HNF4α: hepatic nuclear factor 4α
HPLC: high performance liquid chromatography HSL: hormone sensitive lipase
HWE: hot water extracts
IBMX: 3-isobutyl-1-methylxanthine IDF: International Diabetes Federation IFG: Impaired fasting glucose
IGF: Insulin-like growth factor IGT: impaired glucose tolerance IKK: IkB kinase
IL: interleukin IR: insulin resistance
IRS: insulin receptor substrate
JNK1: c-Jun N-terminal kinase
K.augustifolia: Kalmia angustifolia L. L. laricena: Larix laricina Du Roi (K.Koch) L.clavatum: Lycopodium clavatum L.
LKB1: liver kinase B 1 LPA: lysophosphatidate LC: liquid chromatography LPL: Lipoprotein lipase
MAG: monoacylglycerol pathway
MAPK: mitogen-activated protein kinase MCP-1: monocyte chemo-attractant protein-1 MEK: MAP kinase-kinase
MetS: metabolic syndrome MGL: monoglyceride lipase MO25: mouse protein 25
MODY: maturity onset diabetes of the young MS: mass spectrometry
mTOR: mammalian target of rapamycin NAFLD: non-alcoholic fatty liver disease OGTT: oral glucose tolerance test
OHA: oral hypoglycemia agent PA: phosphatidate
PAP: phosphatidate phosphatases
P.balsamifera: Populus balsamifera L. P.banksiana: Pinus banksiana Lamb. P.glauca: Picea glauca (Moench) Voss
Pref-1: preadipocyte factor-1
P.mariana: Picea mariana (P. Mill.) BSP
PDK: PI-dependent kinase
PEPCK: phosphoenolpyruvate carboxykinase
PI3K: phosphatidylinositol-3-kinase
PIP2: phosphatidylinositol 4,5-bisphosphate PIP3: phosphatidylinositol 3,4,5-triphosphate PKA: cAMP-dependent protein kinase A PKB: protein kinase B
PLC: phospholipase C
PPAR γ: peroxisome proliferator-activated receptor γ PPRE: peroxisome proliferate response element PTB: phosphotyrosine binding
R.groenlandicum: Rhododendron groenlandicum (Oeder) Kron and Judd
R.tomentosum: Rhododendron tomentosum (Stokes) Harmaja subsp.subarcticum
(Harmaja)G.Wallace RXR: retinoid X-receptor
QTOF: quadrupole-time-of-flight
S.decora: Sorbus decora (Sarg.) C.K.Schneid. S.planifolia: Salix planifolia Pursh
S.purpurea: Sarracenia purpurea L.
SGLT: sodium-dependent glucose co-transporter SH2: Src homology 2 domain
SLC: solute carrier
SOCS: suppressor-of-cytokine-signalling SoHo: sorbin homology
SOS: son of sevenless
SREBP-1: sterol regulatory element-binding proteins-1 STRAD: Ste20-related adaptor
SUR: sulfonylurea receptor T1D: type 1 diabetes T2D: type 2 diabetes
TCA cycle: tricarboxylic acid cycle TGs: triglycerides
TNF-α: tumor necrosis factor- α TOF: time-of-flight
TZD: thiazolidinedione
UPLC: ultra performance liquid chromatography
V.vitis-idaea: Vaccinium vitis-idaea L.
VAT: visceral adipose tissue WC: waist circumference
Acknowledgement
I would like to express my deepest gratitude to my supervisor, Dr. Pierre S. Haddad, for welcoming me into his laboratory and continuous support of my PhD study. Many thanks to his patience, immense knowledge and guiding me for the difficulty time. I really appreciate it.
I would like to thank to Dr John T. Arnason, José A. Guerrero-Analco, and Brendan Walshe-Roussel in University of Ottawa for their collaboration for this thesis. Very special thanks to Dr Ammar Saleem, who spent several weekends to work with me for these phytochemical work.
I am also grateful to Dr. Hélène Girouard, Dr Pierre S. Haddad, Dr Raynald Bergeron, and Dr Tatjana Stevanovic Janezic for the correction and evaluation of this PhD thesis.
I also owe heartful thanks to Dr Lina Musallam for assistance with my PhD study and for her suggestions and comments.
I am very thankful all my colleagues, especially Abir for helping me a lot during my thesis preparation, and all the support.
It is a pleasure to thank Sylvie Caron and Dr. Cardinal from the departments of Pharmacology. I know they are pretty nice and try to help me a lot even I cant speak in French.
I don’t forget the rest of friends in Department of Pharmacology and in Montreal. We had an unforgettable time together and I will treasure it forever.
Last but not least, I would like to thank my family for all their love and support, for always encouraging me for these years. Without these support, I cannot stay in Canada alone and finish my thesis. I love you all more than words can express. I dedicate this thesis to them.
1.Introduction
Type 2 diabetes (T2D) is a growing global health problem. A significant increase in prevalence is expected from 171 million people affected in 2000 to a possible 366 million in 2030 (Wild et al., 2004). According to WHO, 347 million people worldwide now have diabetes, and an estimated 3.4 million people died from consequences of hyperglycemia in 2004 (WHO, 2011).
The prevalence of T2D is especially high among some Canadian First Nations (Ayach and Korda, 2010). The age-adjusted prevalence of disease in Cree of Eeyou Istchee (CEI) of northern Quebec reached 29% in 2009 or 3 to 5 times higher compared with the rest of the Canadian population (Kuzmina et al., 2010 ). And the their rate of diabetic complications is also disproportional to the rate of diabetes (Young et al., 2000).
This serous problem is most likely caused by factors such as sedentary lifestyle and non-traditional diet (Hegele, 2001), and a genetic predisposition towards obesity (Neel, 1999; Skyler, 2004). The difficulty to comply with modern medical treatment also contributes (Young et al., 2000). Therefore, new strategies are needed to address this specialized issue and to provide culturally acceptable alternative medicines (Brassard et al., 1993).
We have used a collaborative community-based ethnobotanical approach to identify several plant species, which are used by the Cree for treating a variety of symptoms of diabetes (Leduc et al., 2006). Several screening studies were performed on 17 species identified in a survey of the Cree Nation (Harbilas et al., 2009; Harris et al., 2011b; Nachar et al., 2013; Nistor Baldea et al., 2010; Spoor et al., 2006). Firstly, Larix laricina Du Roi (K.Koch) (L. laricina) was recently identified as one of the top plants, which stimulated glucose uptake in C2C12 muscle cells and strongly potentiated the differentiation of 3T3-L1 pre-adipocytes indicating potentially enhanced insulin sensitivity (Spoor et al., 2006). Secondly, the screening studies for these 17 plants were performed on ethanol extracts (EE) using an in vitro bioassay platform, however, traditional preparations are often based on hot water.
So the purpose of this PhD thesis was to isolate the active principles from L.
antidiabetic activity and mechanisms of action of ethanol and hot water extracts of the 17 Cree plants, as well as to analyze the metabolites in these plants based on their activity.
1.1 Energy homeostasis
The main goal of the metabolic processes is to provide the required and proper amounts of energy to the body. Overall, there are two groups of metabolic processes: energy consuming or anabolic (gluconeogenesis, glycogenesis, lipogenesis, protein synthesis) and energy producing or catabolic (glycolysis, glycogenolysis, lipolysis, proteolysis) metabolisms. When energy is needed, it can be derived from the oxidation or breakdown of fat, protein or carbohydrates. When there is extra energy, the body can store carbohydrate in the form of glycogen and fat in the form of triglycerides (TGs).
1.2 Glucose homeostasis
Glucose is a monosaccharide and is the primary energy source, enabling the generation of adenosine triphosphate (ATP) following glycolysis. Although most tissues can also use fats and protein as an energy source, the brain mainly only use glucose (ketone bodies (Owen et al., 1967) provides a major alternative source during fasting).
The low blood concentrations of glucose (hypoglycemia) can causes seizures, loss of consciousness, and death; while long lasting high blood glucose levels (hyperglycemia), can result in blindness, renal failure, and vascular disease. Therefore, blood glucose needs to be maintained within a narrow range and this process for maintaining stable blood glucose is called glucose homeostasis.
There are several metabolisms for glucose homeostasis, including glycolysis (oxidation of glucose into ATP and energy); gluconeogenesis (endogenous glucose production in the liver and kidney); glycogenesis (the conversion of excess glucose into glycogen as storage energy); and glycogenolysis (the breakdown of glycogen and another supply of glucose besides gluconeogenesis).
The body can adjust blood glucose levels by a variety of cellular mechanisms, such as insulin and glucagon. When glucose levels increasing, insulin is released from pancreatic β cells in the islets of Langerhans to the blood. Then insulin could stimulate the uptake of glucose, and also promote storage in the body, especially in the liver, as glycogen (glycogenesis). Glucose transporters facilitate the uptake of glucose across the cell membrane into cells.
In contrast, low glucose levels could stimulate the secretion of glucagon from pancreatic α cells. To increase the blood glucose, glucagon promotes the conversion of glycogen (the storage form of glucose in the liver) to glucose (glycogenolysis). Epinephrine also causes the release of glucose into the blood (Sherwin and Sacca, 1984) when the sympathetic nervous system is activated. Glucose can also be generated from non-carbohydrate precursors including pyruvate and glycerol, by gluconeogenesis.
1.2.1 Glucose transporters
Because the lipid bilayer of the plasma membrane is impermeable to polar molecules, glucose is transported across the plasma membrane by glucose transporters. There are two different types of transporter proteins, sodium dependent glucose co-transporter (SGLT) and the facilitative glucose transporters (GLUT) (Mueckler, 1992).
Both types of transporters belong to families of the solute carrier (SLC) (Scheepers et al., 2004) gene series. The two most well known members of SGLT family are SGLT1 and SGLT2, which are members of the SLC5A gene family and are involved in intestinal glucose absorption and renal reabsorption (Gerardi-Laffin et al., 1993; Scheepers et al., 2004).
The human genome contains 14 members of the GLUT family (gene name SLC2A), which can be grouped into 3 classes. They differ in the functional characteristics, including substrate profiles, kinetic constants, and binding affinities as well as different tissue distribution and expression (Gould and Holman, 1993), for a complex and specific regulation of glucose uptake.
The widely distributed GLUT1, is targeted predominantly to the plasma membrane, indicating to mediate basal glucose transport in various cell types (Kozlovsky et al., 1997). On the other hand, GLUT4 is a glucose transporter expressed in several insulin-sensitive tissues (heart, skeletal muscle and adipose tissue). GLUT4 is the primary transporter expressed in the skeletal muscle (Zorzano et al., 2005), whereas GLUT1 account for only 5% of total expression of transporters. The newly synthesized GLUT4, present in the Golgi apparatus and the endoplasmic reticulum and undergo maturation and glycosylation. Normally, the GLUT4 is sequestered to the intracellular membrane compartments. In contrast, insulin, muscle contraction, and/or hypoxia increases GLUT4 expression at the cell surface by promoting the translocation of the transport protein from intracellular storage vesicles, resulting in an immediate 10- to 20-fold increase in glucose transport (Bryant et al., 2002).
Skeletal muscle cells exhibit insulin-stimulated glucose uptake that is dependent on the phosphatidylinositol-3-kinase (PI3K) pathway. However, enhanced glucose transport could also be induced by an insulin-independent mechanism, which could be activated by muscle contractions and hypoxia (Azevedo et al., 1995; Nesher et al., 1985; Wallberg-Henriksson and Holloszy, 1985). Evidence suggests that the AMP-activated protein kinase (AMPK) plays an important role in glucose transport stimulated by contraction (Hayashi et al., 1998). There are also other possible signal intermediates, including calcium, nitric oxide and others (Balon, 1998; Jessen and Goodyear, 2005; Wright et al., 2005).
1.2.2 Hepatic glucose production
The liver is capable of maintaining blood glucose homeostasis by glucose production and release (through gluconeogenesis and glycogenolysis), as well as glucose uptake/storage (through glycogenesis).
1.2.2.1 Gluconeogenesis and glycolysis
Glycolysis is the pathway, which converts the glucose molecule (six-carbon) into two molecules of the pyruvate (three carbon) and occurs virtually in all tissues. It
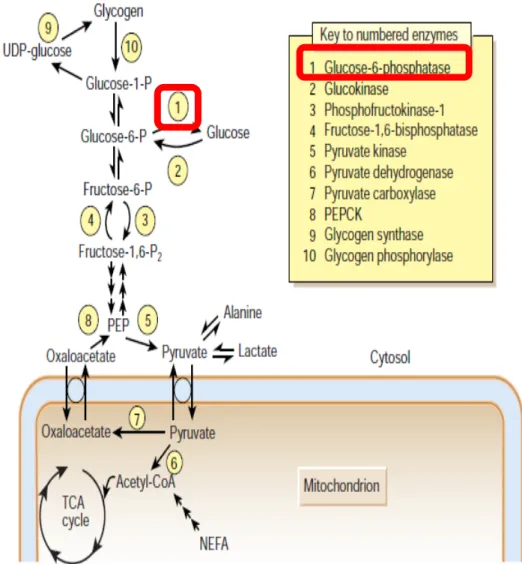
consists of two phases: a preparatory phase, where ATP is consumed and a pay-off phase where ATP is produced. During fasting, low-carbohydrate diets, or intense exercise, gluconeogenesis occurs, mainly in the liver and kidney. It is a process by which glucose is synthesized from non-carbohydrate carbon substrates such as pyruvate, glycerol, alanine and lactate. These substrates mainly come from the breakdown from amino acids and lactate, transported to the liver by the bloodstream. This pathway consists of a series of enzyme-catalyzed reactions and begins in the mitochondria or cytoplasm, dependent on the substrate being used (Nordlie et al., 1999). The process of gluconeogenesis uses most of the reactions of glycolysis reversely to this pathway to re-synthesize glucose.
In the first step in glycolysis, glucose is phosphorylated into glucose-6-phosphate (G6P) by hexokinases. For glycolysis, G6P is then rearranged into fructose 6-phosphate (F6P) by glucose phosphate isomerase and phosphofructokinase converts F6P into fructose-1,6-biphosphate, which eventually leads to the formation of phosphoenolpyruvate (PEP). Pyruvate kinase then converts PEP into pyruvate.
Glycolysis process continues as the one of the two methods: aerobic metabolism of glucose or anaerobic glycolysis. If there is oxygen, the process continues into aerobic respiration, where pyruvate is further metabolized to acetyl-CoA and CO2 in the mitochondria in a process called oxidative decarboxylation (Voet
and Voet, 2003). Then acetyl-CoA could enter the tricarboxylic acid cycle (TCA cycle), or the Krebs cycle and get completely oxidized into CO2, water. The
anaerobic glycolysis usually occurs when there is no oxygen. In this case, pyruvate is converted to lactate, by lactate dehydrogenase.
One common substrate for gluconeogenesis is lactate, which is produced in the muscle in the absence of oxygen. The lactate is released to the blood, and then transported into the liver and is converted to pyruvate, then into glucose, which goes back into the bloodstream and returns to the muscle. This is termed the “Cori cycle” (Garrett and Grisham, 2010). Gluconeogenesis begins with the formation of oxaloacetate by the carboxylation of pyruvate in the mitochondria. Oxaloacetate is decarboxylated and then phosphorylated to form PEP using the enzyme phosphoenolpyruvate carboxykinase (PEPCK) in cytosol. This is the first
rate-limiting step in gluconeogenesis. The next steps are the same as reversed glycolysis, however fructose-1,6-bisphosphatase (another rate-limiting enzyme) converts fructose-1,6-bisphosphate to F6P. Finally, glucose is produced when G6P is hydrolyzed by glucose-6-phosphatase (G6Pase), which is the last rate-limiting enzyme (Barthel et al., 2001) (Figure 1).
1.2.2.2 Glycogenolysis and glycogenesis
Glycogen is a highly branched polymeric, formed by basic monomer glucose. Glycogenesis is the process of glycogen synthesis glucose storage. Glucose is metabolized to G6P by hexokinase or glucokinase (Vinuela et al., 1963), and then converted to glucose-1-phosphate by phosphoglucomutase. Through UDP-glucose pyrophosphorylase, glucose-1-phosphate then is converted into UDP-glucose. Glycogen synthase (GS) then catalyzes the reaction between UDP-glucose and a pre-existing glycogen primer, forming a chain (Voet and Voet, 2003). Then glycogen branching enzyme transfers the glucan chains into branches and glycogen (Voet and Voet, 2003).
The first step is the conversion from glycogen to glucose-1-phosphate by glycogen phosphorylase and glucose-1-phosphate is then converted to G6P by phosphoglucomutase (Voet and Voet, 2003). In hepatocytes, the phosphate group of G6P is finally removed by G6Pse (Nordlie et al., 1999), which is not presenting in muscle. The free glucose exits through glucose transporters of the cell into the bloodstream for uptake by other cells.
These hepatic functions are under tight metabolic control by hormones such as insulin, glucagon and epinephrine. In the fasting state, glucagon (released when blood glucose levels are low) binding to a G protein coupled-receptor triggers phosphorylation of enzymes and regulatory proteins by cAMP-dependent protein kinase (Protein Kinase A, PKA) (Wang et al., 2012). This results in an inhibition of glycolysis and concurrent stimulation of gluconeogenesis in the liver, providing the glucose needed for the brain and other tissues. Conversely, in the fed state, secreted insulin can suppress glucose production in liver cells by the inhibition of gluconeogenesis and glycogenolysis and induce glycogenesis.
The transcriptional coactivator peroxisome proliferator activated receptor γ coactivator-1α (PGC-1α) functions as a central regulator of gluconeogenesis by binding to several factors, including hepatic nuclear factor 4α (HNF4α) (Rhee et al., 2003) and a transcription factor called forkhead box o protein (Foxo-1) (Puigserver et al., 2003), lying upstream of several genes encoding gluconeogenic enzymes. Foxo1 plays an important role in the control of several key gluconeogenic enzymes,
including G6Pase and PEPCK. One mechanism by which insulin signaling suppresses gluconeogenesis is through phosphorylation of Foxo-1 by Akt and its subsequent exclusion from the nucleus, thus inactivating the transcription of these rate-controlling enzymes of gluconeogenesis (Hall et al., 2000).
For the induction of glycogenesis, insulin activates Akt resulting in the dephosphorylation and activation of GS through the phosphorylation and inhibition of glycogen synthase kinase-3 (GSK-3) (Ciaraldi et al., 2010; Ciaraldi et al., 2007; Nikoulina et al., 2002).
1.3 Lipid metabolism
Lipids are hydrophobic compounds, insoluble in aqueous solutions and soluble in organic solvents. Triglycerides (TGs) mainly stored in adipose tissue, for energy storage in humans. In non-adipose tissues, such as skeletal muscle, excessive TGs are associated with insulin resistance and can lead to T2D.
Foods travel to the stomach and are digested into compounds, including TGs, protein and glucose. TGs are emulsified by bile salt to facilitate the hydrolyzation to monoglycerides, FFAs and glycerol by pancreatic lipase (Mattson and Beck, 1955) in the small intestinal. Then the formations of micelles with bile salt facilitate the transport and delivery of monoglycerides, FFAs to the intestinal epithelial cells, where they are absorbed through the simple diffuse.
After entering the epithelial cell, the FFAs and monoglycerides are taken up by the endoplasmic reticulum, and here they are mainly re-esterified into new TGs. TGs are then packaged with apoprotein into blood soluble chylomicrons (CMs). CMs are excreted and travel through the bloodstream into adipocyte for storage or to muscle cells to oxidation as fuel for energy.
Adipose tissue stays in a dynamic state with continuous synthesis and breakdown of TGs. When energy is required, free fatty acids (FFAs) are released into the blood by cleaving off the glycerol from TGs, a process called lipolysis. The oxidation of fatty acids provides 9 kcal/g while the breakdown of glucose and proteins provide 4 kcal/g. In contrast, lipogenesis is a process that stores extra energy.
1.3.1 Lipogenesis
Lipogenesis is a metabolic process that converts carbohydrates to fatty acids and synthesizes TGs through the reaction of FFAs with glycerol, in adipose tissue and non-adipose tissue, such as liver.
Fatty acids synthesis builds up by the addition of two carbon units in the cytoplasm staring with acetyl-CoA, through fatty acid synthase (FAS) (Chirala and Wakil, 2004). After lipogenesis, the TGs are packaged as lipoprotein and secreted by the liver or could store energy in adipose tissue for long term.
FFAs and glycerol can be released from TGs of CMs and very-low-density lipoproteins (VLDLs) by lipoprotein lipase (LPL) (Eckel, 1989; Wood et al., 2011) secreted by adipocytes on the wall of blood vessel. After entering into the adipocytes, FFAs can be stored as TGs again in the adipose tissue (lipogenesis).
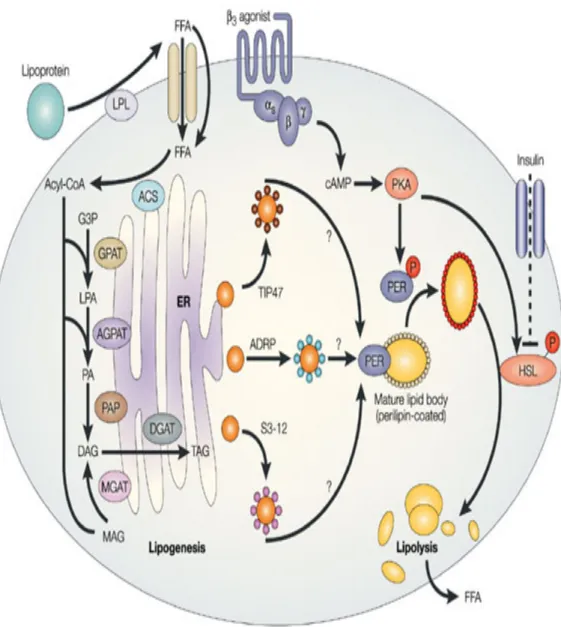
FFAs are then transported across the membrane into the cytoplasm of the cell. Through two main pathways (glycerol-3-phosphate pathway and monoacylglycerol pathway (MAG)) (Shi and Burn, 2004), as shown in Figure 2.
Glycerol-3-phosphate is esterified by glycerol 3-phosphate acyltransferases (GPAT) (Monroy et al., 1973; Wendel et al., 2009) producing 1-acylglycerol 3-phosphate (lysophosphatidate, LPA). 1-Acylglycerol-3-3-phosphate acyltransferase (AGPAT) (Cattaneo et al., 2012) catalyzes the esterification of LPA forming phosphatidate (PA). The phosphatidate phosphatases (PAP) then dephosphorylate PA producing 1,2-diacylglycerol (DAG), which can then be used to synthesize TGs. DAG can also be generated via the monoacylglycerol acyltransferase (MGAT) pathway through the acylation of MAG. The last step of the lipogenesis is catalyzed by the enzyme diacylglycerol acyltransferase (DGAT) (Harris et al., 2011a) at the endoplasmic reticulum to form an ester bond.
1.3.2 Lipolysis
Lipolysis occurs during various conditions, including stress, exercise, and fasting, and uncontrolled diabetes mellitus. Several hormones (e.g., glucagon and epinephrine) increase cyclic adenosine monophosphate (cAMP) levels, which induce PKA to phosphorylate hormone sensitive lipase (HSL), thus activating it (Shi and
Burn, 2004). Released TGs are then catabolized by HSL, adipose triglyceride lipase (ATGL), and monoglyceride lipase (MGL) to generate FFAs and glycerol, as shown in Figure 2. Lipolysis products serve for energy production, cellular signaling, or lipid synthesis.
1.3.3 Adipogenesis
Two distinct phases of adipogenesis are identified: determination of adipocytes from multipotent stem cells, (such as mesenchymal stem cells (MESCs)) and, terminal differentiation of pre-adipocytes into mature adipocytes.
For in vitro bioassays, preadipocytes, such as 3T3-L1 cells, growth arrest (near confluence) are firstly required to start cell differentiation. After growth arrest at confluence, preadipocytes receive an appropriate mitogenic and adipogenic signals to continue differentiation, such as a mix of inducers, including insulin, dexamethasone (DEX), as well as 3-isobutyl-1-methylxanthine (IBMX). These inducers activate the insulin, glucocorticoid and cAMP-signaling pathways, respectively (Feve, 2005).
After induction, grow-arrested cells undergo several rounds of DNA replication and cell division known as mitotic clonal expansion, which is accompanied by induction of CCAAT-enhancer-binding protein (C/EBP) β and C/EBP δ (Tang and Lane, 2012).
Growth arrest and clonal expansion are then followed by early and late differentiation. C/EBP and peroxisome proliferator-activated receptor γ (PPAR γ) are induced during early adipocyte differentiation.
Preadipocyte factor-1 (Pref-1), a recently described preadipocyte protein, was reported to be involved in maintaining the preadipocyte phenotype with high expression in preadipocyte and not detectable in mature adipocyte (Smas et al., 1997; Smas and Sul, 1993).
Then during the late differentiation, adipocytes markedly increase lipogenesis and acquire sensitivity to insulin, with increased expression of C/EBP α, sterol regulatory element-binding proteins-1 (SREBP-1) and PPAR γ (Loftus and Lane, 1997). These central transcriptional regulators of adipogenesis drive several adipocyte-specific gene expressions.
PPAR γ can be thought of as a “master” gene regulator of adipocyte differentiation, being both necessary and sufficient to drive conversion of fibroblastic precursors into fat cells (Tontonoz et al., 1994). Thus preadipocytes lose their fibroblastic morphology, increase lipogenesis and accumulate triglycerides, finally
become mature adipocytes and start to express characteristic adipocyte markers, such as fatty acid-binding protein 4 or adipocyte protein 2 (FABP4 or aP2), fatty acid transport protein (FATP) (Chui et al., 2005; Frohnert et al., 1999; Motojima et al., 1998) to promote FA and glycerol transport (Kishida et al., 2001), acetyl-CoA carboxylase (ACC), FAS (for FFA synthesis and lipogenesis) (Castelein et al., 1994; Jitrapakdee et al., 2005), and mitochondrial biogenesis and PGC-1α and carnitine palmitoyltransferase-1 (CPT-1, mediates the transport of fatty acids across the membrane for oxidation) for FFA oxidation (Bogacka et al., 2005a; Bogacka et al., 2005b).
1.4 Insulin receptor and insulin pathway
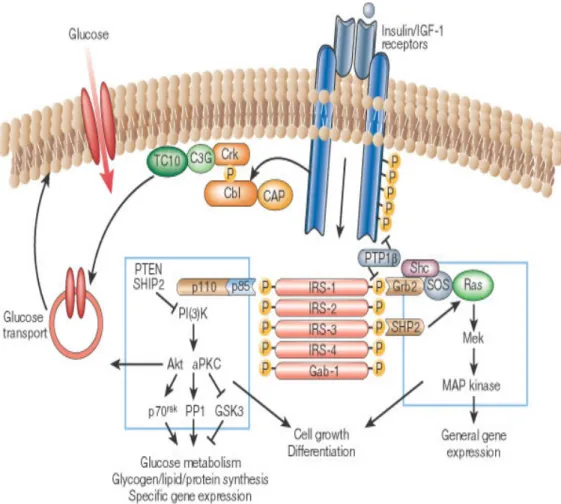
The insulin receptor is a heterotetrameric transmembrane protein receptor composed of two α subunits and two β subunits, linked by disulphide bonds. It belongs to the tyrosine kinase receptor family. Insulin or insulin-like growth factor (IGF) binds to the extracellular α subunits and brings them closer to trigger the conformational changes (Saltiel and Kahn, 2001). This enables ATP binding to the β-subunits and facilitates autophosphorylation (intrinsic tyrosine kinase activity) of various tyrosine residues and activation of the extrinsic tyrosine kinase activity of the receptor.
This autophosphorylation creates several binding sites in the receptor and promotes the recruitment of phosphotyrosine binding (PTB) domain containing substrate proteins, such as Src, Grb2, Shc, Gab-1, Cbl, APS, and the insulin receptor substrate (IRS) proteins (Kimura et al., 2002). The subsequent tyrosine phosphorylation and activation of these substrates enables them to working as docking sites for downstream effectors with Src homology 2 domain (SH2) (Kimura et al., 2002). This triggers three signaling pathways: the mitogen-activated protein kinase (MAPK) pathway, the PI3K pathway, and the CAP/Cbl/ TC10 pathways, which involving in mediating the variety of responses to insulin (Saltiel and Kahn, 2001).
Figure 3: Insulin signaling pathways (Saltiel and Kahn, 2001).
1.4.1 PI3K pathway
The PI3K pathway plays a central role in the metabolic actions of insulin and controls gluconeogenesis, glycogen and protein synthesis as well as glucose transport through GLUT4 translocation (Kido et al., 2001). It consists of a p110 catalytic subunit and a SH2 domains containing p85 regulatory subunit. Binding through the SH2 domain to IRS-1 leads to the phosphorylation and activation of PI3K. After activation, PI3K can convert the membrane lipid phosphatidylinositol 4,5-bisphosphate (PIP2) to phosphatidylinositol 3,4,5-triphosphate (PIP3). The increase in intracellular PIP3 leads to activation of the PI-dependent kinase-1 and -2 (PDK1 and PDK2), which phosphorylate the protein kinase B (PKB or /Akt) on amino acid residues threonine 308 and serine 473 (Hill et al., 2002; Stokoe et al., 1997), leading
to its activation. Akt has been shown to mediate actions of insulin on GSK-3, the mammalian target of rapamycin (mTOR) and others such as PEPCK, GLUT4. PI3K/PDK1 also phosphorylate and activate atypical isoforms of PKC zeta and PKC delta (Chou et al., 1998; Le Good et al., 1998).
1.4.2 MAPK pathway
The MAPK pathway is involved in mitogenic cellular responses, cell growth and survival. Insulin triggers the MAPK pathway upon translocation and binding of cytosolic adaptor protein growth factor receptor binding protein 2 (Grb2) to phosphorylated Shc or IRS proteins via its SH2 domain. Grb2, through its SH3 domain, is then able to bind to mammalian son of sevenless (SOS), a guanyl nucleotide exchange factor (GEF) that catalyzes the exchange of guanosine diphosphate (GDP) for GTP on Ras (a small GTP binding protein), thus resulting in activation of Ras (Vanderkuur et al., 1997). Upon activation, Ras binds the protein kinase Raf, recruiting Raf to the plasma membrane, which results in Raf activation (Avruch et al., 2001). Ras-Raf then activates MAP kinase-kinase (MEK) and MAP kinases ERK1 and ERK 2 (Vanderkuur et al., 1997). The activated MAPKs enter the nucleus and phosphorylate various nuclear transcription factors to elicit their actions.
1.4.3 CAP/Cbl/ TC10 pathways
This signalling cascade is initiated when the activated insulin receptor recruits and activates the adaptor proteins (APS) binding Cbl, Cbl and Cbl-associated protein (CAP) (Onnockx et al., 2009). CAP belongs to a family of adapter proteins with common SH3 domains and sorbin homology (SoHo) domain. Upon phosphorylation, the Cbl–CAP complex translocates to lipid raft domains (in the plasma membrane), by the interaction of the SoHo domain in CAP with the flotillin protein (Baumann et al., 2000) (Chang et al., 2004). Translocation of Cbl then recruits the adapter protein Crk and the GEF C3G to the membrane, where C3G catalyses the exchange of GTP in place of GDP on G protein TC10 (Chang et al., 2004). Once activated, GTP-bound TC10 provides another signal to the GLUT4 protein and promotes its translocations to the membrane, in parallel with the activation of the PI3K pathway.
1.5 Other mechanisms involved in energy metabolism:
1.5.1 AMPK pathway
AMPK is a “metabolic master switch”, which regulates whole-body and cellular energy metabolism, activated in condition of intracellular ATP depletion, including fasting, heat shock, hypoxia and exercise. The activation of AMPK regulates many downstream pathways to inhibit energy-consuming anabolic pathways (such as fatty acid and cholesterol synthesis, gluconeogenesis, protein synthesis and insulin secretion from β-cell) and accelerate ATP-producing catabolic ones (such as glucose uptake, fatty acid uptake and oxidation and mitochondrial biogenesis), as shown in Figure 4 (Hardie, 2011; Towler and Hardie, 2007).
Figure 4: AMPK functions involved in energy metabolism (Hardie, 2004).
AMPK is a heterotrimeric protein, composed of a catalytic (α) and two non-catalytic (β and γ) subunits (Xiao et al., 2011). When the AMP to ATP ratio increases, AMP binds to both Bateman domains and leads to a conformational
change in the γ subunit, which exposes the catalytic domain of the α subunit. Moreover, as an allosteric activator, AMP also could make AMPK a poorer substrate for dephosphorylation.
AMPK becomes activated when phosphorylated at threonine 172 by an upstream AMPK kinase (AMPKK) and inactivated by dephosphorylation (Oakhill et al., 2011; Xiao et al., 2011). One kinase activator of AMPK is Ca2+ -calmodulin-dependent kinase kinase β (CaMKKβ) (Oakhill et al., 2011), which responses to increased calcium and is primarily expressed in the brain. The serine/threonine liver kinase B 1 (LKB1) is required for the activation of AMPK (Oakhill et al., 2011). The active LKB1 is actually a complex of three proteins, including LKB1, Ste20-related adaptor (STRAD) and mouse protein 25 (MO25). Phosphorylation of AMPK by LKB1 also occurs on T172. LKB1 is widely expressed, and it is the primary AMPK-regulating kinase. AMPK could also be activated by receptors that are coupled to phospholipase C-γ (PLC γ) and by adipokines such as adiponectin and leptin (Carling et al., 2008).
Figure 5: PPAR γ activation and mechanisms involved in glucose and lipid metabolism. Adapted form http://inflammablog4.blogspot.ca/2011/05/ppar-gamma-pathway-i-included-this.html
1.5.2 PPAR γ and regulation of lipid homeostasis
When PPAR γ is bound with a ligand or other agonist, it becomes active and complexes with another transcription factor; namely, retinoid X-receptor (RXR) (Chandra et al., 2008). The complex PPAR-γ-RXR, with several co-activators is then bound to a specific DNA motif, known as peroxisome proliferate response element (PPREs) in the promoters of target gene (Lenhard, 2001), as shown in Figure 5.
Activation of PPAR γ regulates a variety of adipocyte genes involved in virtually all pathways of lipid metabolism to increase FFAs influx to adipocyte and storage as TGs: LPL to promote FFAs release from circulating lipoproteins (Schoonjans et al., 1996), low density lipoprotein (LDL) receptor, fatty acid-binding protein 4 or adipocyte protein 2 (FABP4 or aP2), CD36, fatty acid transport protein (FATP) (Chui et al., 2005; Frohnert et al., 1999; Motojima et al., 1998) to promote FA and glycerol transport (Kishida et al., 2001), PEPCK to enhance glyceroneogenesis (Tontonoz et al., 1995), acetyl-CoA carboxylase (ACC), FAS (for FFA synthesis and lipogenesis) (Castelein et al., 1994; Jitrapakdee et al., 2005), and mitochondrial biogenesis and PGC-1α and carnitine palmitoyltransferase-1 (CPT-1, mediates the transport of fatty acids across the membrane for oxidation) for FFA oxidation (Bogacka et al., 2005a; Bogacka et al., 2005b).
PPAR γ activation functions as an “adipose remodeling factor” that could redistribute lipids from non adipose tissue and insulin-resistant adipocytes into differentiated and insulin-sensitive adipocytes by enhancing adipogenesis, regulating adipokines, increasing adiponectin, decreasing leptin, tumor necrosis factor-α (TNF-α) and FFAs and exerting insulin-sensitizing effects (Bermudez et al., 2010; Lenhard, 2001) as shown in Figure 6. The typical adipocyte remodeling induced by PPAR-γ agonist involves an increased number of small insulin-sensitive adipocytes and fewer large insulin-resistant adipocytes (Bergman et al., 2006; Laplante et al., 2003).
Figure 6: PPAR γ activation and improved insulin sensitivity.
1.6 Metabolic syndrome and obesity
1.6.1 Metabolic syndrome
Metabolic syndrome (MetS) in an individual reflects the clustering of multiple metabolic abnormalities, including central obesity, T2D, dyslipidemia, hypertension, and non-alcoholic fatty liver disease (NAFLD). The definition of the MetS determined by the International Diabetes Federation (IDF) includes central obesity (increased waist circumference (WC) or waist-to-hip ratio of over 102 cm and 0.90 for males, and of over 88 cm and 0.85 for females respectively) and at least 2 of the following: increased fasting serum glucose (over 5.6 mmol/L), TGs (over 150 mg/dL), blood pressure (over 130/ 85 mm Hg), or a low HDL cholesterol concentration (under 40 mg/dL in males, under 50 mg/dL in females) (Alberti et al.,
2005). Other MetS definitions have been put forth by the National Cholesterol Education Program-Adult Treatment Panel III (ATPIII) (Grundy et al., 2005) and the WHO (Alberti and Zimmet, 1998), who both imparted similar risks to MetS for developing cardiovascular disease and diabetes.
1.6.2 Obesity
Obesity is defined as excessive fat accumulation, which may impair health. Body mass index (BMI) is commonly used to determine obesity in adults, which is defined as a person's weight divided by the square of the height (kg/m2) (WHO, 2012). The individual with BMI greater than 30 is considered to be obese (WHO, 2012). Obesity, particularly central or visceral obesity, is associated with several diseases, including cardiovascular disease, diabetes and NAFLD.
Indeed, many investigations demonstrated that excess in visceral adipose tissue (VAT) or abdominal adipose tissue (known as central obesity), but not that in subcutaneous adipose tissue, was characterized with adipocyte dysfunction and significantly correlated with insulin resistance, T2D, and cardiovascular disease (Banerji et al., 1999; Banerji et al., 1997; Fujimoto et al., 1999; Pouliot et al., 1992).
1.6.3 Adipocyte dysfunction, inflammation and insulin resistance
The importance of adipose tissue is confirmed by observations made in lipoatrophic diabetes in mice and human (Gavrilova et al., 2000) (Sovik et al., 1996). Such “individuals” have no white fat tissue (Reitman and Gavrilova, 2000). They also suffer from severe metabolic disorders (Sasaki et al., 1992), including insulin resistance, hyperglycemia, hyperlipidemia, and fatty livers. Therefore, having a proper quantity of functional adipose tissues is crucial (Gavrilova et al., 2000); too many (obesity) or too less (lipoatrophy) adipose tissue impairing energy homeostasis and insulin sensitivity.As we discussed in lipid metabolism in chapter 1.3, adipocytes store energy as triglyceride (lipogenesis and adipogenesis) and release fatty acids (lipolysis) to the blood or to be used for energy through oxidation. Human adipocytes can grow up to 20 fold in diameter and several thousand-fold in volume (Jernas et al., 2006).
However when there is too much excess energy, adipocytes become too large (hypertrophy), and hypoxia occurs (Kabon et al., 2004; Ye et al., 2007) due to inadequate blood flow (West et al., 1987) in the expanded adipose tissue
Stressed and hypertrophied adipocytes secrete monocyte chemo-attractant protein-1 (MCP-1) and other chemo-attractants to increase macrophage infiltration (Harman-Boehm et al., 2007) into adipose tissue. Adipose tissue of lean subjects usually consists of less than 10% macrophages, whereas in obese patients, macrophage content can rise as high as 50% (Weisberg et al., 2003).
Infiltrating macrophage recruitment in turn results in adipocytes producing more pro-inflammatory adipokines and cytokines, such as TNFα (Hotamisligil et al., 1993). This low-grade chronic inflammation decreases energy storage and increases lipolysis (Xu et al., 2003). The excess FFAs (Horowitz and Klein, 2000) and altered adipokines result in the accumulation of lipids in non-adipose tissue, including the liver and muscle, causing lipotoxicity and impairing the normal metabolism and insulin sensitivity.
1.6.4 Adipose tissue and adipokines
Adipose tissue is not only the main site for energy storage and a master regulator of whole-body lipid flux (by lipogenesis and fatty acid releasing and oxidation), but also functions as an endocrine organ. It modulates both glucose and lipid metabolism in other tissues by secreting a number of adipokines, including adiponectin, leptin, resistin, TNF-α, interleukin (IL)-1, and IL-6.
Leptin plays a key role in inhibiting energy intake and promoting energy expenditure by acting on the receptors in the central nervous system. Humans and mice lacking leptin demonstrate obesity. Obesity and T2D are often associated with leptin deficiency or resistance, deregulating satiety signals (Considine et al., 1996), and are characterized by an elevated leptin-to-adiponectin ratio.
Adiponectin (also called Acrp30 or adipoQ) is a fat cell-derived peptide and modulates glucose and fatty acid handling (Diez and Iglesias, 2003). Adiponectin is an insulin-sensitizing hormone with antidiabetic, inflammatory and anti-atherosclerotic properties (Diez and Iglesias, 2003; Ukkola O, 2002). Acute treatment
of mice with adiponectin decreases insulin resistance, plasma FFAs and the TGs content of muscle and liver, while increasing expression of genes involved in fatty-acid oxidation and energy expenditure (Yamauchi et al., 2001).
Inflammatory cytokines such as TNF-α are also adipocyte derived. The serum concentration of TNF-α is increased in obesity and is associated with chronic and low-grade inflammation of metabolic disease. TNF-α could induce insulin resistance by phosphorylation of IRS-1 at serine sites (Krogh-Madsen et al., 2006).
1.7 Diabetes mellitus
1.7.1 Diabetes definition and diagnosis
As one of the chronic metabolic disease, diabetes mellitus is characterized by hyperglycemia. It might be caused by from impaired insulin secretion and/or insulin resistance (IR); the later being determined by impaired sensitivity of insulin in target organs (adipose tissue, liver, and muscle) (DeFronzo and Ferrannini, 1991).
According to WHO, diabetes is diagnosed when fasting plasma glucose levels reach higher than 7.0 mmol/L (126 mg/dL) or when plasma glucose reaches higher than 11.1 mmol/L (200 mg/dL) 2 hours after an oral glucose tolerance test (OGTT) (WHO, 1999). There are also two pre-diabetic states. Impaired fasting glucose (IFG) is recognized when fasting glucose levels range from 6.1 to 6.9 mmol/L (110 to 125 mg/dL), whereas impaired glucose tolerance (IGT) is characterized by plasma glucose levels between 7.8 mmol/ L to 11.1 mmol/L (140 mg/dL to 200 mg/dL) 2 hours after OGTT (WHO, 1999).
1.7.2 Diabetes classification
Diabetes is classified into four categories: type 1 diabetes; type 2 diabetes; type 3 or others specific types; and type 4, gestational diabetes (ADA, 2006, 2011). They differ in terms of their causes and in their distribution in different populations. However, each type of diabetes will result in insufficient production and/or action of insulin to reduce blood glucose and will lead to hyperglycemia.
1.7.2.1 Type 1 diabetes (T1D)
This form of diabetes, previously called insulin-dependent diabetes or juvenile diabetes, accounts for only 5-10% of cases and the majority of which are found in children (ADA, 2011). T1D is caused by β cell destruction and absolute deficiency of insulin secretion, involving cellular mediated autoimmune or idiopathic origins (Skyler, 2011).
Most patients are otherwise healthy and not obese when onset occurs. Irregular hyperglycemia and ketoacidosis sometimes accompany newly recognized or untreated T1D. This type of diabetes is treated with exogenous insulin therapy, along with lifestyle management.
1.7.2.2 Type 2 diabetes (T2D)
T2D, formerly referred to as insulin-independent diabetes, is the most common type and accounts for 90-95% of all the diabetes cases (ADA, 2011). It is characterized by insulin resistance associated with relative (rather than absolute) insulin deficiency. Most patients with T2D are obese, and others who are not obese may have metabolic disorders and increased abdominal fat.
This category goes undiagnosed for a long period of time because it develops gradually and the degree of hyperglycemia may be not sufficient to cause clinical symptoms in the early stage. The risk of developing T2D increases with obesity, age and lack of physical activity (Ansari, 2009; Colberg et al., 2010). Most patients need lifestyle modification as well as oral hypoglycemic drugs to control blood glucose. Insulin therapy may be not required initially but regularly occurs when β cell mass becomes insufficient as described further below.
1.7.2.3 Type 3 diabetes
Others specific types of diabetes are less common and can result from a variety of conditions, including specific genetic defects, endocrinopathies, drugs, infections, and other illnesses. For example, maturity onset diabetes of the young (MODY) might be caused by monogenetic defects (ADA, 2011). MODY 3, MODY 2 and MODY 1 are the most common forms of MODY, which are caused by
mutation of HNF 4A, glucokinase and HNF 1 A genes respectively (Bell and Polonsky, 2001; Fajans, 1990).
1.7.2.4 Type 4 diabetes
Gestational diabetes mellitus (GDM) is diabetes with hyperglycemia, which is first recognized during pregnancy. It increases the risk of complications for both mother and neonate. It occurs in about 2%–10% of all pregnancies and is associated with the placental hormones being implicated in the development of insulin resistance (Desoye and Hauguel-de Mouzon, 2007). While GDM may go away after pregnancy, women who have had GDM have great risks of developing diabetes (mainly T2D) later in life (Kim et al., 2007; Oubré et al., 1997).
1.7.3 Pathogenesis of T2D
A variety of pathogenic processes are believed to be involved in the development of T2D. They range from insulin resistance (IR) in the complex pathways of the hormone action, to β cell failure in the pancreas with consequent insulin deficiency.
T2D is considered to be a chronic and progressive disease. In the early stages of T2D, the abnormal high blood glucose is compensated by increased insulin production and secretion by β cells, generating hyperinsulinemia and termed β cell compensation. As the disease progresses, β cells become unable to secret enough insulin for the body's needs and β cells failure occurs. This failure includes loss of β cells mass due to apoptosis (Butler et al., 2003) and secretory defect. Several factors are involved, such as genetic determinants, chronic inflammation, glucotoxicity and lipotoxicity (Buchanan, 2003).
Insulin resistance is characterized with an impaired biologic response to either exogenous or endogenous insulin. So in IR patients, insulin fails to promote peripheral glucose utilization through glucose uptake (Utriainen et al., 1998) in muscle and adipose tissue; unable to suppress hepatic glucose production (Vaag et al., 1995); and fails to stimulate TGs production and to decrease lipolysis thereby resulting more FFAs efflux from adipocytes (Kelsey et al., 2013).
The majority of T2D patients are overweight or obese; however not all obese persons have insulin resistance. About 50% of overweight and 30% of obese adults are metabolically healthy in the USA (Wildman et al., 2008); that is, they do not have diabetes or exhibit disturbances in glucose and lipid metabolism. In reverse, such metabolic abnormalities occur in 23.5 % of people with normal body weights. So it is now commonly accepted that chronic and low-grade inflammation associated with visceral obesity (bad fat or abdominal fat, more details discussed in 1.6.2 and 1.6.3) are involved in insulin resistance and T2D.
The cellular and molecular mechanisms underlying IR are still not fully understood. Several molecular mechanisms may contribute to IR, specifically in insulin responsive tissues such as liver, muscle and adipose tissue. These include decreases in 1) insulin receptor expression and tyrosine kinase activity; 2) the expression and phosphorylation of IRS-1/2; and 3) PI3K activity. It is reported that decreased expression of IRS-1 protein and especially increased IRS-1 serine phosphorylation is associated with IR (Anai et al., 1998; Goodyear et al., 1995; Kerouz et al., 1997; Saad et al., 1992; Stephens et al., 1997). The serine phosphorylation of IRS proteins reduces the ability of IRS proteins to attract PI3K. This impairs downstream effectors (Aguirre et al., 2002) and can also accelerate the degradation of the IRS-1 protein (Shah et al., 2004). Several serine/threonine kinases have been shown to phosphorylate IRS-1 within various inflammatory signalling pathways, such as c-Jun N-terminal kinase (JNK1), IκB kinase-β (IKK-β), or PKC. Furthermore, suppressor-of-cytokine-signalling (SOCS) proteins, upregulated by the cytokine IL-6, interfere with insulin signaling by promoting the degradation of IRS-1 and IRS-2 (Wellen and Hotamisligil, 2003).
1.7.4 Diabetes symptoms and complications
Symptoms of marked hyperglycemia include polyuria, polydipsia, and polyphagia accompanied by weight loss as well as blurred vision and others. Acute, consequences of uncontrolled diabetes are hyperglycemia with ketoacidosis and the nonketotic hyperosmolar syndrome (Kitabchi et al., 2001; Peden et al., 1984), which are two acute complications of diabetes that can result in increased morbidity and
mortality. Diabetes ketoacidosis is characterized by hyperglycemia, metabolic acidosis, especially high level of total body ketone, while hyperglycemia hyperosmolar syndrome is characterized by hyperglycemia and high osmolality without ketoacidosis (Gerich et al., 1971).
Long-term chronic complications of diabetes are divided into microvascular and macrovascular. Microvascular complications include retinopathy, nephropathy and neuropathy. These are recognized as the three major complications of diabetes and increase the risk of blindness, kidney failure or diabetic foot (ulcers and amputations) (ADA, 2011). Macrovascular complications include cardiovascular disease, cerebrovascular disease as well as peripheral vascular disease, leading to increased mortality and morbidity rates in T2D (ADA, 2011).
In the Canadian Institutes of Health Research Team in Aboriginal Antidiabetic Medicines (CIHR-ATTM) project (described further below), the following 15 symptoms and complications were used to ask informants about traditional remedies that would have beneficial potential for T2D: arthritis/rheumatism; frequent headaches; back and/or kidney pain; diarrhea; swelling and/or inflammation; general weakness; increased appetite; heart and/or chest pain; increased thirst; abscesses and/or boils; blurred vision; increased urination; foot numbness and/or foot sores; slow healing infections; and sore and/or swollen limbs (Leduc et al., 2006).
1.7.5 Diabetes treatment
Optimal glycemic control is the fundament and the main goal for the management of diabetes (Cade, 2008). For poorly controlled diabetes, excess glucose molecules enter into the red blood cells and attach to the hemoglobin to form glycated hemoglobin (A1C) through nonenzymatic reactions. A buildup of A1C stays for the lifespan of a red blood cell, so reflects blood glucose control for the past 2 to 3 months (Gonen et al., 1977). A1C test is considered to be a gold standard for long-term glycemic control (Nathan et al., 1984). The A1C concentration of 7.0% or less is recommended as a target for all patients with diabetes to reduce the risk of complications; and a target A1C concentration of 6.5% or less in T2D to further